Analysis Summary
Notes:
- 1) No attempt has been made to eliminate the non-significant decimal places.
- 2) This batgrbproduct analysis is done using the HEASARC data.
- 3) This batgrbproduct analysis is using the flight position for the mask-weighting calculation.
======================================================================
                  BAT GRB EVENT DATA PROCESSING REPORT
    Process Script Ver: batgrbproduct v2.48
    Process Start Time: Fri Jul 29 23:58:28 EDT 2022
             Host Name: batproc1
   Current Working Dir: /local/data/bat1/alien/Swift_3rdBATcatalog/event/batevent_reproc/trigger1034721
======================================================================

  Trigger: 01034721      Segment: 000

  BAT Trigger Time: 636007463.808   [s; MET]
      Trigger Stop: 636007464.832   [s; MET]
               UTC: 2021-02-26T04:43:57.235560    [includes UTCF correction]
       Where From?: TDRSS position message

  BAT
    RA: 124.138231185969   Dec: 57.57733773921  [deg; J2000]

     Catalogged Source?: NO
     Point Source?:      YES
     GRB Indicated?:     YES    [ by BAT flight software ]
     Image S/N Ratio:    11.81
     Image Trigger?:     NO
     Rate S/N Ratio:     22.6274169979695  [ if not an image trigger ]
     Image S/N Ratio:    11.81

  Analysis Position:   [ source = BAT ]
    RA: 124.138231185969   Dec: 57.57733773921  [deg; J2000]

  Refined Position:   [ source = BAT pre-slew burst ]
    RA: 124.157085434342   Dec: 57.5831657319961  [deg; J2000]
        { 08h 16m 37.7s , +57d 34' 59.4" }
         +/- 1.50341596224325 [arcmin] (estimated 90% radius based on SNR)
         +/- 0.860751680022609 [arcmin] (formal 1-sigma fit error)
    SNR: 16.9882309214439

  Angular difference between the analysis and refined position is 0.700072 arcmin

  Partial Coding Fraction: 0.4765625    [ including projection effects ]

  Duration
     T90: 20.8040000200272 +/- 1.67595820361737
        Measured from: -1.26800000667572
                   to: 19.5360000133514     [s; relative to TRIGTIME]
     T50: 11.5239999294281 +/- 4.35791703830864
        Measured from: 0.304000020027161
                   to: 11.8279999494553     [s; relative to TRIGTIME]


  Fluence
     Peak Flux  (peak 1 second)
        Measured from: 0.0240000486373901
                   to: 1.02400004863739     [s; relative to TRIGTIME]
     Total Fluence
        Measured from: -1.92400002479553
                   to: 20.9520000219345     [s; relative to TRIGTIME]

             Band 1     Band 2     Band 3     Band 4
              15-25      25-50     50-100    100-350     keV
 Total     0.429368   0.726543   0.553586   0.198532
           0.052333   0.055138   0.049764   0.044156 [error]
 Peak      0.076198   0.123201   0.099971   0.050579
           0.011557   0.013289   0.012763   0.010639 [error]

     [ fluence units of on-axis counts / fully illuminated detector ]

======================================================================


====== Table of the duration information =============================

        Value   tstart    tstop
T100   22.876   -1.924   20.952
T90    20.804   -1.268   19.536
T50    11.524    0.304   11.828
Peak    1.000    0.024    1.024


====== Spectral Analysis Summary =====================================

Model      : spectral model: simple power-law (PL) and cutoff power-law (CPL)
Ph_index   : photon index: E^{Ph_index}
Ph_90err   : 90% error of the photon index
Epeak      : Epeak in keV
Epeak_90err: 90% error of Epeak
Norm       : normalization at 50 keV in both the PL model and CPL model
Nomr_90err : 90% error of the normalization
chi2       : Chi-Squared
dof        : degree of freedo

=== Time-averaged spectral analysis ===
(Best model with acceptable fit: N/A)

Model Ph_index Ph_90err_low Ph_90err_hi  Epeak  Epeak_90err_low  Epeak_90err_hi  Norm       Nomr_90err_low    Norm_90err_hi    chi2    dof
PL      -1.441    -0.145      0.145       -           -               -         5.67e-03     -4.91e-04          4.91e-04      71.610   57
CPL     -0.862    -0.555      0.635      101.319     -29.912       627.034      1.10e-02     -5.03e-03          1.12e-02      68.410   56


=== 1-s peak spectral analysis ===
(Best model with acceptable fit: N/A)

Model Ph_index Ph_90err_low Ph_90err_hi  Epeak  Epeak_90err_low  Epeak_90err_hi  Norm       Nomr_90err_low    Norm_90err_hi    chi2    dof
PL      -1.306     -0.203     0.202       -           -               -         2.37e-02     -2.74e-03          2.73e-03      78.120   57
CPL     -1.310     -0.722    -0.682     9999.010      N/A           N/A         2.36e-02        N/A               N/A         78.150   56


=== Fluence/Peak Flux Summary ===

              Model    Band1     Band2     Band3     Band4     Band5     Total
                       15-25     25-50    50-100    100-350    15-150    15-350    keV
Fluence         PL   1.57e-07  2.99e-07  4.40e-07  1.39e-06  1.24e-06  2.29e-06   erg/cm2
      90%_error_low -2.32e-08 -2.79e-08 -4.73e-08 -2.94e-07 -1.16e-07 -3.34e-07   erg/cm2
      90%_error_hi   2.41e-08  2.77e-08  4.70e-08  3.43e-07  1.17e-07  3.72e-07   erg/cm2
Peak flux       PL   8.10e-01  9.15e-01  7.40e-01  9.98e-01  2.83e+00  3.46e+00   ph/cm2/s
      90%_error_low -1.68e-01 -1.20e-01 -1.04e-01 -2.66e-01 -3.33e-01 -4.13e-01   ph/cm2/s
      90%_error_hi   1.79e-01  1.18e-01  1.02e-01  3.19e-01  3.34e-01  4.18e-01   ph/cm2/s

Fluence        CPL   1.41e-07  3.17e-07  4.61e-07  6.45e-07  1.20e-06  1.56e-06   erg/cm2
      90%_error_low -2.71e-08 -3.30e-08 -5.28e-08 -3.17e-07 -1.26e-07 -3.37e-07   erg/cm2
      90%_error_hi   2.80e-08  3.41e-08  5.39e-08  7.02e-07  1.25e-07  6.93e-07   erg/cm2
Peak flux      CPL   8.11e-01  9.15e-01  7.40e-01  1.01e+00  2.83e+00  3.47e+00   ph/cm2/s
      90%_error_low -2.06e-01 -1.20e-01 -1.02e-01 -5.66e-01 -3.41e-01 -6.83e-01   ph/cm2/s
      90%_error_hi   1.05e-01  1.32e-01  1.22e-01  3.13e-01  3.32e-01  3.83e-01   ph/cm2/s

======================================================================
Image
Pre-slew 15.0-350.0 keV image (Event data)
#   RAcent    DECcent   POSerr    Theta     Phi              Peak Cts       SNR   Name
  124.1571    57.5832   0.0113    41.8961    -8.3363         1.6635942     16.988 TRIG_01034721

Foreground time interval of the image:
 -1.924  16.693 (delta_t =  18.617 [sec])
Background time interval of the image:
-239.808  -1.924 (delta_t = 237.884 [sec])
Light Curves
Note: The mask-weighted lightcurves have units of either count/det or counts/sec/det, where a det is 0.4 x 0.4 = 0.16 sq cm.
Full-time range; 1 s binning
Other quick-look light curves:
- 64 ms binning (zoomed)
- 16 ms binning (zoomed)
- 8 ms binning (zoomed)
- 2 ms binning (zoomed)
- SN=5 or 10 s binning (full-time range)
- Raw light curve
Spectra
- 64 ms binning (zoomed)
- 16 ms binning (zoomed)
- 8 ms binning (zoomed)
- 2 ms binning (zoomed)
- SN=5 or 10 s binning (full-time range)
- Raw light curve
Spectra
Notes:
- 1) The fitting includes the systematic errors.
- 2) When the burst includes telescope slew time periods, the fitting uses an average response file made from multiple 5-s response files through out the slew time plus single time preiod for the non-slew times, and weighted by the total counts in the corresponding time period using addrmf. An average response file is needed becuase a spectral fit using the pre-slew DRM will introduce some errors in both a spectral shape and a normalization if the PHA file contains a lot of the slew/post-slew time interval.
- 3) For fits to more complicated models (e.g. a power-law over a cutoff power-law), the BAT team has decided to require a chi-square improvement of more than 6 for each extra dof.
Time averaged spectrum fit using the average DRM
Power-law model
Time interval is from   -1.924 sec. to   20.952 sec.

Spectral model in power-law:
------------------------------------------------------------
Parameters  : value       lower 90%   higher 90%
Photon index: -1.44065     ( -0.14499   0.144909 )
Norm@50keV  : 5.67314E-03    ( -0.000491298   0.000490672 )
------------------------------------------------------------
#Fit statistic  : Chi-Squared                   71.61     using 59 bins.
 Reduced chi-squared = 1.25632
# Null hypothesis probability of 9.22e-02 with 57 degrees of freedom

Photon flux (15-150 keV)    in 22.88 sec: 0.697542 ( -0.062145  0.062281 ) ph/cm2/s
Energy fluence (15-150 keV)             : 1.24442e-06 ( -1.16322e-07  1.17171e-07 ) ergs/cm2
Cutoff power-law model
Time interval is from   -1.924 sec. to   20.952 sec.
Spectral model in the cutoff power-law:
------------------------------------------------------------
Parameters  : value       lower 90%   higher 90%
Photon index: -0.862411     ( -0.554909   0.63519 )
Epeak [keV] : 101.319      ( -29.9122 627.034 )
Norm@50keV  : 1.09621E-02    ( -0.00503154   0.0112204 )
------------------------------------------------------------
#Fit statistic  : Chi-Squared                   68.41     using 59 bins.
 Reduced chi-squared = 1.22161
# Null hypothesis probability of 1.23e-01 with 56 degrees of freedom

Photon flux (15-150 keV)    in 22.88 sec: 0.681656 ( -0.063931  0.064046 ) ph/cm2/s
Energy fluence (15-150 keV)             : 1.20115e-06 ( -1.2551e-07  1.25135e-07 ) ergs/cm2
1-s peak spectrum fit
Power-law model
Time interval is from    0.024 sec. to    1.024 sec.

Spectral model in power-law:
------------------------------------------------------------
Parameters  : value       lower 90%   higher 90%
Photon index: -1.30563     ( -0.203283   0.202438 )
Norm@50keV  : 2.37059E-02    ( -0.0027357   0.00272871 )
------------------------------------------------------------
#Fit statistic  : Chi-Squared                   78.12     using 59 bins.
 Reduced chi-squared = 1.37053
# Null hypothesis probability of 3.31e-02 with 57 degrees of freedom

Photon flux (15-150 keV)    in 1 sec: 2.83116 ( -0.33319  0.33388 ) ph/cm2/s
Energy fluence (15-150 keV)             : 2.33965e-07 ( -3.00919e-08  3.02941e-08 ) ergs/cm2
Cutoff power-law model
Time interval is from    0.024 sec. to    1.024 sec.
Spectral model in the cutoff power-law:
------------------------------------------------------------
Parameters  : value       lower 90%   higher 90%
Photon index: -2.02836     ( -0.00389424   0.0357975 )
Epeak [keV] : 10.8513      (   )
Norm@50keV  : 7.43198E-03    (     )
------------------------------------------------------------
#Fit statistic  : Chi-Squared                   76.12     using 59 bins.
 Reduced chi-squared = 1.35929
# Null hypothesis probability of 3.81e-02 with 56 degrees of freedom

Photon flux (15-150 keV)    in 1 sec: 2.83208 ( -0.34126  0.3319 ) ph/cm2/s
Energy fluence (15-150 keV)             : 2.34062e-07 ( -3.13544e-08  3.02397e-08 ) ergs/cm2
Time-resolved spectra
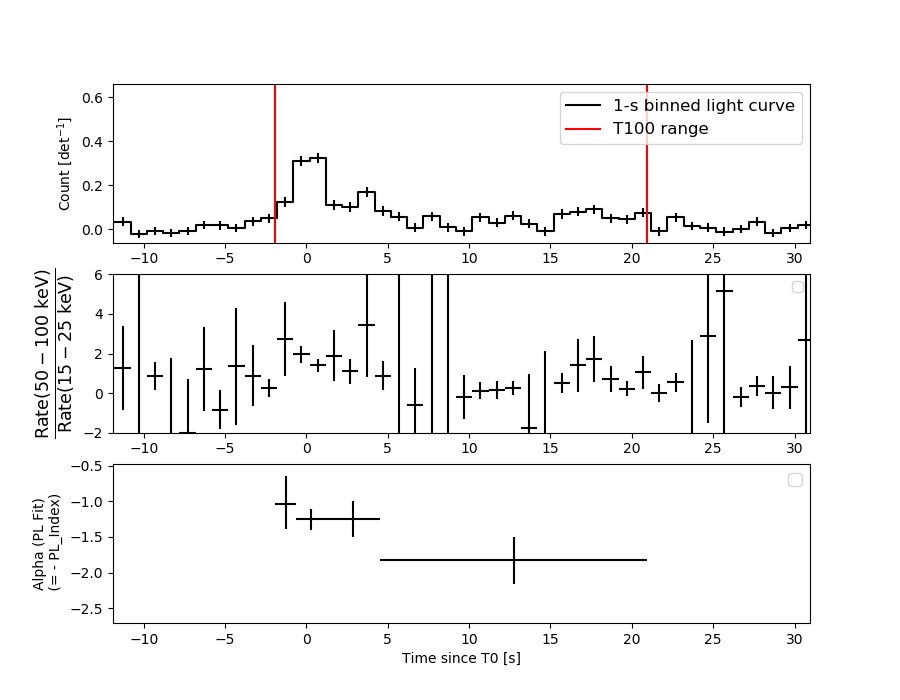
Distribution
T90 vs. Hardness ratio plot
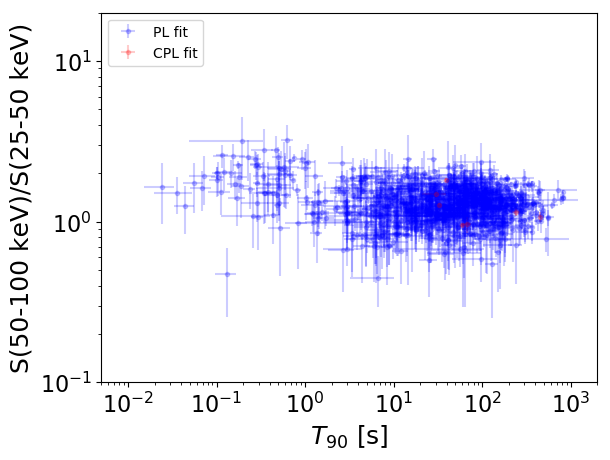
T90                                   = N/A sec.
Hardness ratio (energy fluence ratio) = N/A
S(15-50 keV) vs. S(50-150 keV) plot
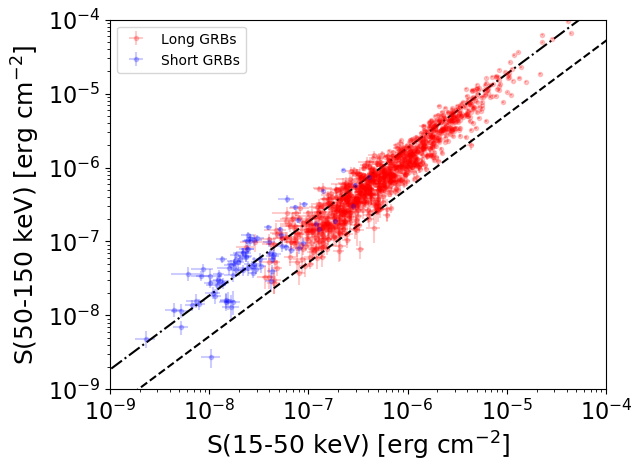
S(15-50 keV)  = N/A
S(50-150 keV) = N/A
The dash-dotted line and the dashed line traces the fluences calculated from the Band function with Epeak = 15 and 150 keV, respectively. Both lines assume a canonical values of alpha = -1 and beta = -2.5.
Mask shadow pattern
IMX = 8.876470664433727E-01, IMY = 1.300681625568585E-01
Spacecraft aspect plot
Bright source in the pre-burst/pre-slew/post-slew images
Pre-burst image of 15-350 keV band
Time interval of the image:
-239.808000 -1.924000

# RAcent  DECcent POSerr Theta    Phi  PeakCts   SNR AngSep     Name
#  [deg]    [deg]    ['] [deg]  [deg]                   [']
 83.6448  22.0262    0.5  30.0  -89.8  10.5810  21.2    1.0	Crab
133.3891 -28.8570    2.9  48.6  142.4   5.9263   4.0 ------	UNKNOWN
158.6531  32.0132    3.2  42.6   44.3   2.8716   3.6 ------	UNKNOWN
122.7691 -21.4930    2.9  38.6  152.3   2.2279   4.0 ------	UNKNOWN
157.3589  61.0460    3.5  54.0    8.1   4.1475   3.3 ------	UNKNOWN
118.0108   8.4583    3.6   8.4  142.3   0.9348   3.2 ------	UNKNOWN
 91.1689 -13.5527    2.7  37.9 -156.3   1.9590   4.2 ------	UNKNOWN
 93.4420  68.6592    3.1  54.1  -25.2   4.4677   3.7 ------	UNKNOWN
Pre-slew background subtracted image of 15-350 keV band
Time interval of the image:
-1.924000 16.692600

# RAcent  DECcent POSerr Theta    Phi  PeakCts   SNR AngSep     Name
#  [deg]    [deg]    ['] [deg]  [deg]                   [']
 83.6797  21.8799    4.7  29.9  -90.1  -0.2294  -2.5    8.5	Crab
126.0103 -19.6796    2.2  37.6  146.8   0.5754   5.2 ------	UNKNOWN
131.0507  42.2278    2.9  29.4    9.1   0.2786   4.0 ------	UNKNOWN
124.1572  57.5832    0.7  41.9   -8.3   1.6648  17.0 ------	UNKNOWN
Post-slew image of 15-350 keV band
Time interval of the image:
81.692630 962.282000

# RAcent  DECcent POSerr Theta    Phi  PeakCts   SNR AngSep     Name
#  [deg]    [deg]    ['] [deg]  [deg]                   [']
 83.6276  21.9998    0.5  46.0 -169.4  33.0587  22.0    0.9	Crab
158.3838  37.9569    3.0  29.7   70.2   5.3876   3.8 ------	UNKNOWN
221.3842  48.5541    4.2  54.0    8.1   9.7055   2.8 ------	UNKNOWN
171.0412  58.9687    3.2  24.2   20.5   3.1511   3.7 ------	UNKNOWN
202.0549  60.3771    3.0  37.9    5.7   4.3563   3.9 ------	UNKNOWN
240.6515  52.3381    5.8  58.5   -6.3  13.7012   2.0 ------	UNKNOWN
241.8116  62.9519    3.7  50.3  -14.6   6.7704   3.1 ------	UNKNOWN
 68.2871  19.1633    4.1  55.8 -155.3   9.7763   2.9 ------	UNKNOWN
 55.2730  37.2277    2.8  48.3 -129.9  18.4054   4.1 ------	UNKNOWN