Analysis Summary
Notes:
- 1) No attempt has been made to eliminate the non-significant decimal places.
- 2) This batgrbproduct analysis is done using the HEASARC data.
- 3) This batgrbproduct analysis is using the flight position for the mask-weighting calculation.
======================================================================
BAT GRB EVENT DATA PROCESSING REPORT
Process Script Ver: batgrbproduct v2.48
Process Start Time: Fri Jul 29 23:56:49 EDT 2022
Host Name: batproc1
Current Working Dir: /local/data/bat1/alien/Swift_3rdBATcatalog/event/batevent_reproc/trigger1035922
======================================================================
Trigger: 01035922 Segment: 000
BAT Trigger Time: 636663811.072 [s; MET]
Trigger Stop: 636663812.096 [s; MET]
UTC: 2021-03-05T19:03:04.456060 [includes UTCF correction]
Where From?: TDRSS position message
BAT
RA: 319.813864066684 Dec: 34.5566320474194 [deg; J2000]
Catalogged Source?: NO
Point Source?: YES
GRB Indicated?: YES [ by BAT flight software ]
Image S/N Ratio: 14.41
Image Trigger?: NO
Rate S/N Ratio: 31.2089730686545 [ if not an image trigger ]
Image S/N Ratio: 14.41
Analysis Position: [ source = BAT ]
RA: 319.813864066684 Dec: 34.5566320474194 [deg; J2000]
Refined Position: [ source = BAT pre-slew burst ]
RA: 319.808912766838 Dec: 34.5474601345238 [deg; J2000]
{ 21h 19m 14.1s , +34d 32' 50.9" }
+/- 0.720726026706376 [arcmin] (estimated 90% radius based on SNR)
+/- 0.214695586493493 [arcmin] (formal 1-sigma fit error)
SNR: 48.5628091327148
Angular difference between the analysis and refined position is 0.602257 arcmin
Partial Coding Fraction: 0.7421875 [ including projection effects ]
Duration
T90: 67.5239999294281 +/- 4.21072200095712
Measured from: -14.0880000591278
to: 53.4359998703003 [s; relative to TRIGTIME]
T50: 26.0239999294281 +/- 1.3456299985659
Measured from: -0.440000057220459
to: 25.5839998722076 [s; relative to TRIGTIME]
Fluence
Peak Flux (peak 1 second)
Measured from: 0.259999990463257
to: 1.25999999046326 [s; relative to TRIGTIME]
Total Fluence
Measured from: -21.6480000019073
to: 69.8639999628067 [s; relative to TRIGTIME]
Band 1 Band 2 Band 3 Band 4
15-25 25-50 50-100 100-350 keV
Total 2.742541 4.273590 3.299034 0.728094
0.075910 0.080343 0.070764 0.056850 [error]
Peak 0.074547 0.149961 0.145696 0.044887
0.009320 0.010890 0.010392 0.007311 [error]
[ fluence units of on-axis counts / fully illuminated detector ]
======================================================================
====== Table of the duration information =============================
Value tstart tstop
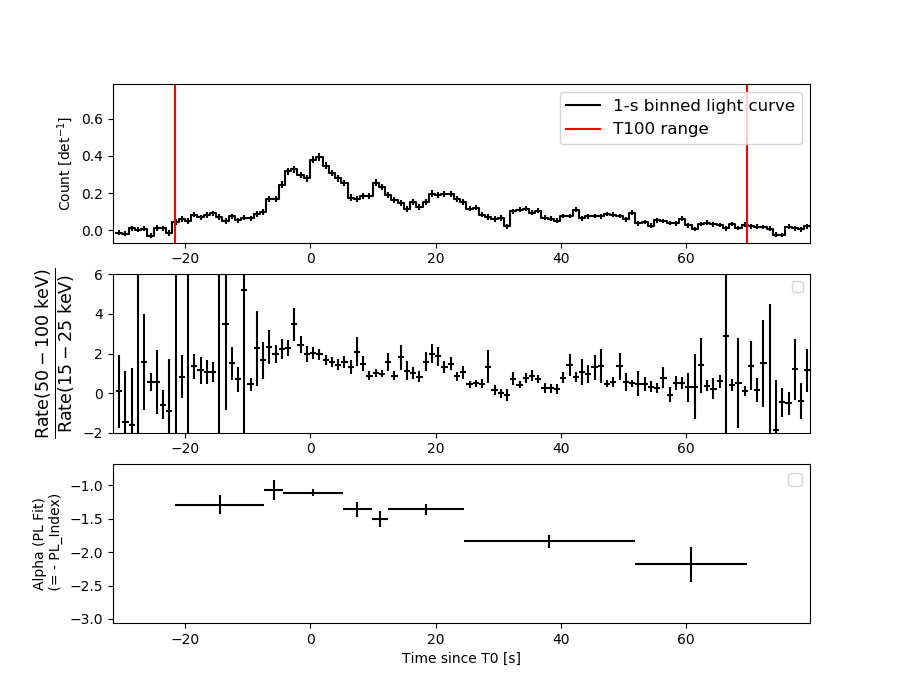
T100 91.512 -21.648 69.864
T90 67.524 -14.088 53.436
T50 26.024 -0.440 25.584
Peak 1.000 0.260 1.260
====== Spectral Analysis Summary =====================================
Model : spectral model: simple power-law (PL) and cutoff power-law (CPL)
Ph_index : photon index: E^{Ph_index}
Ph_90err : 90% error of the photon index
Epeak : Epeak in keV
Epeak_90err: 90% error of Epeak
Norm : normalization at 50 keV in both the PL model and CPL model
Nomr_90err : 90% error of the normalization
chi2 : Chi-Squared
dof : degree of freedo
=== Time-averaged spectral analysis ===
(Best model with acceptable fit: N/A)
Model Ph_index Ph_90err_low Ph_90err_hi Epeak Epeak_90err_low Epeak_90err_hi Norm Nomr_90err_low Norm_90err_hi chi2 dof
PL -1.473 -0.044 0.044 - - - 8.28e-03 -2.01e-04 2.01e-04 74.040 57
CPL -0.913 -0.188 0.197 105.273 -14.159 25.943 1.50e-02 -2.67e-03 3.40e-03 46.030 56
=== 1-s peak spectral analysis ===
(Best model with acceptable fit: N/A)
Model Ph_index Ph_90err_low Ph_90err_hi Epeak Epeak_90err_low Epeak_90err_hi Norm Nomr_90err_low Norm_90err_hi chi2 dof
PL -1.102 -0.124 0.125 - - - 2.89e-02 -2.16e-03 2.16e-03 48.700 57
CPL -0.742 -0.414 0.546 192.357 -84.872 -192.357 4.27e-02 -1.51e-02 3.31e-02 47.130 56
=== Fluence/Peak Flux Summary ===
Model Band1 Band2 Band3 Band4 Band5 Total
15-25 25-50 50-100 100-350 15-150 15-350 keV
Fluence PL 9.43e-07 1.76e-06 2.54e-06 7.76e-06 7.22e-06 1.30e-05 erg/cm2
90%_error_low -4.47e-08 -4.95e-08 -7.46e-08 -5.03e-07 -1.84e-07 -5.46e-07 erg/cm2
90%_error_hi 4.54e-08 4.93e-08 7.44e-08 5.26e-07 1.85e-07 5.64e-07 erg/cm2
Peak flux PL 8.14e-01 1.04e+00 9.67e-01 1.58e+00 3.35e+00 4.40e+00 ph/cm2/s
90%_error_low -1.15e-01 -9.34e-02 -8.08e-02 -2.60e-01 -2.57e-01 -3.51e-01 ph/cm2/s
90%_error_hi 1.20e-01 9.24e-02 8.02e-02 2.90e-01 2.57e-01 3.56e-01 ph/cm2/s
Fluence CPL 8.27e-07 1.82e-06 2.65e-06 3.90e-06 6.96e-06 9.20e-06 erg/cm2
90%_error_low -5.62e-08 -5.51e-08 -8.51e-08 -7.23e-07 -2.05e-07 -7.43e-07 erg/cm2
90%_error_hi 5.72e-08 5.54e-08 8.56e-08 9.26e-07 2.04e-07 9.33e-07 erg/cm2
Peak flux CPL 7.52e-01 1.07e+00 1.01e+00 1.09e+00 3.32e+00 3.92e+00 ph/cm2/s
90%_error_low -1.39e-01 -1.04e-01 -9.96e-02 -4.20e-01 -2.61e-01 -4.94e-01 ph/cm2/s
90%_error_hi 1.44e-01 1.06e-01 1.01e-01 5.93e-01 2.61e-01 6.82e-01 ph/cm2/s
======================================================================
Image
Pre-slew 15.0-350.0 keV image (Event data)
#   RAcent    DECcent   POSerr    Theta     Phi              Peak Cts       SNR   Name
  319.8089    34.5475   0.0040    25.0656  -128.0022         6.3443742     48.563 TRIG_01035922

Foreground time interval of the image:
-21.648  12.829 (delta_t =  34.477 [sec])
Background time interval of the image:
-239.072 -21.648 (delta_t = 217.424 [sec])
Light Curves
Note: The mask-weighted lightcurves have units of either count/det or counts/sec/det, where a det is 0.4 x 0.4 = 0.16 sq cm.
Full-time range; 1 s binning
Other quick-look light curves:
- 64 ms binning (zoomed)
- 16 ms binning (zoomed)
- 8 ms binning (zoomed)
- 2 ms binning (zoomed)
- SN=5 or 10 s binning (full-time range)
- Raw light curve
Spectra
- 64 ms binning (zoomed)
- 16 ms binning (zoomed)
- 8 ms binning (zoomed)
- 2 ms binning (zoomed)
- SN=5 or 10 s binning (full-time range)
- Raw light curve
Spectra
Notes:
- 1) The fitting includes the systematic errors.
- 2) When the burst includes telescope slew time periods, the fitting uses an average response file made from multiple 5-s response files through out the slew time plus single time preiod for the non-slew times, and weighted by the total counts in the corresponding time period using addrmf. An average response file is needed becuase a spectral fit using the pre-slew DRM will introduce some errors in both a spectral shape and a normalization if the PHA file contains a lot of the slew/post-slew time interval.
- 3) For fits to more complicated models (e.g. a power-law over a cutoff power-law), the BAT team has decided to require a chi-square improvement of more than 6 for each extra dof.
Time averaged spectrum fit using the average DRM
Power-law model
Time interval is from  -21.648 sec. to   69.864 sec.

Spectral model in power-law:
------------------------------------------------------------
Parameters  : value       lower 90%   higher 90%
Photon index: -1.47306     ( -0.0442169   0.0442559 )
Norm@50keV  : 8.27817E-03    ( -0.000200673   0.000200672 )
------------------------------------------------------------
#Fit statistic  : Chi-Squared                   74.04     using 59 bins.
 Reduced chi-squared = 1.29895
# Null hypothesis probability of 6.41e-02 with 57 degrees of freedom

Photon flux (15-150 keV)    in 91.51 sec: 1.02616 ( -0.027324  0.02739 ) ph/cm2/s
Energy fluence (15-150 keV)             : 7.22002e-06 ( -1.84138e-07  1.84528e-07 ) ergs/cm2
Cutoff power-law model
Time interval is from  -21.648 sec. to   69.864 sec.
Spectral model in the cutoff power-law:
------------------------------------------------------------
Parameters  : value       lower 90%   higher 90%
Photon index: -0.912555     ( -0.188372   0.196832 )
Epeak [keV] : 105.273      ( -14.1585 25.9435 )
Norm@50keV  : 1.50374E-02    ( -0.00266651   0.00340184 )
------------------------------------------------------------
#Fit statistic  : Chi-Squared                   46.03     using 59 bins.
 Reduced chi-squared = 0.821964
# Null hypothesis probability of 8.27e-01 with 56 degrees of freedom

Photon flux (15-150 keV)    in 91.51 sec: 0.987958 ( -0.029675  0.029772 ) ph/cm2/s
Energy fluence (15-150 keV)             : 6.95759e-06 ( -2.0456e-07  2.04317e-07 ) ergs/cm2
1-s peak spectrum fit
Power-law model
Time interval is from    0.260 sec. to    1.260 sec.

Spectral model in power-law:
------------------------------------------------------------
Parameters  : value       lower 90%   higher 90%
Photon index: -1.10202     ( -0.12377   0.125491 )
Norm@50keV  : 2.89143E-02    ( -0.00216399   0.00216222 )
------------------------------------------------------------
#Fit statistic  : Chi-Squared                   48.70     using 59 bins.
 Reduced chi-squared = 0.854386
# Null hypothesis probability of 7.75e-01 with 57 degrees of freedom

Photon flux (15-150 keV)    in 1 sec: 3.35453 ( -0.25714  0.25738 ) ph/cm2/s
Energy fluence (15-150 keV)             : 3.02141e-07 ( -2.46557e-08  2.47779e-08 ) ergs/cm2
Cutoff power-law model
Time interval is from    0.260 sec. to    1.260 sec.
Spectral model in the cutoff power-law:
------------------------------------------------------------
Parameters  : value       lower 90%   higher 90%
Photon index: -0.741878     ( -0.413886   0.545989 )
Epeak [keV] : 192.357      ( -84.8734 -192.358 )
Norm@50keV  : 4.27385E-02    ( -0.015096   0.0330887 )
------------------------------------------------------------
#Fit statistic  : Chi-Squared                   47.13     using 59 bins.
 Reduced chi-squared = 0.841607
# Null hypothesis probability of 7.95e-01 with 56 degrees of freedom

Photon flux (15-150 keV)    in 1 sec: 3.32156 ( -0.26134  0.26134 ) ph/cm2/s
Energy fluence (15-150 keV)             : 2.97208e-07 ( -2.62076e-08  2.59166e-08 ) ergs/cm2
Time-resolved spectra
Distribution
T90 vs. Hardness ratio plot
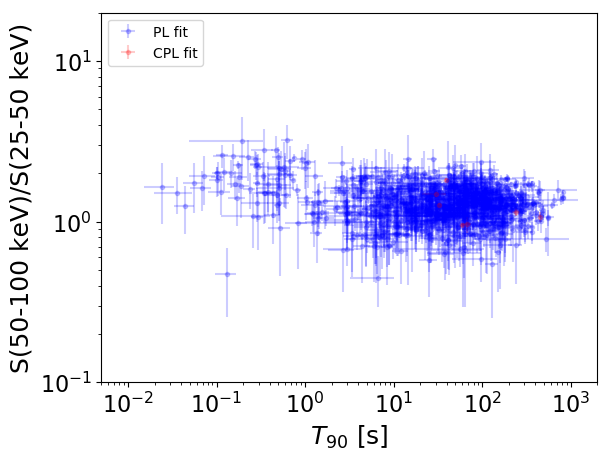
T90                                   = N/A sec.
Hardness ratio (energy fluence ratio) = N/A
S(15-50 keV) vs. S(50-150 keV) plot
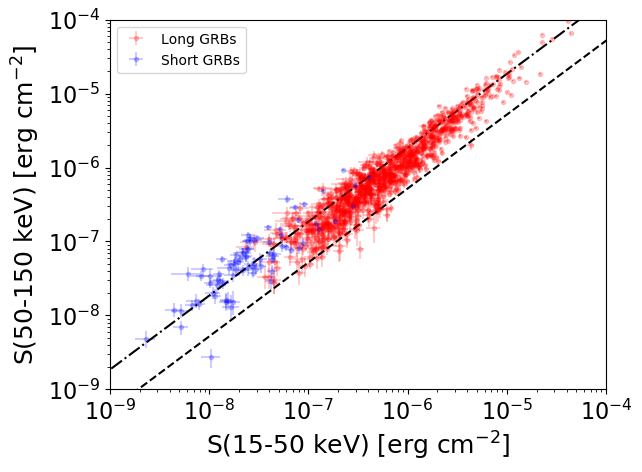
S(15-50 keV)  = N/A
S(50-150 keV) = N/A
The dash-dotted line and the dashed line traces the fluences calculated from the Band function with Epeak = 15 and 150 keV, respectively. Both lines assume a canonical values of alpha = -1 and beta = -2.5.
Mask shadow pattern
IMX = -2.879613186281215E-01, IMY = 3.685438577558459E-01
Spacecraft aspect plot
Bright source in the pre-burst/pre-slew/post-slew images
Pre-burst image of 15-350 keV band
Time interval of the image:
-239.072000 -21.648000

# RAcent  DECcent POSerr Theta    Phi  PeakCts   SNR AngSep     Name
#  [deg]    [deg]    ['] [deg]  [deg]                   [']
254.4625  35.4708   10.6  31.9   96.2  -0.4631  -1.1    7.7	Her X-1
268.3547  -1.4599    6.5  37.0   24.0   0.7642   1.8    0.9	SW J1753.5-0127
270.3993 -24.9709   26.9  56.9    6.3   0.8075   0.4    9.0	GX 5-1
274.0242 -14.0221    6.9  45.5    7.5   0.7639   1.7    1.4	GX 17+2
285.0432 -24.9195   17.3  53.5   -9.3   0.4622   0.7    0.4	HT1900.1-2455
288.7489  10.9623   12.5  17.5   -8.1  -0.2368  -0.9    3.1	GRS 1915+105
299.6504  35.1979    2.0   9.9 -152.6   1.4300   5.7    3.0	Cyg X-1
308.0548  40.9586    2.1  18.7 -153.4   1.3621   5.4    2.5	Cyg X-3
326.1915  38.4748    5.5  30.7 -134.8   0.7660   2.1    9.2	Cyg X-2
263.8811   5.0005    3.0  34.9   36.9   1.6935   3.9 ------	UNKNOWN
285.1580 -23.9631    3.0  52.6   -9.3   2.4093   3.9 ------	UNKNOWN
  3.6211  67.4848    2.5  57.3 -170.6   5.1924   4.6 ------	UNKNOWN
330.2608  49.3133    3.0  36.3 -152.5   1.3233   3.9 ------	UNKNOWN
Pre-slew background subtracted image of 15-350 keV band
Time interval of the image:
-21.648000 12.828590

# RAcent  DECcent POSerr Theta    Phi  PeakCts   SNR AngSep     Name
#  [deg]    [deg]    ['] [deg]  [deg]                   [']
254.6322  35.4807   60.3  31.7   96.2   0.0415   0.2   11.9	Her X-1
268.4541  -1.3947    5.4  36.9   23.9  -0.3865  -2.1    6.2	SW J1753.5-0127
270.3694 -25.1168  144.2  57.1    6.3   0.0501   0.1    5.2	GX 5-1
273.9014 -14.0018    6.0  45.5    7.6  -0.4210  -1.9    6.4	GX 17+2
284.8840 -25.0171    4.3  53.7   -9.1  -0.8250  -2.7   10.1	HT1900.1-2455
288.8535  10.9805   11.1  17.4   -8.4   0.1081   1.0    3.9	GRS 1915+105
299.5702  35.0477    4.1   9.8 -152.1   0.2989   2.8    9.3	Cyg X-1
307.9915  40.8318   10.9  18.6 -153.2   0.1145   1.1    9.0	Cyg X-3
325.9390  38.2927    0.0  30.5 -134.6  -0.1159  -0.8   11.1	Cyg X-2
246.7400  63.4135    3.4  45.2  137.4   1.6227   3.4 ------	UNKNOWN
319.8089  34.5475    0.2  25.1 -128.0   6.3438  48.6 ------	UNKNOWN
352.1631  40.0258    3.0  50.8 -136.5   1.9210   3.8 ------	UNKNOWN
Post-slew image of 15-350 keV band
Time interval of the image:
65.428600 962.982600

# RAcent  DECcent POSerr Theta    Phi  PeakCts   SNR AngSep     Name
#  [deg]    [deg]    ['] [deg]  [deg]                   [']
288.7042  10.8817   23.2  36.9    5.2  -0.5325  -0.5    6.7	GRS 1915+105
299.5781  35.1948    2.0  16.5   45.6   5.1238   5.7    0.7	Cyg X-1
308.2107  40.9406    1.6  11.1   75.9   5.8217   7.3    4.6	Cyg X-3
326.2370  38.2947    4.6   6.4 -179.8   1.7998   2.5    3.5	Cyg X-2
310.7873  57.3185    4.0  23.5  115.4   3.3310   2.9 ------	UNKNOWN
338.0413  16.1963    2.8  24.6  -98.6   4.5305   4.0 ------	UNKNOWN
 32.2298  31.1611    5.7  59.6 -161.3  19.7812   2.0 ------	UNKNOWN