Analysis Summary
Notes:
- 1) No attempt has been made to eliminate the non-significant decimal places.
- 2) This batgrbproduct analysis is done using the HEASARC data.
- 3) This batgrbproduct analysis is using the flight position for the mask-weighting calculation.
======================================================================
                  BAT GRB EVENT DATA PROCESSING REPORT
    Process Script Ver: batgrbproduct v2.48
    Process Start Time: Fri Jul 29 23:54:45 EDT 2022
             Host Name: batproc1
   Current Working Dir: /local/data/bat1/alien/Swift_3rdBATcatalog/event/batevent_reproc/trigger1035994
======================================================================

  Trigger: 01035994      Segment: 000

  BAT Trigger Time: 636695663.86   [s; MET]
      Trigger Stop: 636695663.924   [s; MET]
               UTC: 2021-03-06T03:53:57.241940    [includes UTCF correction]
       Where From?: (*SHORT BURST*) TDRSS scaled map message

  BAT
    RA: 129.964614535563   Dec: 60.1962629275143  [deg; J2000]

     Catalogged Source?: NO
     Point Source?:      YES
     GRB Indicated?:     YES    [ by BAT flight software ]
     Image S/N Ratio:    14.16
     Image Trigger?:     NO
     Rate S/N Ratio:     75.3724087448451  [ if not an image trigger ]
     Image S/N Ratio:    14.16

  Analysis Position:   [ source = BAT ]
    RA: 129.964614535563   Dec: 60.1962629275143  [deg; J2000]

  Refined Position:   [ source = BAT pre-slew burst ]
    RA: 129.963583377986   Dec: 60.2031218763747  [deg; J2000]
        { 08h 39m 51.3s , +60d 12' 11.2" }
         +/- 0.643835368776782 [arcmin] (estimated 90% radius based on SNR)
         +/- 0.159967813856316 [arcmin] (formal 1-sigma fit error)
    SNR: 57.0554576412565

  Angular difference between the analysis and refined position is 0.412684 arcmin

  Partial Coding Fraction: 0.53125    [ including projection effects ]

  Duration
     T90: 637.31199991703 +/- 34.8535198802136
        Measured from: 0.603999972343445
                   to: 637.915999889374     [s; relative to TRIGTIME]
     T50: 410.84399998188 +/- 26.7512346445431
        Measured from: 5.38800001144409
                   to: 416.231999993324     [s; relative to TRIGTIME]


  Fluence
     Peak Flux  (peak 1 second)
        Measured from: 7.50399994850159
                   to: 8.50399994850159     [s; relative to TRIGTIME]
     Total Fluence
        Measured from: -0.175999999046326
                   to: 734.988000035286     [s; relative to TRIGTIME]

             Band 1     Band 2     Band 3     Band 4
              15-25      25-50     50-100    100-350     keV
 Total     2.626765   3.838627   1.990579   0.188257
           0.188074   0.196775   0.174048   0.162932 [error]
 Peak      0.633418   0.957753   0.625068   0.070199
           0.020855   0.024734   0.020624   0.011217 [error]

     [ fluence units of on-axis counts / fully illuminated detector ]

======================================================================


====== Table of the duration information =============================

        Value   tstart    tstop
T100  735.164   -0.176  734.988
T90   637.312    0.604  637.916
T50   410.844    5.388  416.232
Peak    1.000    7.504    8.504


====== Spectral Analysis Summary =====================================

Model      : spectral model: simple power-law (PL) and cutoff power-law (CPL)
Ph_index   : photon index: E^{Ph_index}
Ph_90err   : 90% error of the photon index
Epeak      : Epeak in keV
Epeak_90err: 90% error of Epeak
Norm       : normalization at 50 keV in both the PL model and CPL model
Nomr_90err : 90% error of the normalization
chi2       : Chi-Squared
dof        : degree of freedo

=== Time-averaged spectral analysis ===
(Best model with acceptable fit: N/A)

Model Ph_index Ph_90err_low Ph_90err_hi  Epeak  Epeak_90err_low  Epeak_90err_hi  Norm       Nomr_90err_low    Norm_90err_hi    chi2    dof
PL      -1.738    -0.114      0.112       -           -               -         8.03e-04     -5.74e-05          5.70e-05      54.890   57
CPL     -0.600    -0.557      0.646       54.788      -7.030        13.354      3.37e-03     -1.68e-03          4.23e-03      41.020   56


=== 1-s peak spectral analysis ===
(Best model with acceptable fit: N/A)

Model Ph_index Ph_90err_low Ph_90err_hi  Epeak  Epeak_90err_low  Epeak_90err_hi  Norm       Nomr_90err_low    Norm_90err_hi    chi2    dof
PL      -1.746     -0.054     0.054       -           -               -         1.54e-01     -5.20e-03          5.19e-03     103.990   57
CPL     -0.619     -0.263     0.278       62.810      -4.111         5.330      5.53e-01     -1.40e-01          2.00e-01      40.130   56


=== Fluence/Peak Flux Summary ===

              Model    Band1     Band2     Band3     Band4     Band5     Total
                       15-25     25-50    50-100    100-350    15-150    15-350    keV
Fluence         PL   9.43e-07  1.50e-06  1.80e-06  4.21e-06  5.45e-06  8.45e-06   erg/cm2
      90%_error_low -9.31e-08 -9.76e-08 -1.71e-07 -7.64e-07 -4.04e-07 -9.38e-07   erg/cm2
      90%_error_hi   9.54e-08  9.76e-08  1.72e-07  8.70e-07  4.08e-07  1.02e-06   erg/cm2
Peak flux       PL   8.02e+00  6.98e+00  4.16e+00  3.74e+00  2.08e+01  2.29e+01   ph/cm2/s
      90%_error_low -4.43e-01 -2.47e-01 -1.72e-01 -2.95e-01 -7.31e-01 -7.58e-01   ph/cm2/s
      90%_error_hi   4.51e-01  2.47e-01  1.71e-01  3.09e-01  7.32e-01  7.58e-01   ph/cm2/s

Fluence        CPL   8.22e-07  1.69e-06  1.78e-06  8.99e-07  4.91e-06  5.19e-06   erg/cm2
      90%_error_low -1.10e-07 -1.35e-07 -2.09e-07 -4.39e-07 -4.52e-07 -6.25e-07   erg/cm2
      90%_error_hi   1.11e-07  1.38e-07  2.02e-07  8.49e-07  4.69e-07  9.36e-07   erg/cm2
Peak flux      CPL   6.39e+00  7.62e+00  4.60e+00  1.49e+00  1.97e+01  2.01e+01   ph/cm2/s
      90%_error_low -5.37e-01 -2.96e-01 -2.09e-01 -2.72e-01 -7.59e-01 -8.22e-01   ph/cm2/s
      90%_error_hi   5.49e-01  2.99e-01  2.11e-01  3.25e-01  7.62e-01  8.36e-01   ph/cm2/s

======================================================================
Image
Pre-slew 15.0-350.0 keV image (Event data)
#   RAcent    DECcent   POSerr    Theta     Phi              Peak Cts       SNR   Name
  129.9636    60.2031   0.0033    31.5573  -124.3267         9.6656736     57.055 TRIG_01035994

Foreground time interval of the image:
 -0.176   9.241 (delta_t =   9.417 [sec])
Background time interval of the image:
-239.860  -0.176 (delta_t = 239.684 [sec])
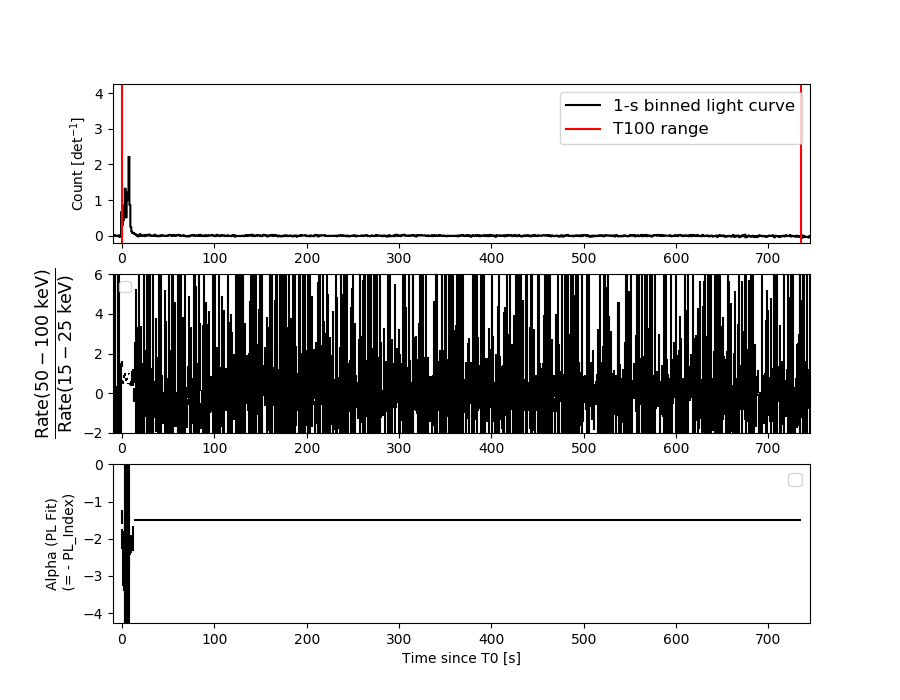
Light Curves
Note: The mask-weighted lightcurves have units of either count/det or counts/sec/det, where a det is 0.4 x 0.4 = 0.16 sq cm.
Full-time range; 1 s binning
Other quick-look light curves:
- 64 ms binning (zoomed)
- 16 ms binning (zoomed)
- 8 ms binning (zoomed)
- 2 ms binning (zoomed)
- SN=5 or 10 s binning (full-time range)
- Raw light curve
Spectra
- 64 ms binning (zoomed)
- 16 ms binning (zoomed)
- 8 ms binning (zoomed)
- 2 ms binning (zoomed)
- SN=5 or 10 s binning (full-time range)
- Raw light curve
Spectra
Notes:
- 1) The fitting includes the systematic errors.
- 2) When the burst includes telescope slew time periods, the fitting uses an average response file made from multiple 5-s response files through out the slew time plus single time preiod for the non-slew times, and weighted by the total counts in the corresponding time period using addrmf. An average response file is needed becuase a spectral fit using the pre-slew DRM will introduce some errors in both a spectral shape and a normalization if the PHA file contains a lot of the slew/post-slew time interval.
- 3) For fits to more complicated models (e.g. a power-law over a cutoff power-law), the BAT team has decided to require a chi-square improvement of more than 6 for each extra dof.
Time averaged spectrum fit using the average DRM
Power-law model
Time interval is from   -0.176 sec. to  734.988 sec.

Spectral model in power-law:
------------------------------------------------------------
Parameters  : value       lower 90%   higher 90%
Photon index: -1.73758     ( -0.114076   0.112066 )
Norm@50keV  : 8.02962E-04    ( -5.74465e-05   5.70016e-05 )
------------------------------------------------------------
#Fit statistic  : Chi-Squared                   54.89     using 59 bins.
 Reduced chi-squared = 0.962982
# Null hypothesis probability of 5.55e-01 with 57 degrees of freedom

Photon flux (15-150 keV)    in 735.2 sec: 0.108086 ( -0.007088  0.007093 ) ph/cm2/s
Energy fluence (15-150 keV)             : 5.45212e-06 ( -4.03698e-07  4.07853e-07 ) ergs/cm2
Cutoff power-law model
Time interval is from   -0.176 sec. to  734.988 sec.
Spectral model in the cutoff power-law:
------------------------------------------------------------
Parameters  : value       lower 90%   higher 90%
Photon index: -0.599724     ( -0.557756   0.646098 )
Epeak [keV] : 54.7878      ( -7.02534 13.3586 )
Norm@50keV  : 3.37101E-03    ( -0.00168533   0.00422465 )
------------------------------------------------------------
#Fit statistic  : Chi-Squared                   41.02     using 59 bins.
 Reduced chi-squared = 0.7325
# Null hypothesis probability of 9.33e-01 with 56 degrees of freedom

Photon flux (15-150 keV)    in 735.2 sec: 0.102885 ( -0.0074727  0.007486 ) ph/cm2/s
Energy fluence (15-150 keV)             : 4.90677e-06 ( -4.51791e-07  4.68814e-07 ) ergs/cm2
1-s peak spectrum fit
Power-law model
Time interval is from    7.504 sec. to    8.504 sec.

Spectral model in power-law:
------------------------------------------------------------
Parameters  : value       lower 90%   higher 90%
Photon index: -1.74586     ( -0.05449   0.0540926 )
Norm@50keV  : 0.153877    ( -0.00519827   0.00519157 )
------------------------------------------------------------
#Fit statistic  : Chi-Squared                  103.99     using 59 bins.
 Reduced chi-squared = 1.82439
# Null hypothesis probability of 1.44e-04 with 57 degrees of freedom

Photon flux (15-150 keV)    in 1 sec: 20.7762 ( -0.731  0.7321 ) ph/cm2/s
Energy fluence (15-150 keV)             : 1.42043e-06 ( -4.91062e-08  4.91729e-08 ) ergs/cm2
Cutoff power-law model
Time interval is from    7.504 sec. to    8.504 sec.
Spectral model in the cutoff power-law:
------------------------------------------------------------
Parameters  : value       lower 90%   higher 90%
Photon index: -0.618669     ( -0.262511   0.278142 )
Epeak [keV] : 62.8104      ( -4.11045 5.33028 )
Norm@50keV  : 0.552749    ( -0.139608   0.200295 )
------------------------------------------------------------
#Fit statistic  : Chi-Squared                   40.13     using 59 bins.
 Reduced chi-squared = 0.716607
# Null hypothesis probability of 9.46e-01 with 56 degrees of freedom

Photon flux (15-150 keV)    in 1 sec: 19.6990 ( -0.7592  0.7616 ) ph/cm2/s
Energy fluence (15-150 keV)             : 1.3489e-06 ( -5.19895e-08  5.20415e-08 ) ergs/cm2
Time-resolved spectra
Distribution
T90 vs. Hardness ratio plot
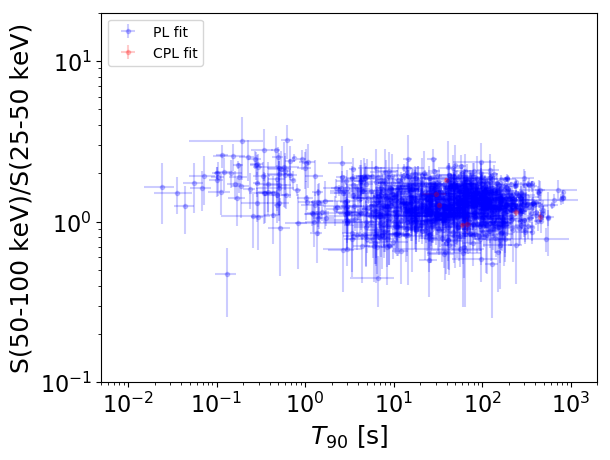
T90                                   = N/A sec.
Hardness ratio (energy fluence ratio) = N/A
S(15-50 keV) vs. S(50-150 keV) plot
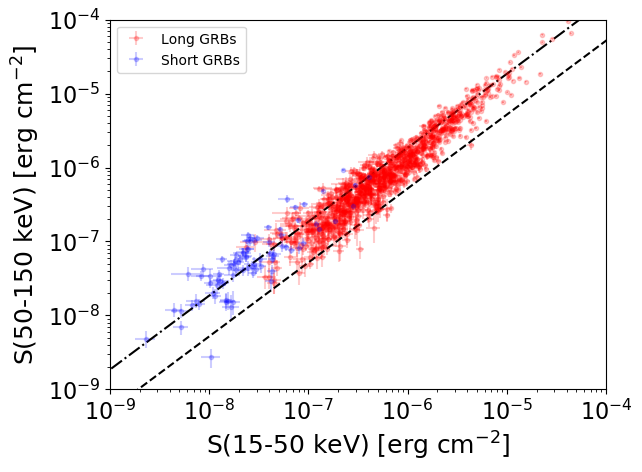
S(15-50 keV)  = N/A
S(50-150 keV) = N/A
The dash-dotted line and the dashed line traces the fluences calculated from the Band function with Epeak = 15 and 150 keV, respectively. Both lines assume a canonical values of alpha = -1 and beta = -2.5.
Mask shadow pattern
IMX = -3.463410182310839E-01, IMY = 5.072082088400764E-01
Spacecraft aspect plot
Bright source in the pre-burst/pre-slew/post-slew images
Pre-burst image of 15-350 keV band
Time interval of the image:
-239.860000 -0.176000

# RAcent  DECcent POSerr Theta    Phi  PeakCts   SNR AngSep     Name
#  [deg]    [deg]    ['] [deg]  [deg]                   [']
177.6967  -0.0155    2.6  39.7   71.4   4.2635   4.4 ------	UNKNOWN
208.9944  22.4756    3.1  39.8   10.4   1.6659   3.7 ------	UNKNOWN
228.9031  33.1161    3.0  50.3  -14.8   2.6967   3.9 ------	UNKNOWN
 92.7945  38.4551    3.2  55.8 -155.3   4.8507   3.6 ------	UNKNOWN
Pre-slew background subtracted image of 15-350 keV band
Time interval of the image:
-0.176000 9.240590

# RAcent  DECcent POSerr Theta    Phi  PeakCts   SNR AngSep     Name
#  [deg]    [deg]    ['] [deg]  [deg]                   [']
156.8273  20.3095    2.5  19.6  116.5   0.4663   4.5 ------	UNKNOWN
232.9648  22.2109    2.8  58.7   -5.1   2.3476   4.2 ------	UNKNOWN
129.9636  60.2031    0.2  31.6 -124.3   9.6655  57.1 ------	UNKNOWN
100.8076  48.0610    3.0  47.2 -146.1   0.9594   3.8 ------	UNKNOWN
Post-slew image of 15-350 keV band
Time interval of the image:
64.040610 902.210000

# RAcent  DECcent POSerr Theta    Phi  PeakCts   SNR AngSep     Name
#  [deg]    [deg]    ['] [deg]  [deg]                   [']
 83.6099  21.9841    4.2  50.0 -165.6  22.6805   2.7    2.2	Crab
191.3472  34.5439    3.8  46.5   48.0  39.2271   3.1 ------	UNKNOWN
 79.7732  15.3055    2.8  57.6 -165.4  55.4716   4.2 ------	UNKNOWN