Analysis Summary
Notes:
- 1) No attempt has been made to eliminate the non-significant decimal places.
- 2) This batgrbproduct analysis is done using the HEASARC data.
- 3) This batgrbproduct analysis is using the flight position for the mask-weighting calculation.
======================================================================
                  BAT GRB EVENT DATA PROCESSING REPORT
    Process Script Ver: batgrbproduct v2.48
    Process Start Time: Fri Jul 29 23:53:16 EDT 2022
             Host Name: batproc1
   Current Working Dir: /local/data/bat1/alien/Swift_3rdBATcatalog/event/batevent_reproc/trigger1036024
======================================================================

  Trigger: 01036024      Segment: 000

  BAT Trigger Time: 636715960.896   [s; MET]
      Trigger Stop: 636715962.944   [s; MET]
               UTC: 2021-03-06T09:32:14.276600    [includes UTCF correction]
       Where From?: TDRSS position message

  BAT
    RA: 331.84758020164   Dec: 10.1749633736152  [deg; J2000]

     Catalogged Source?: NO
     Point Source?:      YES
     GRB Indicated?:     YES    [ by BAT flight software ]
     Image S/N Ratio:    8.4
     Image Trigger?:     NO
     Rate S/N Ratio:     10.0498756211209  [ if not an image trigger ]
     Image S/N Ratio:    8.4

  Analysis Position:   [ source = BAT ]
    RA: 331.84758020164   Dec: 10.1749633736152  [deg; J2000]

  Refined Position:   [ source = BAT pre-slew burst ]
    RA: 331.809051374035   Dec: 10.1520465794124  [deg; J2000]
        { 22h 07m 14.2s , +10d 09' 07.4" }
         +/- 1.89082910189363 [arcmin] (estimated 90% radius based on SNR)
         +/- 0.98101877455982 [arcmin] (formal 1-sigma fit error)
    SNR: 12.2433662169862

  Angular difference between the analysis and refined position is 2.658635 arcmin

  Partial Coding Fraction: 0.2148438    [ including projection effects ]

  Duration
     T90: 23.8400000333786 +/- 2.22681838349418
        Measured from: -1.7039999961853
                   to: 22.1360000371933     [s; relative to TRIGTIME]
     T50: 15.2319999933243 +/- 3.66326635323667
        Measured from: 1.12800002098083
                   to: 16.3600000143051     [s; relative to TRIGTIME]


  Fluence
     Peak Flux  (peak 1 second)
        Measured from: 1.03600001335144
                   to: 2.03600001335144     [s; relative to TRIGTIME]
     Total Fluence
        Measured from: -2.42400002479553
                   to: 23.5119999647141     [s; relative to TRIGTIME]

             Band 1     Band 2     Band 3     Band 4
              15-25      25-50     50-100    100-350     keV
 Total     0.572431   0.921102   0.622108   0.278179
           0.086842   0.092101   0.088009   0.096665 [error]
 Peak      0.027474   0.128750   0.111443   0.050477
           0.018420   0.020141   0.019654   0.019809 [error]

     [ fluence units of on-axis counts / fully illuminated detector ]

======================================================================


====== Table of the duration information =============================

        Value   tstart    tstop
T100   25.936   -2.424   23.512
T90    23.840   -1.704   22.136
T50    15.232    1.128   16.360
Peak    1.000    1.036    2.036


====== Spectral Analysis Summary =====================================

Model      : spectral model: simple power-law (PL) and cutoff power-law (CPL)
Ph_index   : photon index: E^{Ph_index}
Ph_90err   : 90% error of the photon index
Epeak      : Epeak in keV
Epeak_90err: 90% error of Epeak
Norm       : normalization at 50 keV in both the PL model and CPL model
Nomr_90err : 90% error of the normalization
chi2       : Chi-Squared
dof        : degree of freedo

=== Time-averaged spectral analysis ===
(Best model with acceptable fit: N/A)

Model Ph_index Ph_90err_low Ph_90err_hi  Epeak  Epeak_90err_low  Epeak_90err_hi  Norm       Nomr_90err_low    Norm_90err_hi    chi2    dof
PL      -1.375    -0.206      0.207       -           -               -         6.53e-03     -7.51e-04          7.48e-04      67.450   57
CPL     -1.378    -0.201      0.214     9999.330    -9999.330      -9999.330      6.53e-03     -6.53e-03          9.22e-03      67.460   56


=== 1-s peak spectral analysis ===
(Best model with acceptable fit: N/A)

Model Ph_index Ph_90err_low Ph_90err_hi  Epeak  Epeak_90err_low  Epeak_90err_hi  Norm       Nomr_90err_low    Norm_90err_hi    chi2    dof
PL      -0.712     -0.327     0.389       -           -               -         2.11e-02     -4.54e-03          4.28e-03      54.010   57
CPL     -0.644     -0.400     0.885      994.484    -994.484      -994.484      2.30e-02     -6.23e-03          -2.30e-02      54.180   56


=== Fluence/Peak Flux Summary ===

              Model    Band1     Band2     Band3     Band4     Band5     Total
                       15-25     25-50    50-100    100-350    15-150    15-350    keV
Fluence         PL   1.92e-07  3.81e-07  5.88e-07  1.99e-06  1.64e-06  3.15e-06   erg/cm2
      90%_error_low -3.81e-08 -4.64e-08 -8.83e-08 -5.83e-07 -2.13e-07 -6.57e-07   erg/cm2
      90%_error_hi   4.00e-08  4.58e-08  8.76e-08  7.38e-07  2.16e-07  7.88e-07   erg/cm2
Peak flux       PL   4.11e-01  6.63e-01  8.10e-01  1.94e+00  2.44e+00  3.83e+00   ph/cm2/s
      90%_error_low -1.77e-01 -1.93e-01 -1.44e-01 -6.72e-01 -4.73e-01 -7.50e-01   ph/cm2/s
      90%_error_hi   2.07e-01  1.86e-01  1.44e-01  9.63e-01  4.77e-01  8.47e-01   ph/cm2/s

Fluence        CPL   1.93e-07  3.80e-07  5.88e-07  2.05e-06  1.65e-06  3.16e-06   erg/cm2
      90%_error_low    N/A    -4.59e-08    N/A       N/A    -2.41e-07 -1.40e-06   erg/cm2
      90%_error_hi     N/A     5.52e-08    N/A       N/A     2.16e-07  3.66e-07   erg/cm2
Peak flux      CPL   4.32e-01  6.69e-01  7.99e-01  1.93e+00  2.43e+00  3.80e+00   ph/cm2/s
      90%_error_low     N/A   -1.46e-01 -1.41e-01 -1.23e+00 -4.57e-01 -1.23e+00   ph/cm2/s
      90%_error_hi      N/A    1.82e-01  1.78e-01  9.45e-01  4.86e-01  7.63e-01   ph/cm2/s

======================================================================
Image
Pre-slew 15.0-350.0 keV image (Event data)
#   RAcent    DECcent   POSerr    Theta     Phi              Peak Cts       SNR   Name
  331.8091    10.1520   0.0158    37.8036   -72.6200         2.5436999     12.243 TRIG_01036024

Foreground time interval of the image:
 -2.424  23.512 (delta_t =  25.936 [sec])
Background time interval of the image:
-93.995  -2.424 (delta_t =  91.571 [sec])
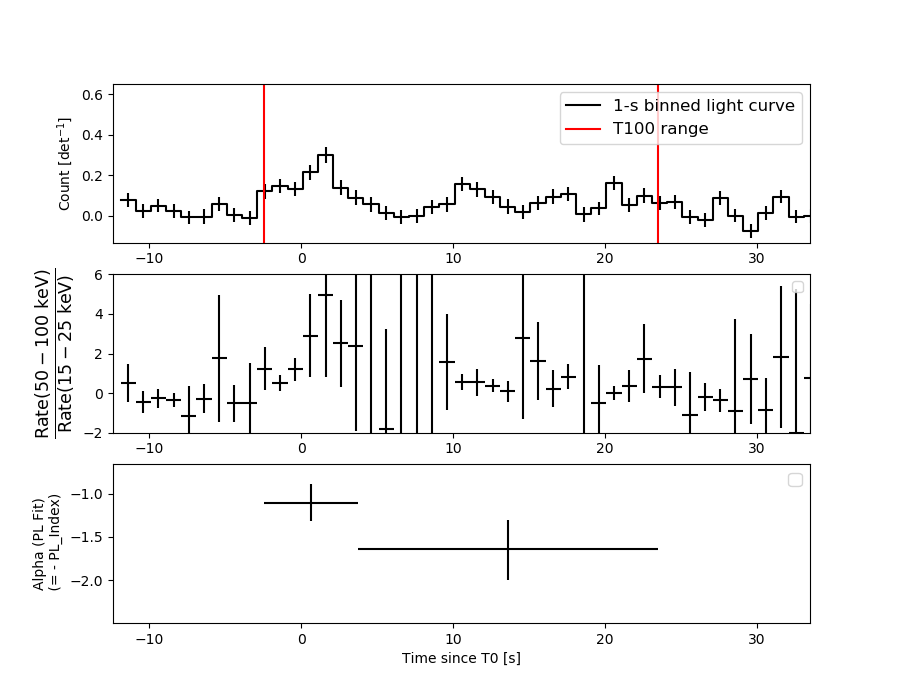
Light Curves
Note: The mask-weighted lightcurves have units of either count/det or counts/sec/det, where a det is 0.4 x 0.4 = 0.16 sq cm.
Full-time range; 1 s binning
Other quick-look light curves:
- 64 ms binning (zoomed)
- 16 ms binning (zoomed)
- 8 ms binning (zoomed)
- 2 ms binning (zoomed)
- SN=5 or 10 s binning (full-time range)
- Raw light curve
Spectra
- 64 ms binning (zoomed)
- 16 ms binning (zoomed)
- 8 ms binning (zoomed)
- 2 ms binning (zoomed)
- SN=5 or 10 s binning (full-time range)
- Raw light curve
Spectra
Notes:
- 1) The fitting includes the systematic errors.
- 2) When the burst includes telescope slew time periods, the fitting uses an average response file made from multiple 5-s response files through out the slew time plus single time preiod for the non-slew times, and weighted by the total counts in the corresponding time period using addrmf. An average response file is needed becuase a spectral fit using the pre-slew DRM will introduce some errors in both a spectral shape and a normalization if the PHA file contains a lot of the slew/post-slew time interval.
- 3) For fits to more complicated models (e.g. a power-law over a cutoff power-law), the BAT team has decided to require a chi-square improvement of more than 6 for each extra dof.
Time averaged spectrum fit using the average DRM
Power-law model

Time interval is from   -2.424 sec. to   23.512 sec.

Spectral model in power-law:
------------------------------------------------------------
Parameters  : value       lower 90%   higher 90%
Photon index: -1.3752     ( -0.206266   0.206614 )
Norm@50keV  : 6.52671E-03    ( -0.000751343   0.000747782 )
------------------------------------------------------------
#Fit statistic  : Chi-Squared                   67.45     using 59 bins.
 Reduced chi-squared = 1.18333
# Null hypothesis probability of 1.62e-01 with 57 degrees of freedom

Photon flux (15-150 keV)    in 25.94 sec: 0.790486 ( -0.090611  0.090775 ) ph/cm2/s
Energy fluence (15-150 keV)             : 1.64464e-06 ( -2.13307e-07  2.16249e-07 ) ergs/cm2
Cutoff power-law model
Time interval is from   -2.424 sec. to   23.512 sec.
Spectral model in the cutoff power-law:
------------------------------------------------------------
Parameters  : value       lower 90%   higher 90%
Photon index: -1.37828     ( -0.203535   0.212003 )
Epeak [keV] : 9999.33      ( -9999.36 -9999.36 )
Norm@50keV  : 6.53075E-03    ( -0.00654362   0.00920373 )
------------------------------------------------------------
#Fit statistic  : Chi-Squared                   67.46     using 59 bins.
 Reduced chi-squared = 1.20464
# Null hypothesis probability of 1.40e-01 with 56 degrees of freedom

Photon flux (15-150 keV)    in 25.94 sec: 0.792019 ( -0.09522  0.09127 ) ph/cm2/s
Energy fluence (15-150 keV)             : 1.64919e-06 ( -2.41131e-07  2.16161e-07 ) ergs/cm2
1-s peak spectrum fit
Power-law model
Time interval is from    1.036 sec. to    2.036 sec.

Spectral model in power-law:
------------------------------------------------------------
Parameters  : value       lower 90%   higher 90%
Photon index: -0.712104     ( -0.327468   0.389043 )
Norm@50keV  : 2.11166E-02    ( -0.00454493   0.00427915 )
------------------------------------------------------------
#Fit statistic  : Chi-Squared                   54.01     using 59 bins.
 Reduced chi-squared = 0.947544
# Null hypothesis probability of 5.88e-01 with 57 degrees of freedom

Photon flux (15-150 keV)    in 1 sec: 2.43860 ( -0.47264  0.47692 ) ph/cm2/s
Energy fluence (15-150 keV)             : 2.56383e-07 ( -4.68946e-08  4.7069e-08 ) ergs/cm2
Cutoff power-law model
Time interval is from    1.036 sec. to    2.036 sec.
Spectral model in the cutoff power-law:
------------------------------------------------------------
Parameters  : value       lower 90%   higher 90%
Photon index: -0.705325     ( -0.399709   0.885451 )
Epeak [keV] : 1.00000E+04      ( -10000 -10000 )
Norm@50keV  : 2.12846E-02    ( -0.0045472   -0.0212846 )
------------------------------------------------------------
#Fit statistic  : Chi-Squared                   54.02     using 59 bins.
 Reduced chi-squared = 0.964643
# Null hypothesis probability of 5.50e-01 with 56 degrees of freedom

Photon flux (15-150 keV)    in 1 sec: 2.42547 ( -0.45742  0.48606 ) ph/cm2/s
Energy fluence (15-150 keV)             : 2.56289e-07 ( -4.71909e-08  4.7177e-08 ) ergs/cm2
Time-resolved spectra
Distribution
T90 vs. Hardness ratio plot
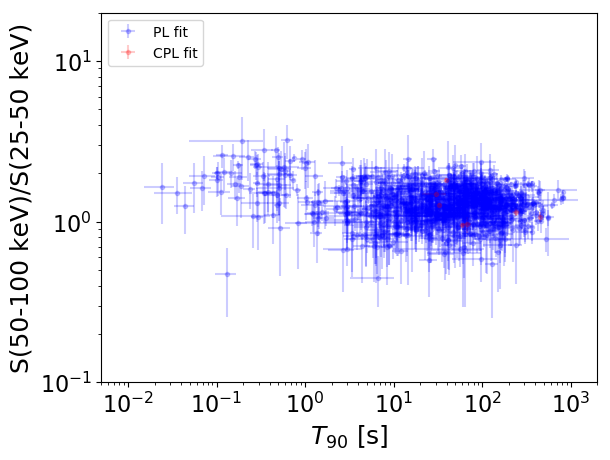
T90                                   = N/A sec.
Hardness ratio (energy fluence ratio) = N/A
S(15-50 keV) vs. S(50-150 keV) plot
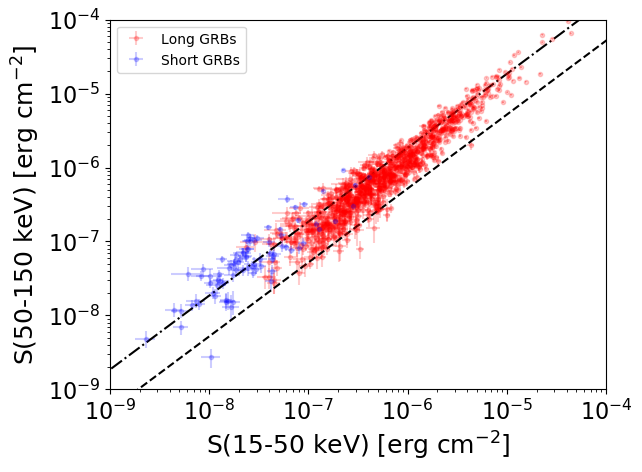
S(15-50 keV)  = N/A
S(50-150 keV) = N/A
The dash-dotted line and the dashed line traces the fluences calculated from the Band function with Epeak = 15 and 150 keV, respectively. Both lines assume a canonical values of alpha = -1 and beta = -2.5.
Mask shadow pattern
IMX = 2.317318179404066E-01, IMY = 7.403615920151344E-01
Spacecraft aspect plot
Bright source in the pre-burst/pre-slew/post-slew images
Pre-burst image of 15-350 keV band
Time interval of the image:
-93.995400 -2.424000

# RAcent  DECcent POSerr Theta    Phi  PeakCts   SNR AngSep     Name
#  [deg]    [deg]    ['] [deg]  [deg]                   [']
288.7051  11.0172   12.2  39.7   -2.2  -0.2690  -0.9    7.0	GRS 1915+105
299.5186  35.1497    3.2  14.3   11.3   0.6416   3.6    4.7	Cyg X-1
307.9353  40.9022    2.6   5.5    8.3   0.7571   4.4    8.5	Cyg X-3
326.2535  38.2627    5.0  11.4 -103.4   0.4129   2.3    5.2	Cyg X-2
 33.9671  74.5266    2.2  45.0  159.4   2.2129   5.2 ------	UNKNOWN
309.9228  60.6545    2.6  16.3  131.1   0.8470   4.4 ------	UNKNOWN
 44.6112  49.0047    2.2  58.6 -172.3   5.5904   5.2 ------	UNKNOWN
312.0703  -7.0267    2.6  51.6  -40.6   3.9379   4.5 ------	UNKNOWN
326.2881   1.4523    2.5  44.5  -60.7   3.4356   4.6 ------	UNKNOWN
Pre-slew background subtracted image of 15-350 keV band
Time interval of the image:
-2.424000 23.512000

# RAcent  DECcent POSerr Theta    Phi  PeakCts   SNR AngSep     Name
#  [deg]    [deg]    ['] [deg]  [deg]                   [']
288.7688  11.1216    4.2  39.6   -2.3   0.3927   2.7   10.7	GRS 1915+105
299.6380  34.9952    0.0  14.3   10.5   0.0987   1.1   12.6	Cyg X-1
308.1467  41.0852   35.5   5.3    8.6   0.0283   0.3    8.1	Cyg X-3
326.3080  38.2788    6.8  11.4 -103.6  -0.1458  -1.7    6.9	Cyg X-2
266.4648  25.3960    2.5  42.4   36.8   0.8997   4.7 ------	UNKNOWN
331.8091  10.1521    0.9  37.8  -72.6   2.5441  12.2 ------	UNKNOWN
Post-slew image of 15-350 keV band
Time interval of the image:
158.604630 962.194000

# RAcent  DECcent POSerr Theta    Phi  PeakCts   SNR AngSep     Name
#  [deg]    [deg]    ['] [deg]  [deg]                   [']
299.3852  35.2139   17.4  58.4  -27.1  -3.4868  -0.7   10.1	Cyg X-1
307.9646  41.0604    6.4  49.4  -27.5   4.0343   1.8    9.2	Cyg X-3
326.1717  38.3217   26.8  40.4  -43.2  -0.6562  -0.4    0.0	Cyg X-2
267.2518  59.6457    4.8  55.8   11.3  12.9141   2.4 ------	UNKNOWN
298.2403  48.0360    3.4  50.3  -14.7   7.7999   3.4 ------	UNKNOWN
 44.3594  -3.4970    3.5  59.6 -161.2  33.5211   3.3 ------	UNKNOWN
329.3465  27.8660    3.4  45.8  -56.9  11.5465   3.4 ------	UNKNOWN