Analysis Summary
Notes:
- 1) No attempt has been made to eliminate the non-significant decimal places.
- 2) This batgrbproduct analysis is done using the HEASARC data.
- 3) This batgrbproduct analysis is using the flight position for the mask-weighting calculation.
======================================================================
BAT GRB EVENT DATA PROCESSING REPORT
Process Script Ver: batgrbproduct v2.48
Process Start Time: Sun Nov 13 11:05:16 EST 2022
Host Name: batproc1
Current Working Dir: /local/data/bat1/alien/Swift_3rdBATcatalog/event/batevent_reproc/trigger1036139
======================================================================
Trigger: 01036139 Segment: 000
BAT Trigger Time: 636799385.024 [s; MET]
Trigger Stop: 636799387.072 [s; MET]
UTC: 2021-03-07T08:42:38.399080 [includes UTCF correction]
Where From?: TDRSS position message
BAT
RA: 119.190405236675 Dec: -66.9627274070328 [deg; J2000]
Catalogged Source?: NO
Point Source?: YES
GRB Indicated?: YES [ by BAT flight software ]
Image S/N Ratio: 7.9
Image Trigger?: NO
Rate S/N Ratio: 10.3923048454133 [ if not an image trigger ]
Image S/N Ratio: 7.9
Analysis Position: [ source = BAT ]
RA: 119.190405236675 Dec: -66.9627274070328 [deg; J2000]
Refined Position: [ source = BAT pre-slew burst ]
RA: 119.231232737874 Dec: -66.9680638180886 [deg; J2000]
{ 07h 56m 55.5s , -66d 58' 05.0" }
+/- 2.16939212196735 [arcmin] (estimated 90% radius based on SNR)
+/- 1.04764530363335 [arcmin] (formal 1-sigma fit error)
SNR: 10.0608677207313
Angular difference between the analysis and refined position is 1.010580 arcmin
Partial Coding Fraction: 0.796875 [ including projection effects ]
Duration
T90: 270.81199991703 +/- 74.8005222211069
Measured from: -125.259999990463
to: 145.551999926567 [s; relative to TRIGTIME]
T50: 50.6279999017715 +/- 61.5222967046276
Measured from: -2.49600005149841
to: 48.1319998502731 [s; relative to TRIGTIME]
Fluence
Peak Flux (peak 1 second)
Measured from: 1.27199995517731
to: 2.27199995517731 [s; relative to TRIGTIME]
Total Fluence
Measured from: -149.81200003624
to: 174.531999945641 [s; relative to TRIGTIME]
Band 1 Band 2 Band 3 Band 4
15-25 25-50 50-100 100-350 keV
Total 1.332042 1.631455 1.255665 0.262013
0.137632 0.139704 0.122743 0.113000 [error]
Peak 0.024181 0.036133 0.055374 0.007074
0.008464 0.009158 0.008137 0.006958 [error]
[ fluence units of on-axis counts / fully illuminated detector ]
======================================================================
====== Table of the duration information =============================
Value tstart tstop
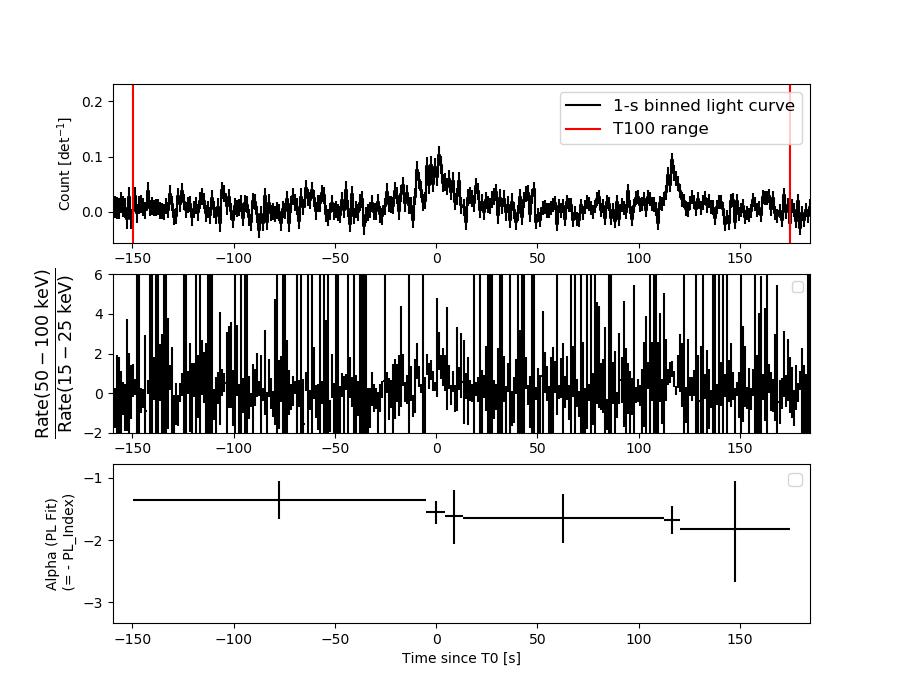
T100 324.344 -149.812 174.532
T90 270.812 -125.260 145.552
T50 50.628 -2.496 48.132
Peak 1.000 1.272 2.272
====== Spectral Analysis Summary =====================================
Model : spectral model: simple power-law (PL) and cutoff power-law (CPL)
Ph_index : photon index: E^{Ph_index}
Ph_90err : 90% error of the photon index
Epeak : Epeak in keV
Epeak_90err: 90% error of Epeak
Norm : normalization at 50 keV in both the PL model and CPL model
Nomr_90err : 90% error of the normalization
chi2 : Chi-Squared
dof : degree of freedo
=== Time-averaged spectral analysis ===
(Best model with acceptable fit: N/A)
Model Ph_index Ph_90err_low Ph_90err_hi Epeak Epeak_90err_low Epeak_90err_hi Norm Nomr_90err_low Norm_90err_hi chi2 dof
PL -1.541 -0.163 0.162 - - - 8.92e-04 -8.54e-05 8.47e-05 44.140 57
CPL -1.433 -0.336 0.548 247.152 -247.152 -247.152 1.02e-03 -3.23e-04 9.30e-04 44.170 56
=== 1-s peak spectral analysis ===
(Best model with acceptable fit: N/A)
Model Ph_index Ph_90err_low Ph_90err_hi Epeak Epeak_90err_low Epeak_90err_hi Norm Nomr_90err_low Norm_90err_hi chi2 dof
PL -1.276 -0.328 0.327 - - - 8.37e-03 -1.74e-03 1.74e-03 79.960 57
CPL 2.314 -2.588 -2.314 71.005 -10.685 31.084 2.59e-01 -2.59e-01 1.19e+02 72.840 56
=== Fluence/Peak Flux Summary ===
Model Band1 Band2 Band3 Band4 Band5 Total
15-25 25-50 50-100 100-350 15-150 15-350 keV
Fluence PL 3.84e-07 6.88e-07 9.45e-07 2.70e-06 2.73e-06 4.71e-06 erg/cm2
90%_error_low -5.75e-08 -6.46e-08 -1.20e-07 -6.59e-07 -2.84e-07 -7.70e-07 erg/cm2
90%_error_hi 5.93e-08 6.43e-08 1.20e-07 7.97e-07 2.88e-07 8.82e-07 erg/cm2
Peak flux PL 2.78e-01 3.20e-01 2.64e-01 3.66e-01 9.94e-01 1.23e+00 ph/cm2/s
90%_error_low -9.48e-02 -7.52e-02 -6.30e-02 -1.49e-01 -2.11e-01 -2.61e-01 ph/cm2/s
90%_error_hi 1.06e-01 7.42e-02 6.22e-02 1.96e-01 2.12e-01 2.65e-01 ph/cm2/s
Fluence CPL 3.82e-07 6.91e-07 9.47e-07 2.52e-06 2.72e-06 4.24e-06 erg/cm2
90%_error_low -6.39e-08 -6.75e-08 -1.20e-07 -1.57e-06 -3.25e-07 -1.32e-06 erg/cm2
90%_error_hi 4.40e-08 8.08e-08 1.23e-07 3.57e-07 2.95e-07 7.08e-07 erg/cm2
Peak flux CPL 8.72e-02 3.25e-01 3.66e-01 7.06e-02 8.41e-01 8.50e-01 ph/cm2/s
90%_error_low -8.72e-02 -1.73e-01 -9.71e-02 -7.06e-02 -2.63e-01 -2.71e-01 ph/cm2/s
90%_error_hi 1.58e-01 1.09e-01 1.11e-01 1.24e-01 2.51e-01 2.75e-01 ph/cm2/s
======================================================================
Image
Pre-slew 15.0-350.0 keV image (Event data)
#   RAcent    DECcent   POSerr    Theta     Phi              Peak Cts       SNR   Name
  119.2312   -66.9681   0.0190    29.9679    -8.0631         2.4328422     10.061 TRIG_01036139

Foreground time interval of the image:
-116.323  28.077 (delta_t = 144.400 [sec])
Background time interval of the image:
Light Curves
Note: The mask-weighted lightcurves have units of either count/det or counts/sec/det, where a det is 0.4 x 0.4 = 0.16 sq cm.
Full-time range; 1 s binning
Other quick-look light curves:
- 64 ms binning (zoomed)
- 16 ms binning (zoomed)
- 8 ms binning (zoomed)
- 2 ms binning (zoomed)
- SN=5 or 10 s binning (full-time range)
- Raw light curve
Spectra
- 64 ms binning (zoomed)
- 16 ms binning (zoomed)
- 8 ms binning (zoomed)
- 2 ms binning (zoomed)
- SN=5 or 10 s binning (full-time range)
- Raw light curve
Spectra
Notes:
- 1) The fitting includes the systematic errors.
- 2) When the burst includes telescope slew time periods, the fitting uses an average response file made from multiple 5-s response files through out the slew time plus single time preiod for the non-slew times, and weighted by the total counts in the corresponding time period using addrmf. An average response file is needed becuase a spectral fit using the pre-slew DRM will introduce some errors in both a spectral shape and a normalization if the PHA file contains a lot of the slew/post-slew time interval.
- 3) For fits to more complicated models (e.g. a power-law over a cutoff power-law), the BAT team has decided to require a chi-square improvement of more than 6 for each extra dof.
Time averaged spectrum fit using the average DRM
Power-law model

Time interval is from -149.812 sec. to  174.532 sec.

Spectral model in power-law:
------------------------------------------------------------
Parameters  : value       lower 90%   higher 90%
Photon index: -1.54082     ( -0.163285   0.162288 )
Norm@50keV  : 8.91777E-04    ( -8.54146e-05   8.47099e-05 )
------------------------------------------------------------
#Fit statistic  : Chi-Squared                   44.14     using 59 bins.
 Reduced chi-squared = 0.774386
# Null hypothesis probability of 8.93e-01 with 57 degrees of freedom

Photon flux (15-150 keV)    in 324.3 sec: 0.112599 ( -0.010371  0.01038 ) ph/cm2/s
Energy fluence (15-150 keV)             : 2.72657e-06 ( -2.84452e-07  2.88217e-07 ) ergs/cm2
Cutoff power-law model
Time interval is from -149.812 sec. to  174.532 sec.
Spectral model in the cutoff power-law:
------------------------------------------------------------
Parameters  : value       lower 90%   higher 90%
Photon index: -1.53858     ( -0.299894   0.583427 )
Epeak [keV] : 9977.59      ( -9971.93 -9971.93 )
Norm@50keV  : 8.94242E-04    ( -0.000198069   0.00105498 )
------------------------------------------------------------
#Fit statistic  : Chi-Squared                   44.14     using 59 bins.
 Reduced chi-squared = 0.788214
# Null hypothesis probability of 8.74e-01 with 56 degrees of freedom

Photon flux (15-150 keV)    in 324.3 sec: 0.112419 ( -0.010705  0.010525 ) ph/cm2/s
Energy fluence (15-150 keV)             : 2.71617e-06 ( -3.25185e-07  2.95357e-07 ) ergs/cm2
1-s peak spectrum fit
Power-law model
Time interval is from    1.272 sec. to    2.272 sec.

Spectral model in power-law:
------------------------------------------------------------
Parameters  : value       lower 90%   higher 90%
Photon index: -1.27577     ( -0.327471   0.326771 )
Norm@50keV  : 8.36634E-03    ( -0.00173602   0.00173554 )
------------------------------------------------------------
#Fit statistic  : Chi-Squared                   79.96     using 59 bins.
 Reduced chi-squared = 1.40281
# Null hypothesis probability of 2.41e-02 with 57 degrees of freedom

Photon flux (15-150 keV)    in 1 sec: 0.993843 ( -0.211149  0.212027 ) ph/cm2/s
Energy fluence (15-150 keV)             : 8.31802e-08 ( -1.86237e-08  1.88151e-08 ) ergs/cm2
Cutoff power-law model
Time interval is from    1.272 sec. to    2.272 sec.
Spectral model in the cutoff power-law:
------------------------------------------------------------
Parameters  : value       lower 90%   higher 90%
Photon index: 2.31447     ( -2.62634   -2.35283 )
Epeak [keV] : 71.0055      ( -10.6594 31.1087 )
Norm@50keV  : 0.259488    ( -0.278709   119.323 )
------------------------------------------------------------
#Fit statistic  : Chi-Squared                   72.84     using 59 bins.
 Reduced chi-squared = 1.30071
# Null hypothesis probability of 6.47e-02 with 56 degrees of freedom

Photon flux (15-150 keV)    in 1 sec: 0.841271 ( -0.262513  0.250609 ) ph/cm2/s
Energy fluence (15-150 keV)             : 7.49722e-08 ( -1.9084e-08  1.96101e-08 ) ergs/cm2
Time-resolved spectra
Distribution
T90 vs. Hardness ratio plot
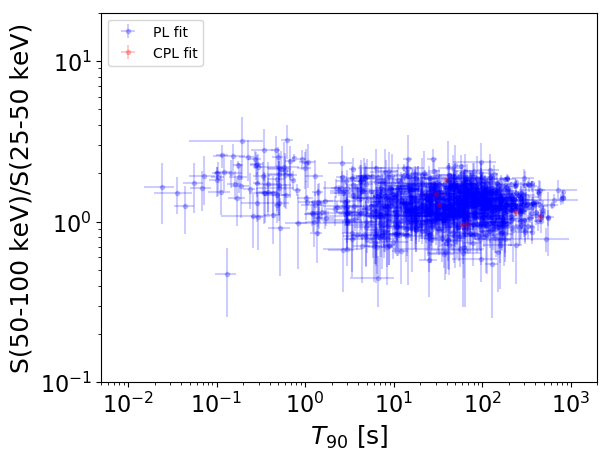
T90                                   = N/A sec.
Hardness ratio (energy fluence ratio) = N/A
S(15-50 keV) vs. S(50-150 keV) plot
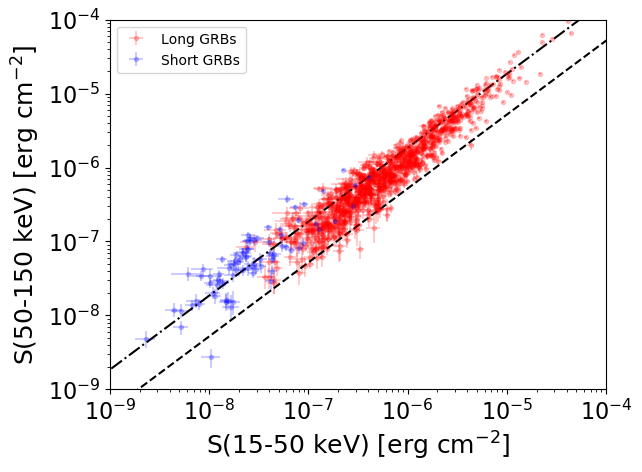
S(15-50 keV)  = N/A
S(50-150 keV) = N/A
The dash-dotted line and the dashed line traces the fluences calculated from the Band function with Epeak = 15 and 150 keV, respectively. Both lines assume a canonical values of alpha = -1 and beta = -2.5.
Mask shadow pattern
IMX = 5.709029961973128E-01, IMY = 8.087606207230236E-02
Spacecraft aspect plot
Bright source in the pre-burst/pre-slew/post-slew images
Pre-burst image of 15-350 keV band
Time interval of the image:
Pre-slew background subtracted image of 15-350 keV band
Time interval of the image:
-116.323400 28.076600

# RAcent  DECcent POSerr Theta    Phi  PeakCts   SNR AngSep     Name
#  [deg]    [deg]    ['] [deg]  [deg]                   [']
135.6105 -40.5650   11.5  41.3   37.0   0.4591   1.0    3.8	Vela X-1
170.3799 -60.6332   14.1  12.1   36.0   0.1534   0.8    2.0	Cen X-3
186.2969 -62.6801    7.4   4.4   43.2   0.2944   1.6   11.3	GX 301-2
256.0288 -37.9237    3.6  43.6 -154.3   1.2579   3.2    5.2	4U 1700-377
256.4758 -36.3507    8.1  45.1 -155.1  -0.5448  -1.4    4.8	GX 349+2
262.9749 -24.6743    5.1  58.0 -156.5  -2.7988  -2.3    4.7	GX 1+4
264.7898 -44.4994    8.9  42.2 -140.7   0.5005   1.3    3.6	4U 1735-44
263.1011 -33.7127    0.0  50.3 -150.8  -1.1413  -2.1    9.2	GX 354-0
225.4429 -14.0626    3.5  53.9  158.9   3.4872   3.3 ------	UNKNOWN
110.2688 -38.5203    3.3  54.1   16.7   3.6790   3.5 ------	UNKNOWN
118.1990 -45.1893    3.2  45.3   18.0   1.5097   3.6 ------	UNKNOWN
119.2311 -66.9680    1.1  30.0   -8.1   2.4333  10.1 ------	UNKNOWN
255.6782 -48.7797    1.5  34.9 -144.0   2.1945   7.7 ------	UNKNOWN
262.7901 -27.0765    3.7  55.9 -155.3   2.6824   3.1 ------	UNKNOWN
 17.1784 -70.3439    2.5  45.8  -57.0   3.7723   4.5 ------	UNKNOWN
Post-slew image of 15-350 keV band
Time interval of the image:
80.076590 716.754500
720.976000 903.306000

# RAcent  DECcent POSerr Theta    Phi  PeakCts   SNR AngSep     Name
#  [deg]    [deg]    ['] [deg]  [deg]                   [']
135.5664 -40.4819    4.0  28.0   67.8   4.3158   2.9    4.7	Vela X-1
170.6002 -60.7792    8.0  22.7  139.7   1.8078   1.4   12.6	Cen X-3
186.6844 -62.6295    6.7  27.6  154.2  -2.0586  -1.7    8.5	GX 301-2
119.0015 -20.1227    4.1  46.8   40.4   8.0255   2.8 ------	UNKNOWN
 99.4570 -14.4418    4.0  54.1   16.8  13.8616   2.9 ------	UNKNOWN
161.8976 -63.8000    4.2  17.7  140.6   3.2089   2.8 ------	UNKNOWN
 71.4319 -17.9645    3.1  57.7  -15.8  15.9261   3.8 ------	UNKNOWN
 65.4401 -34.3580    3.6  44.7  -30.5   6.3562   3.2 ------	UNKNOWN