Analysis Summary
Notes:
- 1) No attempt has been made to eliminate the non-significant decimal places.
- 2) This batgrbproduct analysis is done using the HEASARC data.
- 3) This batgrbproduct analysis is using the flight position for the mask-weighting calculation.
======================================================================
                  BAT GRB EVENT DATA PROCESSING REPORT
    Process Script Ver: batgrbproduct v2.48
    Process Start Time: Fri Jul 29 23:49:15 EDT 2022
             Host Name: batproc1
   Current Working Dir: /local/data/bat1/alien/Swift_3rdBATcatalog/event/batevent_reproc/trigger1036227
======================================================================

  Trigger: 01036227      Segment: 000

  BAT Trigger Time: 636878303.488   [s; MET]
      Trigger Stop: 636878304   [s; MET]
               UTC: 2021-03-08T06:37:56.857840    [includes UTCF correction]
       Where From?: TDRSS position message

  BAT
    RA: 67.0882570427199   Dec: 37.410718238673  [deg; J2000]

     Catalogged Source?: NO
     Point Source?:      YES
     GRB Indicated?:     YES    [ by BAT flight software ]
     Image S/N Ratio:    8.39
     Image Trigger?:     NO
     Rate S/N Ratio:     19.3390796058137  [ if not an image trigger ]
     Image S/N Ratio:    8.39

  Analysis Position:   [ source = BAT ]
    RA: 67.0882570427199   Dec: 37.410718238673  [deg; J2000]

  Refined Position:   [ source = BAT pre-slew burst ]
    RA: 67.0814980906613   Dec: 37.4296483371345  [deg; J2000]
        { 04h 28m 19.6s , +37d 25' 46.7" }
         +/- 0.894694416404647 [arcmin] (estimated 90% radius based on SNR)
         +/- 0.278549915309252 [arcmin] (formal 1-sigma fit error)
    SNR: 35.6577950331624

  Angular difference between the analysis and refined position is 1.180588 arcmin

  Partial Coding Fraction: 0.3203125    [ including projection effects ]

  Duration
     T90: 6.18799984455109 +/- 0.81285916694803
        Measured from: 0.332000017166138
                   to: 6.51999986171722     [s; relative to TRIGTIME]
     T50: 1.59599995613098 +/- 0.174264172934037
        Measured from: 2.01199996471405
                   to: 3.60799992084503     [s; relative to TRIGTIME]


  Fluence
     Peak Flux  (peak 1 second)
        Measured from: 2.12399995326996
                   to: 3.12399995326996     [s; relative to TRIGTIME]
     Total Fluence
        Measured from: -0.0400000810623169
                   to: 8.79199993610382     [s; relative to TRIGTIME]

             Band 1     Band 2     Band 3     Band 4
              15-25      25-50     50-100    100-350     keV
 Total     1.021874   1.667430   1.660019   0.382231
           0.049275   0.057031   0.054164   0.040295 [error]
 Peak      0.290689   0.512708   0.635417   0.190384
           0.020578   0.026434   0.028570   0.018686 [error]

     [ fluence units of on-axis counts / fully illuminated detector ]

======================================================================


====== Table of the duration information =============================

        Value   tstart    tstop
T100    8.832   -0.040    8.792
T90     6.188    0.332    6.520
T50     1.596    2.012    3.608
Peak    1.000    2.124    3.124


====== Spectral Analysis Summary =====================================

Model      : spectral model: simple power-law (PL) and cutoff power-law (CPL)
Ph_index   : photon index: E^{Ph_index}
Ph_90err   : 90% error of the photon index
Epeak      : Epeak in keV
Epeak_90err: 90% error of Epeak
Norm       : normalization at 50 keV in both the PL model and CPL model
Nomr_90err : 90% error of the normalization
chi2       : Chi-Squared
dof        : degree of freedo

=== Time-averaged spectral analysis ===
(Best model with acceptable fit: N/A)

Model Ph_index Ph_90err_low Ph_90err_hi  Epeak  Epeak_90err_low  Epeak_90err_hi  Norm       Nomr_90err_low    Norm_90err_hi    chi2    dof
PL      -1.388    -0.064      0.064       -           -               -         3.94e-02     -1.47e-03          1.47e-03      68.050   57
CPL     -0.844    -0.269      0.286      119.833     -23.067        60.403      6.96e-02     -1.66e-02          2.33e-02      55.460   56


=== 1-s peak spectral analysis ===
(Best model with acceptable fit: N/A)

Model Ph_index Ph_90err_low Ph_90err_hi  Epeak  Epeak_90err_low  Epeak_90err_hi  Norm       Nomr_90err_low    Norm_90err_hi    chi2    dof
PL      -1.195     -0.084     0.084       -           -               -         1.16e-01     -5.96e-03          5.96e-03      68.550   57
CPL     -0.523     -0.358     0.389      128.535     -27.061        77.411      2.30e-01     -6.88e-02          1.07e-01      57.680   56


=== Fluence/Peak Flux Summary ===

              Model    Band1     Band2     Band3     Band4     Band5     Total
                       15-25     25-50    50-100    100-350    15-150    15-350    keV
Fluence         PL   4.00e-07  7.87e-07  1.20e-06  4.02e-06  3.37e-06  6.41e-06   erg/cm2
      90%_error_low -2.80e-08 -3.38e-08 -5.27e-08 -3.74e-07 -1.32e-07 -4.08e-07   erg/cm2
      90%_error_hi   2.87e-08  3.36e-08  5.26e-08  3.98e-07  1.33e-07  4.27e-07   erg/cm2
Peak flux       PL   3.55e+00  4.29e+00  3.75e+00  5.61e+00  1.36e+01  1.72e+01   ph/cm2/s
      90%_error_low -3.38e-01 -2.61e-01 -2.17e-01 -6.39e-01 -7.23e-01 -9.22e-01   ph/cm2/s
      90%_error_hi   3.49e-01  2.59e-01  2.16e-01  6.82e-01  7.24e-01  9.27e-01   ph/cm2/s

Fluence        CPL   3.51e-07  8.17e-07  1.27e-06  2.14e-06  3.30e-06  4.59e-06   erg/cm2
      90%_error_low -3.53e-08 -3.78e-08 -6.37e-08 -5.23e-07 -1.39e-07 -5.30e-07   erg/cm2
      90%_error_hi   3.62e-08  3.81e-08  6.44e-08  7.36e-07  1.39e-07  7.30e-07   erg/cm2
Peak flux      CPL   2.98e+00  4.46e+00  4.11e+00  3.27e+00  1.33e+01  1.48e+01   ph/cm2/s
      90%_error_low -4.30e-01 -2.89e-01 -2.88e-01 -7.75e-01 -7.36e-01 -1.09e+00   ph/cm2/s
      90%_error_hi   4.44e-01  2.91e-01  2.93e-01  1.06e+00  7.37e-01  1.26e+00   ph/cm2/s

======================================================================
Image
Pre-slew 15.0-350.0 keV image (Event data)

#   RAcent    DECcent   POSerr    Theta     Phi              Peak Cts       SNR   Name
   67.0815    37.4296   0.0054    44.9420  -147.1295         4.9927045     35.658 TRIG_01036227

Foreground time interval of the image:
 -0.040   8.792 (delta_t =   8.832 [sec])
Background time interval of the image:
-239.488  -0.040 (delta_t = 239.448 [sec])
Light Curves
Note: The mask-weighted lightcurves have units of either count/det or counts/sec/det, where a det is 0.4 x 0.4 = 0.16 sq cm.
Full-time range; 1 s binning
Other quick-look light curves:
- 64 ms binning (zoomed)
- 16 ms binning (zoomed)
- 8 ms binning (zoomed)
- 2 ms binning (zoomed)
- SN=5 or 10 s binning (full-time range)
- Raw light curve
Spectra
- 64 ms binning (zoomed)
- 16 ms binning (zoomed)
- 8 ms binning (zoomed)
- 2 ms binning (zoomed)
- SN=5 or 10 s binning (full-time range)
- Raw light curve
Spectra
Notes:
- 1) The fitting includes the systematic errors.
- 2) When the burst includes telescope slew time periods, the fitting uses an average response file made from multiple 5-s response files through out the slew time plus single time preiod for the non-slew times, and weighted by the total counts in the corresponding time period using addrmf. An average response file is needed becuase a spectral fit using the pre-slew DRM will introduce some errors in both a spectral shape and a normalization if the PHA file contains a lot of the slew/post-slew time interval.
- 3) For fits to more complicated models (e.g. a power-law over a cutoff power-law), the BAT team has decided to require a chi-square improvement of more than 6 for each extra dof.
Time averaged spectrum fit using the average DRM
Power-law model

Time interval is from   -0.040 sec. to    8.792 sec.

Spectral model in power-law:
------------------------------------------------------------
Parameters  : value       lower 90%   higher 90%
Photon index: -1.38757     ( -0.0638111   0.0638512 )
Norm@50keV  : 3.94060E-02    ( -0.00146619   0.00146617 )
------------------------------------------------------------
#Fit statistic  : Chi-Squared                   68.05     using 59 bins.
 Reduced chi-squared = 1.19386
# Null hypothesis probability of 1.50e-01 with 57 degrees of freedom

Photon flux (15-150 keV)    in 8.832 sec: 4.78563 ( -0.19138  0.19178 ) ph/cm2/s
Energy fluence (15-150 keV)             : 3.37201e-06 ( -1.32431e-07  1.32591e-07 ) ergs/cm2
Cutoff power-law model
Time interval is from   -0.040 sec. to    8.792 sec.
Spectral model in the cutoff power-law:
------------------------------------------------------------
Parameters  : value       lower 90%   higher 90%
Photon index: -0.844099     ( -0.268852   0.28573 )
Epeak [keV] : 119.833      ( -23.0674 60.4021 )
Norm@50keV  : 6.95510E-02    ( -0.016626   0.0233043 )
------------------------------------------------------------
#Fit statistic  : Chi-Squared                   55.46     using 59 bins.
 Reduced chi-squared = 0.990357
# Null hypothesis probability of 4.95e-01 with 56 degrees of freedom

Photon flux (15-150 keV)    in 8.832 sec: 4.65535 ( -0.20046  0.20116 ) ph/cm2/s
Energy fluence (15-150 keV)             : 3.29874e-06 ( -1.39165e-07  1.38886e-07 ) ergs/cm2
1-s peak spectrum fit
Power-law model

Time interval is from    2.124 sec. to    3.124 sec.

Spectral model in power-law:
------------------------------------------------------------
Parameters  : value       lower 90%   higher 90%
Photon index: -1.19472     ( -0.0836211   0.0836204 )
Norm@50keV  : 0.115541    ( -0.005965   0.00596428 )
------------------------------------------------------------
#Fit statistic  : Chi-Squared                   68.55     using 59 bins.
 Reduced chi-squared = 1.20263
# Null hypothesis probability of 1.40e-01 with 57 degrees of freedom

Photon flux (15-150 keV)    in 1 sec: 13.5522 ( -0.7235  0.7242 ) ph/cm2/s
Energy fluence (15-150 keV)             : 1.17409e-06 ( -6.54514e-08  6.55912e-08 ) ergs/cm2
Cutoff power-law model

Time interval is from    2.124 sec. to    3.124 sec.
Spectral model in the cutoff power-law:
------------------------------------------------------------
Parameters  : value       lower 90%   higher 90%
Photon index: -0.523147     ( -0.358351   0.388506 )
Epeak [keV] : 128.535      ( -27.0608 77.4114 )
Norm@50keV  : 0.229619    ( -0.0688193   0.106577 )
------------------------------------------------------------
#Fit statistic  : Chi-Squared                   57.68     using 59 bins.
 Reduced chi-squared = 1.03
# Null hypothesis probability of 4.13e-01 with 56 degrees of freedom

Photon flux (15-150 keV)    in 1 sec: 13.2877 ( -0.7359  0.7371 ) ph/cm2/s
Energy fluence (15-150 keV)             : 1.16003e-06 ( -6.74833e-08  6.7381e-08 ) ergs/cm2
Time-resolved spectra

Distribution
T90 vs. Hardness ratio plot
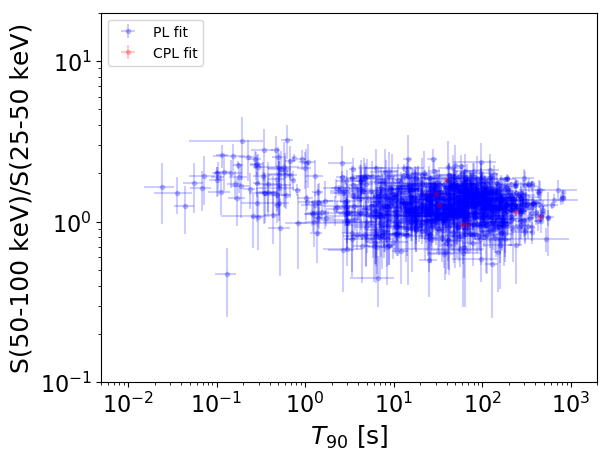
T90                                   = N/A sec.
Hardness ratio (energy fluence ratio) = N/A
S(15-50 keV) vs. S(50-150 keV) plot

S(15-50 keV)  = N/A
S(50-150 keV) = N/A
The dash-dotted line and the dashed line traces the fluences calculated from the Band function with Epeak = 15 and 150 keV, respectively. Both lines assume a canonical values of alpha = -1 and beta = -2.5.
Mask shadow pattern

IMX = -8.381999683979031E-01, IMY = 5.416433501750929E-01
Spacecraft aspect plot
Bright source in the pre-burst/pre-slew/post-slew images
Pre-burst image of 15-350 keV band
Time interval of the image:
-239.488000 -0.040000

# RAcent  DECcent POSerr Theta    Phi  PeakCts   SNR AngSep     Name
#  [deg]    [deg]    ['] [deg]  [deg]                   [']
 83.6239  22.0024    0.7  49.9 -175.0  10.7087  16.4    0.9	Crab
192.6539  50.8667    3.0  35.3   20.4   1.6421   3.9 ------	UNKNOWN
 93.0293  14.6840    2.7  52.8  170.7   4.1535   4.3 ------	UNKNOWN
155.5468  56.5209    2.5  13.9   38.1   1.2862   4.7 ------	UNKNOWN
186.1576  61.2547    2.7  26.7    6.9   1.4070   4.3 ------	UNKNOWN
 67.1384  22.1140    3.8  57.5 -158.5   4.3596   3.1 ------	UNKNOWN
287.2655  68.5162    2.7  50.2  -45.5   5.7632   4.2 ------	UNKNOWN
Pre-slew background subtracted image of 15-350 keV band
Time interval of the image:
-0.040000 8.792000

# RAcent  DECcent POSerr Theta    Phi  PeakCts   SNR AngSep     Name
#  [deg]    [deg]    ['] [deg]  [deg]                   [']
 83.7346  22.1361    6.6  49.8 -175.0  -0.2649  -1.8    9.2	Crab
190.1388  33.5312    2.3  46.8   40.6   0.7832   5.1 ------	UNKNOWN
 97.4551  10.5058    2.5  55.2  163.9   1.3377   4.6 ------	UNKNOWN
 67.0815  37.4296    0.3  44.9 -147.1   4.9929  35.6 ------	UNKNOWN
 16.6771  85.9648    2.7  31.6  -63.2   0.4122   4.3 ------	UNKNOWN
 54.9549  55.3299    2.6  38.1 -119.0   0.5548   4.5 ------	UNKNOWN
Post-slew image of 15-350 keV band
Time interval of the image:
73.612590 710.792000
720.512000 962.529900

# RAcent  DECcent POSerr Theta    Phi  PeakCts   SNR AngSep     Name
#  [deg]    [deg]    ['] [deg]  [deg]                   [']
 83.6433  22.0146    0.3  21.0  143.8  37.1452  34.1    0.6	Crab
174.9477  85.2399    4.5  54.2   16.8  12.7856   2.6 ------	UNKNOWN
 64.1729  76.7099    3.4  39.3   10.1   4.8804   3.4 ------	UNKNOWN