Analysis Summary
Notes:
- 1) No attempt has been made to eliminate the non-significant decimal places.
- 2) This batgrbproduct analysis is done using the HEASARC data.
- 3) This batgrbproduct analysis is using the flight position for the mask-weighting calculation.
======================================================================
BAT GRB EVENT DATA PROCESSING REPORT
Process Script Ver: batgrbproduct v2.48
Process Start Time: Fri Jul 29 23:47:42 EDT 2022
Host Name: batproc1
Current Working Dir: /local/data/bat1/alien/Swift_3rdBATcatalog/event/batevent_reproc/trigger1037339
======================================================================
Trigger: 01037339 Segment: 000
BAT Trigger Time: 637732498.368 [s; MET]
Trigger Stop: 637732501.44 [s; MET]
UTC: 2021-03-18T03:54:31.681240 [includes UTCF correction]
Where From?: TDRSS position message
BAT
RA: 33.9302682502313 Dec: -37.7895119002422 [deg; J2000]
Catalogged Source?: NO
Point Source?: YES
GRB Indicated?: YES [ by BAT flight software ]
Image S/N Ratio: 7.72
Image Trigger?: NO
Rate S/N Ratio: 11.2694276695846 [ if not an image trigger ]
Image S/N Ratio: 7.72
Analysis Position: [ source = BAT ]
RA: 33.9302682502313 Dec: -37.7895119002422 [deg; J2000]
Refined Position: [ source = BAT pre-slew burst ]
RA: 33.9037670566305 Dec: -37.7724157060411 [deg; J2000]
{ 02h 15m 36.9s , -37d 46' 20.7" }
+/- 2.51594833469396 [arcmin] (estimated 90% radius based on SNR)
+/- 0.990562315218269 [arcmin] (formal 1-sigma fit error)
SNR: 8.14117993309832
Angular difference between the analysis and refined position is 1.622211 arcmin
Partial Coding Fraction: 0.7578125 [ including projection effects ]
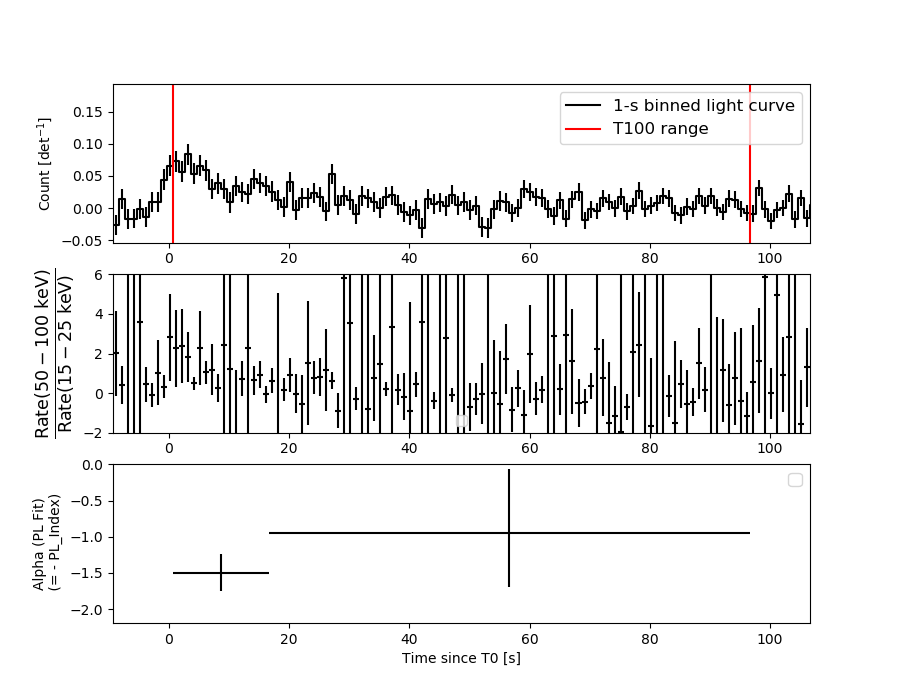
Duration
T90: 80 +/- 50.5964425626941
Measured from: 0.631999969482422
to: 80.6319999694824 [s; relative to TRIGTIME]
T50: 16 +/- 48
Measured from: 0.631999969482422
to: 16.6319999694824 [s; relative to TRIGTIME]
Fluence
Peak Flux (peak 1 second)
Measured from: 8.13199996948242
to: 9.13199996948242 [s; relative to TRIGTIME]
Total Fluence
Measured from: 0.631999969482422
to: 96.6319999694824 [s; relative to TRIGTIME]
Band 1 Band 2 Band 3 Band 4
15-25 25-50 50-100 100-350 keV
Total 0.187743 0.492939 0.398730 0.139290
0.073311 0.076115 0.068829 0.065786 [error]
Peak 0.005030 0.028501 -0.000319 0.013767
0.008531 0.008490 0.007735 0.007178 [error]
[ fluence units of on-axis counts / fully illuminated detector ]
======================================================================
====== Table of the duration information =============================
Value tstart tstop
T100 96.000 0.632 96.632
T90 80.000 0.632 80.632
T50 16.000 0.632 16.632
Peak 1.000 8.132 9.132
====== Spectral Analysis Summary =====================================
Model : spectral model: simple power-law (PL) and cutoff power-law (CPL)
Ph_index : photon index: E^{Ph_index}
Ph_90err : 90% error of the photon index
Epeak : Epeak in keV
Epeak_90err: 90% error of Epeak
Norm : normalization at 50 keV in both the PL model and CPL model
Nomr_90err : 90% error of the normalization
chi2 : Chi-Squared
dof : degree of freedo
=== Time-averaged spectral analysis ===
(Best model with acceptable fit: N/A)
Model Ph_index Ph_90err_low Ph_90err_hi Epeak Epeak_90err_low Epeak_90err_hi Norm Nomr_90err_low Norm_90err_hi chi2 dof
PL -1.280 -0.335 0.342 - - - 8.40e-04 -1.57e-04 1.57e-04 59.760 57
CPL -1.043 -1.808 1.237 212.681 -212.681 -212.681 1.09e-03 -4.05e-04 2.88e-03 59.740 56
=== 1-s peak spectral analysis ===
(Best model with acceptable fit: N/A)
Model Ph_index Ph_90err_low Ph_90err_hi Epeak Epeak_90err_low Epeak_90err_hi Norm Nomr_90err_low Norm_90err_hi chi2 dof
PL -1.678 -1.350 1.394 - - - 2.41e-03 -1.77e-03 1.71e-03 57.900 57
CPL 5.550 N/A N/A 35.250 N/A N/A 1.20e+02 N/A N/A 54.350 56
=== Fluence/Peak Flux Summary ===
Model Band1 Band2 Band3 Band4 Band5 Total
15-25 25-50 50-100 100-350 15-150 15-350 keV
Fluence PL 8.38e-08 1.76e-07 2.90e-07 1.08e-06 8.01e-07 1.63e-06 erg/cm2
90%_error_low -2.76e-08 -3.70e-08 -6.83e-08 -4.69e-07 -1.67e-07 -5.28e-07 erg/cm2
90%_error_hi 3.04e-08 3.60e-08 6.70e-08 6.81e-07 1.70e-07 7.08e-07 erg/cm2
Peak flux PL 1.18e-01 1.07e-01 6.65e-02 6.34e-02 3.17e-01 3.54e-01 ph/cm2/s
90%_error_low -1.18e-01 -1.07e-01 -5.41e-02 -6.34e-02 -2.07e-01 -2.33e-01 ph/cm2/s
90%_error_hi 1.19e-01 7.00e-02 6.19e-02 2.27e-01 2.08e-01 6.29e-01 ph/cm2/s
Fluence CPL 8.16e-08 1.78e-07 2.94e-07 8.79e-07 7.93e-07 1.43e-06 erg/cm2
90%_error_low -3.32e-08 -3.88e-08 -7.10e-08 -6.91e-07 -1.80e-07 -7.23e-07 erg/cm2
90%_error_hi 2.80e-08 4.21e-08 7.56e-08 5.72e-07 1.76e-07 3.89e-07 erg/cm2
Peak flux CPL 6.38e-02 2.18e-01 1.43e-02 3.72e-07 2.92e-01 2.90e-01 ph/cm2/s
90%_error_low -6.38e-02 -2.18e-01 -1.43e-02 -3.72e-07 -1.46e-01 -1.44e-01 ph/cm2/s
90%_error_hi 1.30e-01 1.02e-01 4.77e-02 1.92e-03 1.79e-01 1.82e-01 ph/cm2/s
======================================================================
Image
Pre-slew 15.0-350.0 keV image (Event data)
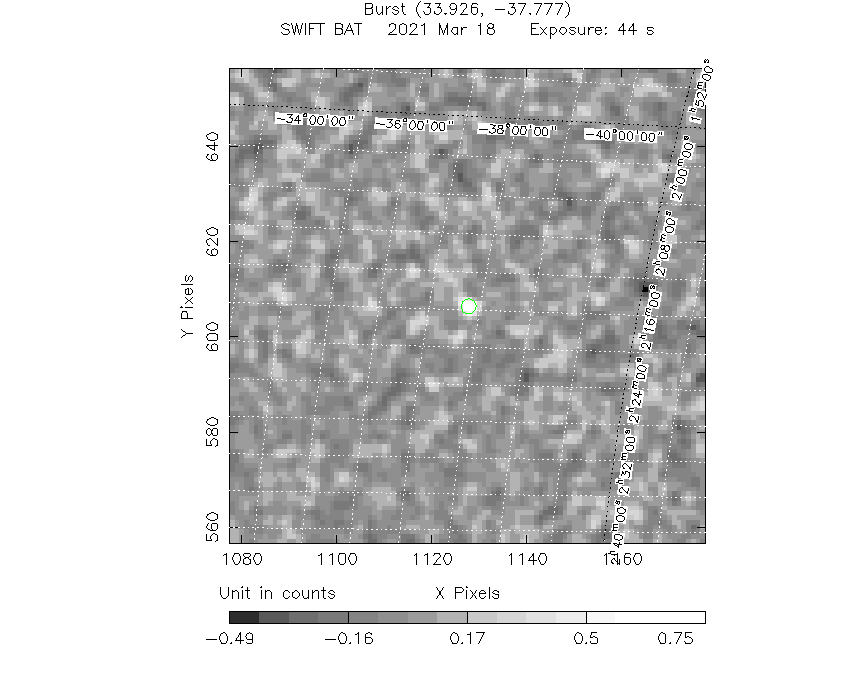
#   RAcent    DECcent   POSerr    Theta     Phi              Peak Cts       SNR   Name
   33.9038   -37.7724   0.0236    30.4678  -152.3846         0.9503037      8.141 TRIG_01037339

Foreground time interval of the image:
  0.632  44.133 (delta_t =  43.501 [sec])
Background time interval of the image:
-239.368   0.632 (delta_t = 240.000 [sec])
Light Curves
Note: The mask-weighted lightcurves have units of either count/det or counts/sec/det, where a det is 0.4 x 0.4 = 0.16 sq cm.
Full-time range; 1 s binning
Other quick-look light curves:
- 64 ms binning (zoomed)
- 16 ms binning (zoomed)
- 8 ms binning (zoomed)
- 2 ms binning (zoomed)
- SN=5 or 10 s binning (full-time range)
- Raw light curve
Spectra
- 64 ms binning (zoomed)
- 16 ms binning (zoomed)
- 8 ms binning (zoomed)
- 2 ms binning (zoomed)
- SN=5 or 10 s binning (full-time range)
- Raw light curve
Spectra
Notes:
- 1) The fitting includes the systematic errors.
- 2) When the burst includes telescope slew time periods, the fitting uses an average response file made from multiple 5-s response files through out the slew time plus single time preiod for the non-slew times, and weighted by the total counts in the corresponding time period using addrmf. An average response file is needed becuase a spectral fit using the pre-slew DRM will introduce some errors in both a spectral shape and a normalization if the PHA file contains a lot of the slew/post-slew time interval.
- 3) For fits to more complicated models (e.g. a power-law over a cutoff power-law), the BAT team has decided to require a chi-square improvement of more than 6 for each extra dof.
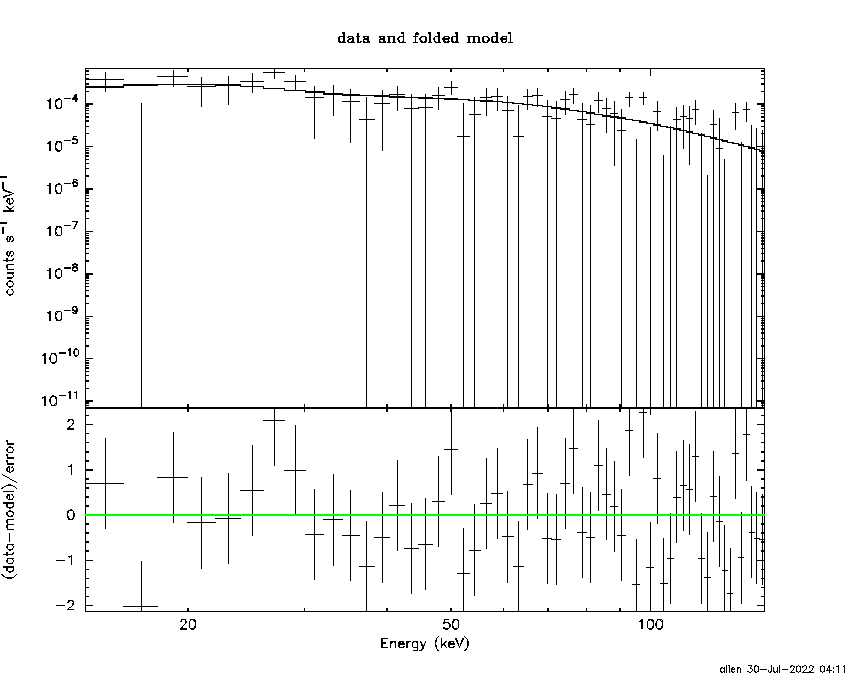
Time averaged spectrum fit using the average DRM
Power-law model

Time interval is from    0.632 sec. to   96.632 sec.

Spectral model in power-law:
------------------------------------------------------------
Parameters  : value       lower 90%   higher 90%
Photon index: -1.27997     ( -0.335135   0.341553 )
Norm@50keV  : 8.39768E-04    ( -0.000157072   0.000156812 )
------------------------------------------------------------
#Fit statistic  : Chi-Squared                   59.76     using 59 bins.
 Reduced chi-squared = 1.04842
# Null hypothesis probability of 3.76e-01 with 57 degrees of freedom

Photon flux (15-150 keV)    in 96 sec: 9.98271E-02 ( -0.0190271  0.0191009 ) ph/cm2/s
Energy fluence (15-150 keV)             : 8.00702e-07 ( -1.67356e-07  1.70235e-07 ) ergs/cm2
Cutoff power-law model
Time interval is from    0.632 sec. to   96.632 sec.
Spectral model in the cutoff power-law:
------------------------------------------------------------
Parameters  : value       lower 90%   higher 90%
Photon index: -1.04314     ( -1.74586   1.29935 )
Epeak [keV] : 212.681      ( -293.15 -293.15 )
Norm@50keV  : 1.09387E-03    ( -0.000284849   0.00299583 )
------------------------------------------------------------
#Fit statistic  : Chi-Squared                   59.74     using 59 bins.
 Reduced chi-squared = 1.06679
# Null hypothesis probability of 3.42e-01 with 56 degrees of freedom

Photon flux (15-150 keV)    in 96 sec: 9.92000E-02 ( -0.0197226  0.019525 ) ph/cm2/s
Energy fluence (15-150 keV)             : 7.93051e-07 ( -1.79782e-07  1.75586e-07 ) ergs/cm2
1-s peak spectrum fit
Power-law model
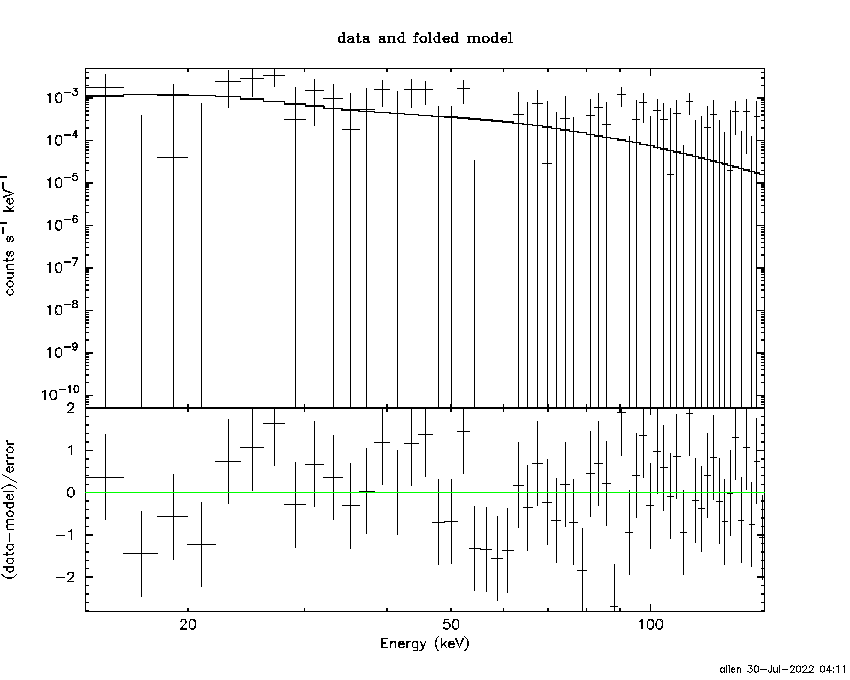
Time interval is from    8.132 sec. to    9.132 sec.

Spectral model in power-law:
------------------------------------------------------------
Parameters  : value       lower 90%   higher 90%
Photon index: -1.67846     ( -1.34937   1.39518 )
Norm@50keV  : 2.40740E-03    ( -0.00176941   0.00170942 )
------------------------------------------------------------
#Fit statistic  : Chi-Squared                   57.90     using 59 bins.
 Reduced chi-squared = 1.01579
# Null hypothesis probability of 4.42e-01 with 57 degrees of freedom

Photon flux (15-150 keV)    in 1 sec: 0.317387 ( -0.207242  0.20798 ) ph/cm2/s
Energy fluence (15-150 keV)             : 2.23254e-08 ( -1.57058e-08  1.79463e-08 ) ergs/cm2
Cutoff power-law model
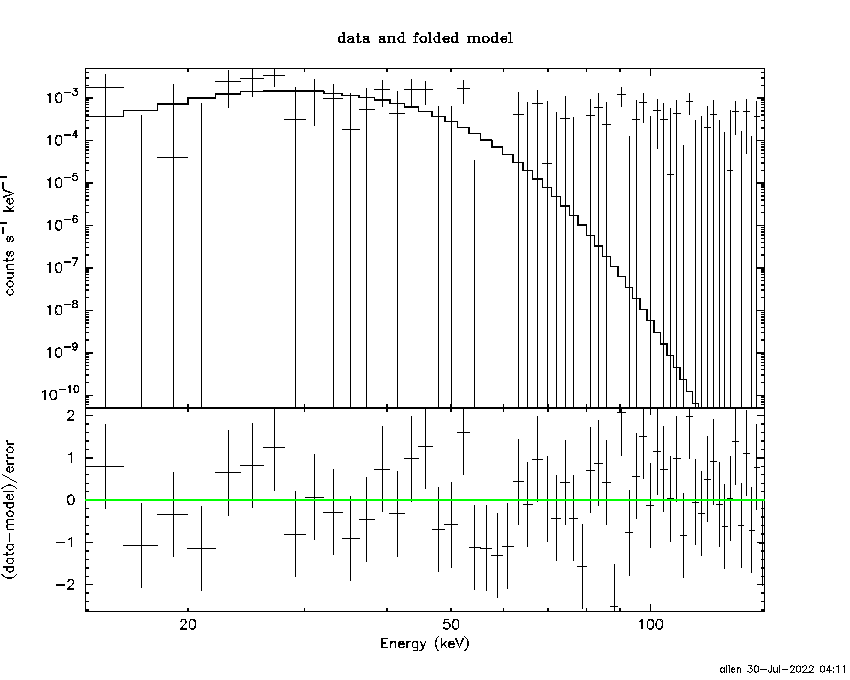
Time interval is from    8.132 sec. to    9.132 sec.
Spectral model in the cutoff power-law:
------------------------------------------------------------
Parameters  : value       lower 90%   higher 90%
Photon index: 9.80268     (       )
Epeak [keV] : 34.7778      (   )
Norm@50keV  : 5.10085E+04    (     )
------------------------------------------------------------
#Fit statistic  : Chi-Squared                   53.69     using 59 bins.
 Reduced chi-squared = 0.95875
# Null hypothesis probability of 5.63e-01 with 56 degrees of freedom

Photon flux (15-150 keV)    in 1 sec: 0.291972 ( -0.145799  0.178887 ) ph/cm2/s
Energy fluence (15-150 keV)             : 1.5056e-08 ( -7.46987e-09  8.87936e-09 ) ergs/cm2
Time-resolved spectra
Distribution
T90 vs. Hardness ratio plot
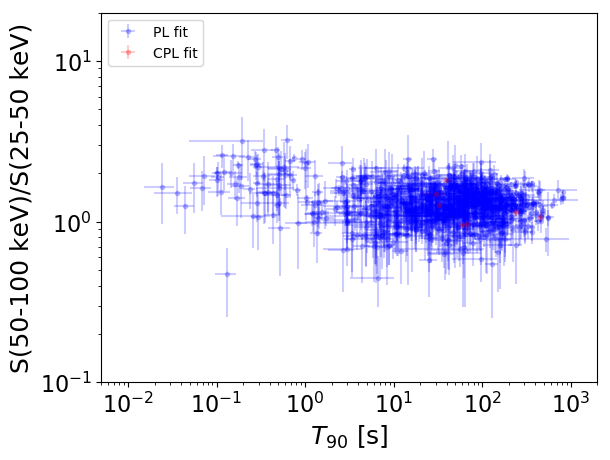
T90                                   = N/A sec.
Hardness ratio (energy fluence ratio) = N/A
S(15-50 keV) vs. S(50-150 keV) plot
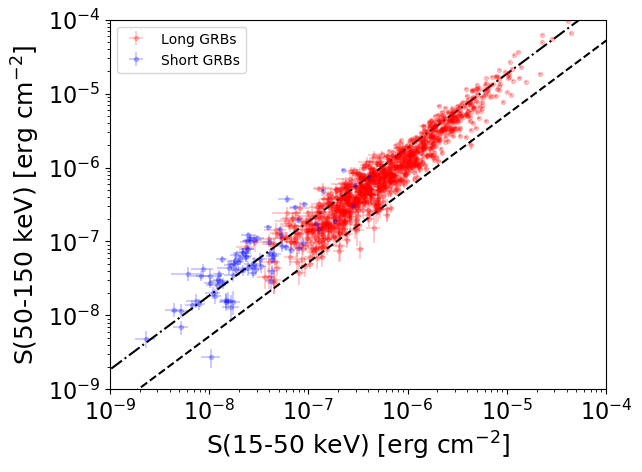
S(15-50 keV)  = N/A
S(50-150 keV) = N/A
The dash-dotted line and the dashed line traces the fluences calculated from the Band function with Epeak = 15 and 150 keV, respectively. Both lines assume a canonical values of alpha = -1 and beta = -2.5.
Mask shadow pattern
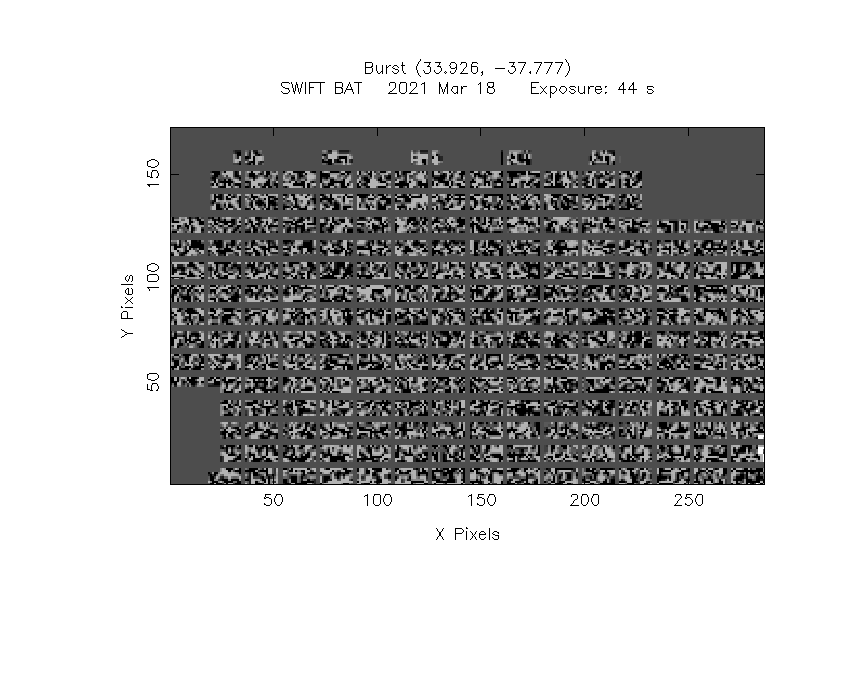
IMX = -5.212699673120080E-01, IMY = 2.726921884670455E-01
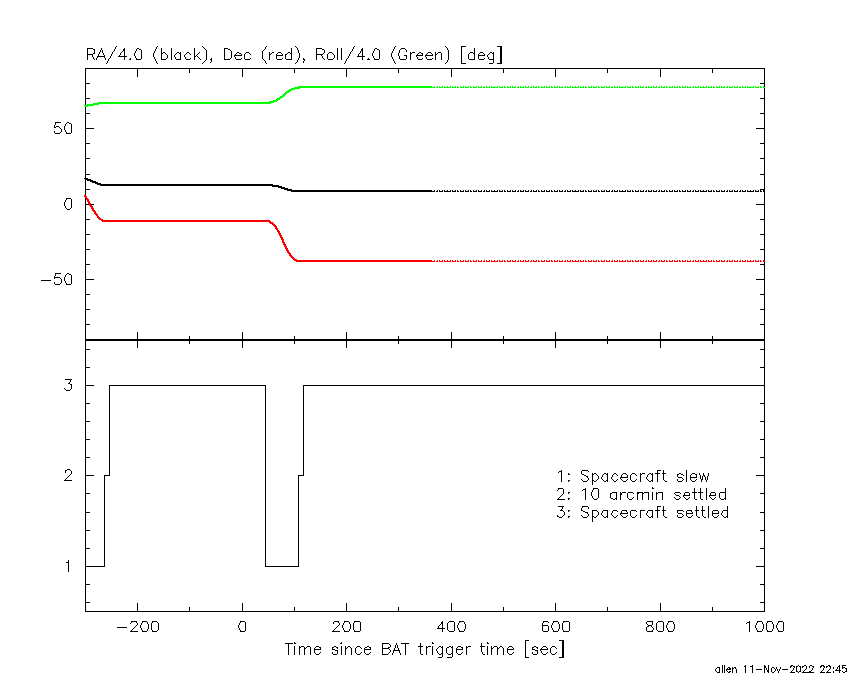
Spacecraft aspect plot
Bright source in the pre-burst/pre-slew/post-slew images
Pre-burst image of 15-350 keV band
Time interval of the image:
-239.368000 0.632000

# RAcent  DECcent POSerr Theta    Phi  PeakCts   SNR AngSep     Name
#  [deg]    [deg]    ['] [deg]  [deg]                   [']
 83.6588  22.0042    1.3  46.5   45.9   8.6095   8.8    1.5	Crab
 83.0543   4.9080    2.6  36.3   66.9   3.3219   4.5 ------	UNKNOWN
 31.9226  -3.5251    3.5  19.8  -67.4   1.1316   3.3 ------	UNKNOWN
 13.0256 -64.8367    3.6  59.6 -161.2   8.7980   3.2 ------	UNKNOWN
 11.3393  10.8393    3.4  44.6  -60.4   4.4144   3.4 ------	UNKNOWN
Pre-slew background subtracted image of 15-350 keV band
Time interval of the image:
0.632000 44.132600

# RAcent  DECcent POSerr Theta    Phi  PeakCts   SNR AngSep     Name
#  [deg]    [deg]    ['] [deg]  [deg]                   [']
 83.7743  22.0153   21.9  46.6   46.0   0.2248   0.5    7.8	Crab
 82.5412   1.4740    2.3  34.4   71.9   1.0867   4.9 ------	UNKNOWN
 86.2932 -58.0217    2.1  54.2  158.9   2.7167   5.4 ------	UNKNOWN
 66.2725  28.3881    1.9  42.4   22.4   1.0937   6.0 ------	UNKNOWN
 69.3896  -5.3811    2.0  19.7   76.0   0.6730   5.9 ------	UNKNOWN
 33.9038 -37.7724    1.4  30.5 -152.4   0.9504   8.1 ------	UNKNOWN
 30.7655  29.0728    2.3  44.4  -23.4   0.8845   5.0 ------	UNKNOWN
 25.9835  43.3478    2.0  58.8  -19.1   3.2508   5.7 ------	UNKNOWN
  5.4105 -54.7449    2.1  56.1 -149.2   2.6894   5.4 ------	UNKNOWN
Post-slew image of 15-350 keV band
Time interval of the image:
107.132590 962.693000

# RAcent  DECcent POSerr Theta    Phi  PeakCts   SNR AngSep     Name
#  [deg]    [deg]    ['] [deg]  [deg]                   [']
 60.3509 -60.0300    2.4  27.8  112.4   5.8876   4.8 ------	UNKNOWN
 48.3304 -52.7171    3.3  17.9  111.6   3.3746   3.5 ------	UNKNOWN
312.6231 -66.6092    3.0  52.4  170.4  10.3584   3.9 ------	UNKNOWN
  0.7909 -21.8439    3.4  32.7 -109.5   4.8983   3.4 ------	UNKNOWN
 40.9225  17.4499    2.9  55.6  -31.2  15.8921   4.0 ------	UNKNOWN