Analysis Summary
Notes:
- 1) No attempt has been made to eliminate the non-significant decimal places.
- 2) This batgrbproduct analysis is done using the HEASARC data.
- 3) This batgrbproduct analysis is using the flight position for the mask-weighting calculation.
======================================================================
BAT GRB EVENT DATA PROCESSING REPORT
Process Script Ver: batgrbproduct v2.48
Process Start Time: Fri Nov 11 22:19:55 EST 2022
Host Name: batproc1
Current Working Dir: /local/data/bat1/alien/Swift_3rdBATcatalog/event/batevent_reproc/trigger1037828
======================================================================
Trigger: 01037828 Segment: 000
BAT Trigger Time: 638003657.728 [s; MET]
Trigger Stop: 638003659.776 [s; MET]
UTC: 2021-03-21T07:13:51.023260 [includes UTCF correction]
Where From?: TDRSS position message
BAT
RA: 87.8737930674534 Dec: 70.119331009023 [deg; J2000]
Catalogged Source?: NO
Point Source?: YES
GRB Indicated?: YES [ by BAT flight software ]
Image S/N Ratio: 7.4
Image Trigger?: NO
Rate S/N Ratio: 15.8113883008419 [ if not an image trigger ]
Image S/N Ratio: 7.4
Analysis Position: [ source = BAT ]
RA: 87.8737930674534 Dec: 70.119331009023 [deg; J2000]
Refined Position: [ source = BAT pre-slew burst ]
RA: 87.887028989403 Dec: 70.1093007653767 [deg; J2000]
{ 05h 51m 32.9s , +70d 06' 33.5" }
+/- 1.60469574438332 [arcmin] (estimated 90% radius based on SNR)
+/- 0.565585095547763 [arcmin] (formal 1-sigma fit error)
SNR: 15.4774794435645
Angular difference between the analysis and refined position is 0.659659 arcmin
Partial Coding Fraction: 0.3046875 [ including projection effects ]
Duration
T90: 8.21200001239777 +/- 0.503968260000279
Measured from: -6.74400007724762
to: 1.46799993515015 [s; relative to TRIGTIME]
T50: 5.30399990081787 +/- 1.16413742646997
Measured from: -5.25999999046326
to: 0.0439999103546143 [s; relative to TRIGTIME]
Fluence
Peak Flux (peak 1 second)
Measured from: -6.99200010299683
to: -5.99200010299683 [s; relative to TRIGTIME]
Total Fluence
Measured from: -7
to: 1.83599996566772 [s; relative to TRIGTIME]
Band 1 Band 2 Band 3 Band 4
15-25 25-50 50-100 100-350 keV
Total 0.507032 0.490557 0.197149 0.072296
0.042085 0.043918 0.037830 0.032367 [error]
Peak 0.076752 0.066342 0.057940 0.019342
0.013881 0.015303 0.013668 0.011385 [error]
[ fluence units of on-axis counts / fully illuminated detector ]
======================================================================
====== Table of the duration information =============================
Value tstart tstop
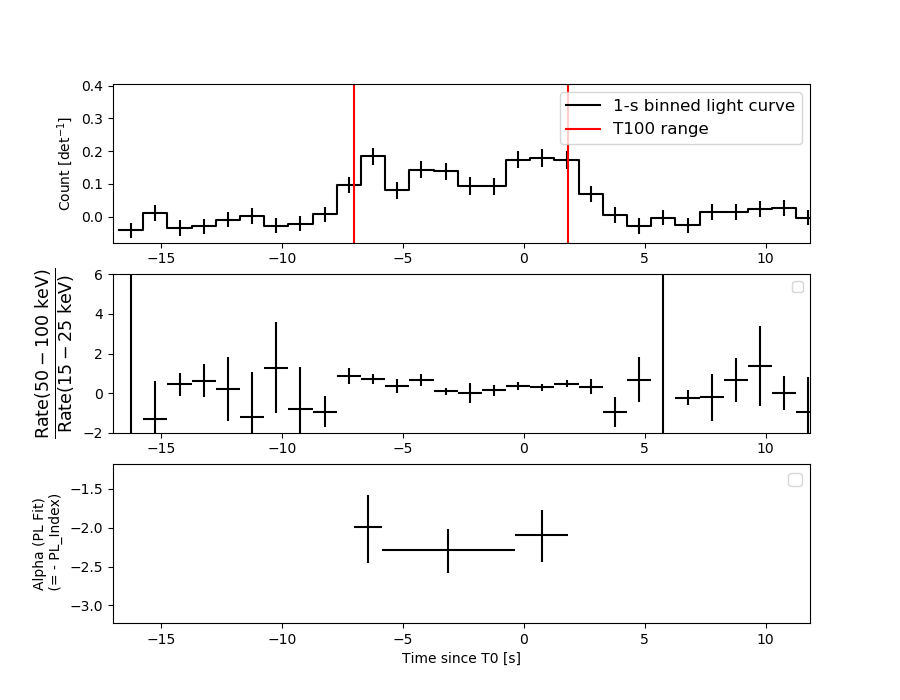
T100 8.836 -7.000 1.836
T90 8.212 -6.744 1.468
T50 5.304 -5.260 0.044
Peak 1.000 -6.992 -5.992
====== Spectral Analysis Summary =====================================
Model : spectral model: simple power-law (PL) and cutoff power-law (CPL)
Ph_index : photon index: E^{Ph_index}
Ph_90err : 90% error of the photon index
Epeak : Epeak in keV
Epeak_90err: 90% error of Epeak
Norm : normalization at 50 keV in both the PL model and CPL model
Nomr_90err : 90% error of the normalization
chi2 : Chi-Squared
dof : degree of freedo
=== Time-averaged spectral analysis ===
(Best model with acceptable fit: N/A)
Model Ph_index Ph_90err_low Ph_90err_hi Epeak Epeak_90err_low Epeak_90err_hi Norm Nomr_90err_low Norm_90err_hi chi2 dof
PL -2.157 -0.204 0.193 - - - 8.07e-03 -1.13e-03 1.10e-03 64.200 57
CPL -2.154 -0.209 0.772 9999.330 N/A N/A 8.08e-03 N/A N/A 64.200 56
=== 1-s peak spectral analysis ===
(Best model with acceptable fit: N/A)
Model Ph_index Ph_90err_low Ph_90err_hi Epeak Epeak_90err_low Epeak_90err_hi Norm Nomr_90err_low Norm_90err_hi chi2 dof
PL -1.975 -0.455 0.401 - - - 1.16e-02 -3.43e-03 3.21e-03 60.810 57
CPL -1.991 -1.175 0.418 9999.270 -1.980 -9999.270 1.15e-02 -4.75e-03 3.69e-02 60.820 56
=== Fluence/Peak Flux Summary ===
Model Band1 Band2 Band3 Band4 Band5 Total
15-25 25-50 50-100 100-350 15-150 15-350 keV
Fluence PL 1.69e-07 2.09e-07 1.87e-07 2.91e-07 6.66e-07 8.57e-07 erg/cm2
90%_error_low -2.29e-08 -2.16e-08 -3.51e-08 -9.39e-08 -8.08e-08 -1.40e-07 erg/cm2
90%_error_hi 2.33e-08 2.15e-08 3.63e-08 1.21e-07 8.26e-08 1.60e-07 erg/cm2
Peak flux PL 7.57e-01 5.76e-01 2.93e-01 2.14e-01 1.73e+00 1.84e+00 ph/cm2/s
90%_error_low -2.22e-01 -1.23e-01 -1.09e-01 -1.22e-01 -3.64e-01 -3.99e-01 ph/cm2/s
90%_error_hi 2.30e-01 1.23e-01 1.12e-01 1.91e-01 3.64e-01 4.02e-01 ph/cm2/s
Fluence CPL 1.68e-07 2.14e-07 1.83e-07 1.74e-07 6.48e-07 7.45e-07 erg/cm2
90%_error_low -2.10e-08 -2.21e-08 -5.29e-08 -1.50e-07 -1.12e-07 -2.03e-07 erg/cm2
90%_error_hi 2.07e-08 3.40e-08 4.00e-08 2.68e-07 9.53e-08 3.25e-07 erg/cm2
Peak flux CPL 7.60e-01 5.62e-01 2.89e-01 2.45e-01 1.71e+00 1.83e+00 ph/cm2/s
90%_error_low -2.65e-01 -1.80e-01 -1.06e-01 -1.25e-01 -5.84e-01 -6.32e-01 ph/cm2/s
90%_error_hi 2.29e-01 1.30e-01 6.61e-02 5.15e-02 3.85e-01 4.23e-01 ph/cm2/s
======================================================================
Image
Pre-slew 15.0-350.0 keV image (Event data)
#   RAcent    DECcent   POSerr    Theta     Phi              Peak Cts       SNR   Name
   87.8870    70.1093   0.0124    35.0397  -109.5671         1.2893336     15.477 TRIG_01037828

Foreground time interval of the image:
 -7.000   1.836 (delta_t =   8.836 [sec])
Background time interval of the image:
-239.728  -7.000 (delta_t = 232.728 [sec])
Light Curves
Note: The mask-weighted lightcurves have units of either count/det or counts/sec/det, where a det is 0.4 x 0.4 = 0.16 sq cm.
Full-time range; 1 s binning
Other quick-look light curves:
- 64 ms binning (zoomed)
- 16 ms binning (zoomed)
- 8 ms binning (zoomed)
- 2 ms binning (zoomed)
- SN=5 or 10 s binning (full-time range)
- Raw light curve
Spectra
- 64 ms binning (zoomed)
- 16 ms binning (zoomed)
- 8 ms binning (zoomed)
- 2 ms binning (zoomed)
- SN=5 or 10 s binning (full-time range)
- Raw light curve
Spectra
Notes:
- 1) The fitting includes the systematic errors.
- 2) When the burst includes telescope slew time periods, the fitting uses an average response file made from multiple 5-s response files through out the slew time plus single time preiod for the non-slew times, and weighted by the total counts in the corresponding time period using addrmf. An average response file is needed becuase a spectral fit using the pre-slew DRM will introduce some errors in both a spectral shape and a normalization if the PHA file contains a lot of the slew/post-slew time interval.
- 3) For fits to more complicated models (e.g. a power-law over a cutoff power-law), the BAT team has decided to require a chi-square improvement of more than 6 for each extra dof.
Time averaged spectrum fit using the average DRM
Power-law model
Time interval is from   -7.000 sec. to    1.836 sec.

Spectral model in power-law:
------------------------------------------------------------
Parameters  : value       lower 90%   higher 90%
Photon index: -2.15708     ( -0.204151   0.192862 )
Norm@50keV  : 8.06551E-03    ( -0.00112619   0.00110155 )
------------------------------------------------------------
#Fit statistic  : Chi-Squared                   64.20     using 59 bins.
 Reduced chi-squared = 1.12632
# Null hypothesis probability of 2.39e-01 with 57 degrees of freedom

Photon flux (15-150 keV)    in 8.836 sec: 1.30598 ( -0.13084  0.13086 ) ph/cm2/s
Energy fluence (15-150 keV)             : 6.66416e-07 ( -8.08237e-08  8.26248e-08 ) ergs/cm2
Cutoff power-law model

Time interval is from   -7.000 sec. to    1.836 sec.
Spectral model in the cutoff power-law:
------------------------------------------------------------
Parameters  : value       lower 90%   higher 90%
Photon index: -2.15433     ( -0.208426   0.772193 )
Epeak [keV] : 9999.33      (   )
Norm@50keV  : 8.08362E-03    (     )
------------------------------------------------------------
#Fit statistic  : Chi-Squared                   64.20     using 59 bins.
 Reduced chi-squared = 1.14643
# Null hypothesis probability of 2.11e-01 with 56 degrees of freedom

Photon flux (15-150 keV)    in 8.836 sec: 1.30554 ( -0.13059  0.13064 ) ph/cm2/s
Energy fluence (15-150 keV)             : 6.47673e-07 ( -1.12313e-07  9.52706e-08 ) ergs/cm2
1-s peak spectrum fit
Power-law model
Time interval is from   -6.992 sec. to   -5.992 sec.

Spectral model in power-law:
------------------------------------------------------------
Parameters  : value       lower 90%   higher 90%
Photon index: -1.97529     ( -0.455379   0.400599 )
Norm@50keV  : 1.16335E-02    ( -0.00343291   0.00320998 )
------------------------------------------------------------
#Fit statistic  : Chi-Squared                   60.81     using 59 bins.
 Reduced chi-squared = 1.06684
# Null hypothesis probability of 3.40e-01 with 57 degrees of freedom

Photon flux (15-150 keV)    in 1 sec: 1.72562 ( -0.36442  0.36441 ) ph/cm2/s
Energy fluence (15-150 keV)             : 1.07177e-07 ( -2.85612e-08  2.97377e-08 ) ergs/cm2
Cutoff power-law model

Time interval is from   -6.992 sec. to   -5.992 sec.
Spectral model in the cutoff power-law:
------------------------------------------------------------
Parameters  : value       lower 90%   higher 90%
Photon index: -2.04459     ( -1.17542   0.417496 )
Epeak [keV] : 22.2293      ( -2.06256 -9999.35 )
Norm@50keV  : 1.03364E-02    ( -0.00355678   0.0381089 )
------------------------------------------------------------
#Fit statistic  : Chi-Squared                   60.69     using 59 bins.
 Reduced chi-squared = 1.08375
# Null hypothesis probability of 3.11e-01 with 56 degrees of freedom

Photon flux (15-150 keV)    in 1 sec: 1.70572 ( -0.58403  0.38548 ) ph/cm2/s
Energy fluence (15-150 keV)             : 0 ( 0  0 ) ergs/cm2
Time-resolved spectra
Distribution
T90 vs. Hardness ratio plot
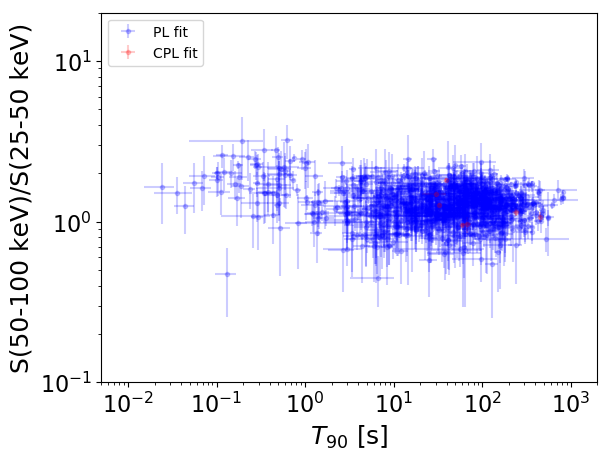
T90                                   = N/A sec.
Hardness ratio (energy fluence ratio) = N/A
S(15-50 keV) vs. S(50-150 keV) plot
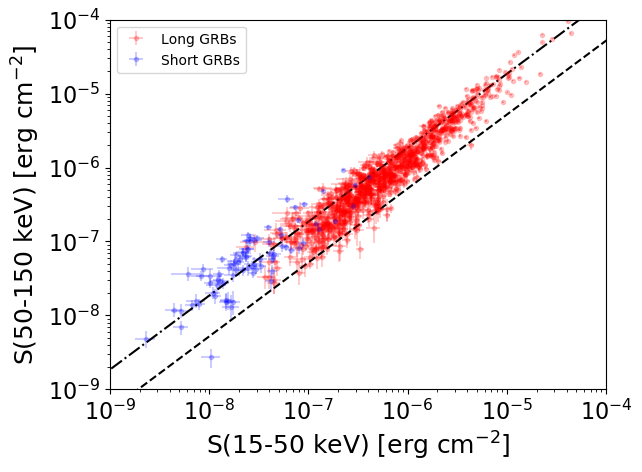
S(15-50 keV)  = N/A
S(50-150 keV) = N/A
The dash-dotted line and the dashed line traces the fluences calculated from the Band function with Epeak = 15 and 150 keV, respectively. Both lines assume a canonical values of alpha = -1 and beta = -2.5.
Mask shadow pattern
IMX = -2.348523842962926E-01, IMY = 6.607430845806622E-01
Spacecraft aspect plot
Bright source in the pre-burst/pre-slew/post-slew images
Pre-burst image of 15-350 keV band
Time interval of the image:
-239.728000 -7.000000

# RAcent  DECcent POSerr Theta    Phi  PeakCts   SNR AngSep     Name
#  [deg]    [deg]    ['] [deg]  [deg]                   [']
230.5111  28.9278    3.2  55.9   10.8   6.2029   3.6 ------	UNKNOWN
245.9069  39.4030    3.3  57.3   -8.9   4.5404   3.5 ------	UNKNOWN
249.8232  63.7972    2.4  43.9  -35.7   2.6950   4.7 ------	UNKNOWN
253.7292  77.1714    2.8  39.2  -54.8   2.2426   4.2 ------	UNKNOWN
Pre-slew background subtracted image of 15-350 keV band
Time interval of the image:
-7.000000 1.836000

# RAcent  DECcent POSerr Theta    Phi  PeakCts   SNR AngSep     Name
#  [deg]    [deg]    ['] [deg]  [deg]                   [']
132.7744  51.9367    2.5  16.3 -159.8   0.1816   4.5 ------	UNKNOWN
 87.8870  70.1093    0.7  35.0 -109.6   1.2891  15.5 ------	UNKNOWN
Post-slew image of 15-350 keV band
Time interval of the image: