Analysis Summary
Notes:
- 1) No attempt has been made to eliminate the non-significant decimal places.
- 2) This batgrbproduct analysis is done using the HEASARC data.
- 3) This batgrbproduct analysis is using the flight position for the mask-weighting calculation.
======================================================================
BAT GRB EVENT DATA PROCESSING REPORT
Process Script Ver: batgrbproduct v2.48
Process Start Time: Fri Jul 29 23:44:07 EDT 2022
Host Name: batproc1
Current Working Dir: /local/data/bat1/alien/Swift_3rdBATcatalog/event/batevent_reproc/trigger1038247
======================================================================
Trigger: 01038247 Segment: 000
BAT Trigger Time: 638229765.184 [s; MET]
Trigger Stop: 638229765.248 [s; MET]
UTC: 2021-03-23T22:02:18.464260 [includes UTCF correction]
Where From?: (*SHORT BURST*) TDRSS scaled map message
BAT
RA: 317.952404831532 Dec: 25.3779613350552 [deg; J2000]
Catalogged Source?: NO
Point Source?: YES
GRB Indicated?: YES [ by BAT flight software ]
Image S/N Ratio: 11.41
Image Trigger?: NO
Rate S/N Ratio: 41.1703777004778 [ if not an image trigger ]
Image S/N Ratio: 11.41
Analysis Position: [ source = BAT ]
RA: 317.952404831532 Dec: 25.3779613350552 [deg; J2000]
Refined Position: [ source = BAT pre-slew burst ]
RA: 317.944940772893 Dec: 25.3523417898211 [deg; J2000]
{ 21h 11m 46.8s , +25d 21' 08.4" }
+/- 1.44634869399025 [arcmin] (estimated 90% radius based on SNR)
+/- 0.603476226560251 [arcmin] (formal 1-sigma fit error)
SNR: 17.9538230409482
Angular difference between the analysis and refined position is 1.589546 arcmin
Partial Coding Fraction: 0.765625 [ including projection effects ]
Duration
T90: 1.12000000476837 +/- 0.322893082552845
Measured from: -0.0720000267028809
to: 1.04799997806549 [s; relative to TRIGTIME]
T50: 0.247999906539917 +/- 0.109178796885355
Measured from: 0.00800001621246338
to: 0.25599992275238 [s; relative to TRIGTIME]
Fluence
Peak Flux (peak 1 second)
Measured from: -0.0959999561309814
to: 0.904000043869019 [s; relative to TRIGTIME]
Total Fluence
Measured from: -0.0920000076293945
to: 1.25600004196167 [s; relative to TRIGTIME]
Band 1 Band 2 Band 3 Band 4
15-25 25-50 50-100 100-350 keV
Total 0.105003 0.140407 0.110229 0.028012
0.011194 0.011800 0.011049 0.009198 [error]
Peak 0.096267 0.127363 0.107437 0.026438
0.010015 0.010766 0.010214 0.008364 [error]
[ fluence units of on-axis counts / fully illuminated detector ]
======================================================================
====== Table of the duration information =============================
Value tstart tstop
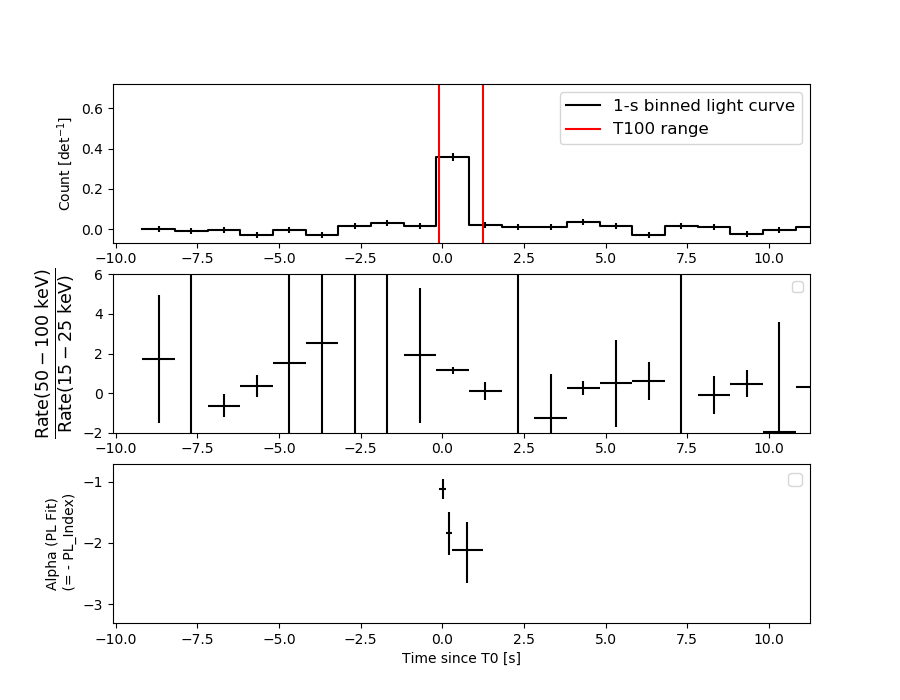
T100 1.348 -0.092 1.256
T90 1.120 -0.072 1.048
T50 0.248 0.008 0.256
Peak 1.000 -0.096 0.904
====== Spectral Analysis Summary =====================================
Model : spectral model: simple power-law (PL) and cutoff power-law (CPL)
Ph_index : photon index: E^{Ph_index}
Ph_90err : 90% error of the photon index
Epeak : Epeak in keV
Epeak_90err: 90% error of Epeak
Norm : normalization at 50 keV in both the PL model and CPL model
Nomr_90err : 90% error of the normalization
chi2 : Chi-Squared
dof : degree of freedo
=== Time-averaged spectral analysis ===
(Best model with acceptable fit: N/A)
Model Ph_index Ph_90err_low Ph_90err_hi Epeak Epeak_90err_low Epeak_90err_hi Norm Nomr_90err_low Norm_90err_hi chi2 dof
PL -1.456 -0.167 0.166 - - - 1.90e-02 -1.80e-03 1.79e-03 53.630 57
CPL -1.397 -0.874 0.568 511.583 -511.583 -511.583 2.03e-02 -6.88e-03 1.80e-02 53.680 56
=== 1-s peak spectral analysis ===
(Best model with acceptable fit: N/A)
Model Ph_index Ph_90err_low Ph_90err_hi Epeak Epeak_90err_low Epeak_90err_hi Norm Nomr_90err_low Norm_90err_hi chi2 dof
PL -1.393 -0.165 0.164 - - - 2.42e-02 -2.20e-03 2.19e-03 55.520 57
CPL -1.358 -0.200 0.449 959.621 -959.621 -959.621 2.52e-02 -3.13e-03 1.25e-03 55.620 56
=== Fluence/Peak Flux Summary ===
Model Band1 Band2 Band3 Band4 Band5 Total
15-25 25-50 50-100 100-350 15-150 15-350 keV
Fluence PL 3.13e-08 5.91e-08 8.62e-08 2.68e-07 2.44e-07 4.45e-07 erg/cm2
90%_error_low -4.89e-09 -5.69e-09 -1.08e-08 -6.60e-08 -2.58e-08 -7.54e-08 erg/cm2
90%_error_hi 5.08e-09 5.65e-09 1.07e-08 7.97e-08 2.61e-08 8.67e-08 erg/cm2
Peak flux PL 8.99e-01 9.64e-01 7.34e-01 9.11e-01 2.94e+00 3.51e+00 ph/cm2/s
90%_error_low -1.43e-01 -9.45e-02 -8.50e-02 -2.05e-01 -2.66e-01 -3.25e-01 ph/cm2/s
90%_error_hi 1.50e-01 9.34e-02 8.41e-02 2.40e-01 2.66e-01 3.29e-01 ph/cm2/s
Fluence CPL 3.14e-08 5.90e-08 8.61e-08 2.73e-07 2.45e-07 4.51e-07 erg/cm2
90%_error_low -5.21e-09 -5.53e-09 -1.08e-08 -1.69e-07 -2.89e-08 -1.79e-07 erg/cm2
90%_error_hi 5.66e-09 6.93e-09 1.16e-08 3.89e-08 2.15e-08 4.15e-08 erg/cm2
Peak flux CPL 7.12e-01 4.54e-01 1.96e-01 1.40e-01 1.42e+00 1.49e+00 ph/cm2/s
90%_error_low -1.99e-01 -1.28e-01 -8.43e-02 2.08e-02 -4.02e-01 -4.22e-01 ph/cm2/s
90%_error_hi 2.03e-01 1.50e-01 1.39e-01 1.45e-01 4.46e-01 5.39e-01 ph/cm2/s
======================================================================
Image
Pre-slew 15.0-350.0 keV image (Event data)
#   RAcent    DECcent   POSerr    Theta     Phi              Peak Cts       SNR   Name
  317.9449    25.3523   0.0107    30.3162   -22.4353         0.4002490     17.954 TRIG_01038247

Foreground time interval of the image:
 -0.092   1.256 (delta_t =   1.348 [sec])
Background time interval of the image:
-19.083  -0.092 (delta_t =  18.991 [sec])
Light Curves
Note: The mask-weighted lightcurves have units of either count/det or counts/sec/det, where a det is 0.4 x 0.4 = 0.16 sq cm.
Full-time range; 1 s binning
Other quick-look light curves:
- 64 ms binning (zoomed)
- 16 ms binning (zoomed)
- 8 ms binning (zoomed)
- 2 ms binning (zoomed)
- SN=5 or 10 s binning (full-time range)
- Raw light curve
Spectra
- 64 ms binning (zoomed)
- 16 ms binning (zoomed)
- 8 ms binning (zoomed)
- 2 ms binning (zoomed)
- SN=5 or 10 s binning (full-time range)
- Raw light curve
Spectra
Notes:
- 1) The fitting includes the systematic errors.
- 2) When the burst includes telescope slew time periods, the fitting uses an average response file made from multiple 5-s response files through out the slew time plus single time preiod for the non-slew times, and weighted by the total counts in the corresponding time period using addrmf. An average response file is needed becuase a spectral fit using the pre-slew DRM will introduce some errors in both a spectral shape and a normalization if the PHA file contains a lot of the slew/post-slew time interval.
- 3) For fits to more complicated models (e.g. a power-law over a cutoff power-law), the BAT team has decided to require a chi-square improvement of more than 6 for each extra dof.
Time averaged spectrum fit using the average DRM
Power-law model

Time interval is from   -0.092 sec. to    1.256 sec.

Spectral model in power-law:
------------------------------------------------------------
Parameters  : value       lower 90%   higher 90%
Photon index: -1.45562     ( -0.166856   0.165649 )
Norm@50keV  : 1.89549E-02    ( -0.00179892   0.00178719 )
------------------------------------------------------------
#Fit statistic  : Chi-Squared                   53.63     using 59 bins.
 Reduced chi-squared = 0.940877
# Null hypothesis probability of 6.02e-01 with 57 degrees of freedom

Photon flux (15-150 keV)    in 1.348 sec: 2.33926 ( -0.21723  0.2175 ) ph/cm2/s
Energy fluence (15-150 keV)             : 2.44287e-07 ( -2.5793e-08  2.61085e-08 ) ergs/cm2
Cutoff power-law model
Time interval is from   -0.092 sec. to    1.256 sec.
Spectral model in the cutoff power-law:
------------------------------------------------------------
Parameters  : value       lower 90%   higher 90%
Photon index: -1.45289     ( -0.868206   0.574258 )
Epeak [keV] : 9998.38      ( -9998.49 -9998.49 )
Norm@50keV  : 1.90168E-02    ( -0.00558584   0.0193319 )
------------------------------------------------------------
#Fit statistic  : Chi-Squared                   53.63     using 59 bins.
 Reduced chi-squared = 0.957679
# Null hypothesis probability of 5.65e-01 with 56 degrees of freedom

Photon flux (15-150 keV)    in 1.348 sec: 1.51509 ( -0.37074  0.31911 ) ph/cm2/s
Energy fluence (15-150 keV)             : 2.44647e-07 ( -2.88976e-08  2.14498e-08 ) ergs/cm2
1-s peak spectrum fit
Power-law model
Time interval is from   -0.096 sec. to    0.904 sec.

Spectral model in power-law:
------------------------------------------------------------
Parameters  : value       lower 90%   higher 90%
Photon index: -1.39327     ( -0.164686   0.163945 )
Norm@50keV  : 2.41883E-02    ( -0.00220385   0.00219379 )
------------------------------------------------------------
#Fit statistic  : Chi-Squared                   55.52     using 59 bins.
 Reduced chi-squared = 0.974035
# Null hypothesis probability of 5.31e-01 with 57 degrees of freedom

Photon flux (15-150 keV)    in 1 sec: 2.94127 ( -0.26605  0.26642 ) ph/cm2/s
Energy fluence (15-150 keV)             : 2.34078e-07 ( -2.40535e-08  2.43324e-08 ) ergs/cm2
Cutoff power-law model

Time interval is from   -0.096 sec. to    0.904 sec.
Spectral model in the cutoff power-law:
------------------------------------------------------------
Parameters  : value       lower 90%   higher 90%
Photon index: -1.39025     ( -0.200291   0.449063 )
Epeak [keV] : 1.00000E+04      ( -10000 -10000 )
Norm@50keV  : 2.42752E-02    ( -0.00221766   0.00215589 )
------------------------------------------------------------
#Fit statistic  : Chi-Squared                   55.53     using 59 bins.
 Reduced chi-squared = 0.991607
# Null hypothesis probability of 4.93e-01 with 56 degrees of freedom

Photon flux (15-150 keV)    in 1 sec: 1.42409 ( -0.40211  0.44632 ) ph/cm2/s
Energy fluence (15-150 keV)             : 2.36331e-07 ( -2.68764e-08  2.17702e-08 ) ergs/cm2
Time-resolved spectra
Distribution
T90 vs. Hardness ratio plot
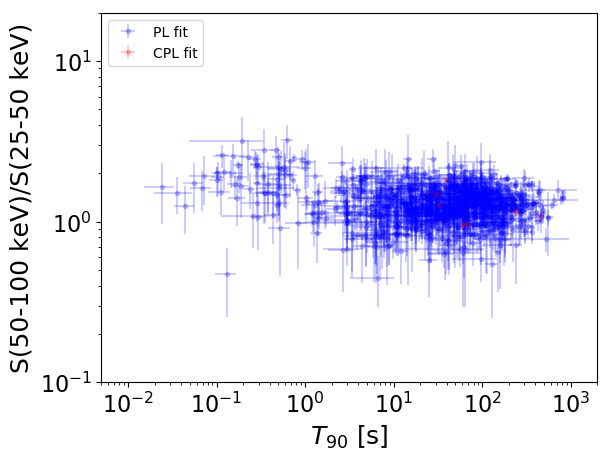
T90                                   = N/A sec.
Hardness ratio (energy fluence ratio) = N/A
S(15-50 keV) vs. S(50-150 keV) plot
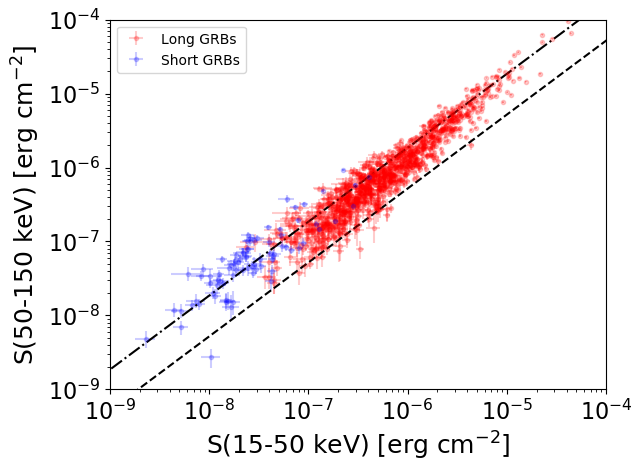
S(15-50 keV)  = N/A
S(50-150 keV) = N/A
The dash-dotted line and the dashed line traces the fluences calculated from the Band function with Epeak = 15 and 150 keV, respectively. Both lines assume a canonical values of alpha = -1 and beta = -2.5.
Mask shadow pattern
IMX = 5.404735181931878E-01, IMY = 2.231571670947622E-01
Spacecraft aspect plot
Bright source in the pre-burst/pre-slew/post-slew images
Pre-burst image of 15-350 keV band
Time interval of the image:
-19.083400 -0.092000

# RAcent  DECcent POSerr Theta    Phi  PeakCts   SNR AngSep     Name
#  [deg]    [deg]    ['] [deg]  [deg]                   [']
288.7594  10.9292   31.4  53.7    9.6   0.0798   0.4    2.5	GRS 1915+105
299.5880  35.3590    3.2  27.7   16.3   0.2406   3.6    9.4	Cyg X-1
307.8575  40.8811    0.0  19.4   11.7   0.2149   3.8   12.2	Cyg X-3
326.2987  38.4315    5.4  16.3  -35.6   0.1248   2.1    8.9	Cyg X-2
283.0477  13.5075    2.4  54.1   17.2   1.3120   4.8 ------	UNKNOWN
306.2217  -1.8534    2.2  59.4  -15.4   1.9746   5.2 ------	UNKNOWN
 62.9687  41.4907    2.6  59.6 -161.4   1.7531   4.5 ------	UNKNOWN
Pre-slew background subtracted image of 15-350 keV band
Time interval of the image:
-0.092000 1.256000

# RAcent  DECcent POSerr Theta    Phi  PeakCts   SNR AngSep     Name
#  [deg]    [deg]    ['] [deg]  [deg]                   [']
288.7847  11.0568    8.5  53.6    9.7   0.1004   1.3    6.7	GRS 1915+105
299.5374  35.3408    4.6  27.7   16.4  -0.0558  -2.5    8.7	Cyg X-1
308.1924  40.7536    0.0  19.3   10.9   0.0081   0.4   12.5	Cyg X-3
325.9519  38.2698    4.6  16.5  -34.7   0.0458   2.5   10.8	Cyg X-2
317.9450  25.3524    0.6  30.3  -22.4   0.4002  18.0 ------	UNKNOWN
 57.2925  38.0522    1.8  59.2 -154.9   0.7243   6.5 ------	UNKNOWN
Post-slew image of 15-350 keV band
Time interval of the image:
69.316600 962.859600

# RAcent  DECcent POSerr Theta    Phi  PeakCts   SNR AngSep     Name
#  [deg]    [deg]    ['] [deg]  [deg]                   [']
288.9129  11.0574    6.6  31.0   46.5   2.4087   1.7    9.5	GRS 1915+105
299.6121  35.1663    2.4  18.6  104.8   5.0177   4.9    2.4	Cyg X-1
308.1315  40.9070    3.2  17.6  133.4   3.2739   3.6    2.9	Cyg X-3
326.1594  38.2187    5.9  14.6 -174.9   1.7566   2.0    6.2	Cyg X-2
280.7769  22.2548    3.0  34.0   71.4   7.3121   3.9 ------	UNKNOWN
310.6977  23.0244    2.7   7.0   50.7   3.2004   4.4 ------	UNKNOWN
302.4285  -3.6034    2.5  32.7    8.4   4.7651   4.7 ------	UNKNOWN
 19.1401  43.7174    3.4  52.3 -148.2   8.9097   3.4 ------	UNKNOWN