Analysis Summary
Notes:
- 1) No attempt has been made to eliminate the non-significant decimal places.
- 2) This batgrbproduct analysis is done using the HEASARC data.
- 3) This batgrbproduct analysis is using the flight position for the mask-weighting calculation.
======================================================================
                  BAT GRB EVENT DATA PROCESSING REPORT
    Process Script Ver: batgrbproduct v2.48
    Process Start Time: Fri Jul 29 23:40:28 EDT 2022
             Host Name: batproc1
   Current Working Dir: /local/data/bat1/alien/Swift_3rdBATcatalog/event/batevent_reproc/trigger1040345
======================================================================

  Trigger: 01040345      Segment: 000

  BAT Trigger Time: 639131260.736   [s; MET]
      Trigger Stop: 639131261.76   [s; MET]
               UTC: 2021-04-03T08:27:13.956380    [includes UTCF correction]
       Where From?: TDRSS position message

  BAT
    RA: 2.76672918535528   Dec: -32.9992877873351  [deg; J2000]

     Catalogged Source?: NO
     Point Source?:      YES
     GRB Indicated?:     YES    [ by BAT flight software ]
     Image S/N Ratio:    7.52
     Image Trigger?:     NO
     Rate S/N Ratio:     10.5830052442584  [ if not an image trigger ]
     Image S/N Ratio:    7.52

  Analysis Position:   [ source = BAT ]
    RA: 2.76672918535528   Dec: -32.9992877873351  [deg; J2000]

  Refined Position:   [ source = BAT pre-slew burst ]
    RA: 2.77825676056147   Dec: -33.0023921000544  [deg; J2000]
        { 00h 11m 06.8s , -33d 00' 08.6" }
         +/- 1.14896565159282 [arcmin] (estimated 90% radius based on SNR)
         +/- 0.408885577260038 [arcmin] (formal 1-sigma fit error)
    SNR: 24.9439632313756

  Angular difference between the analysis and refined position is 0.609235 arcmin

  Partial Coding Fraction: 0.8046875    [ including projection effects ]

  Duration
     T90: 167.659999966621 +/- 7.82184770492931
        Measured from: -35.8799999952316
                   to: 131.77999997139     [s; relative to TRIGTIME]
     T50: 98.6840000152588 +/- 3.79194296832595
        Measured from: 0.972000002861023
                   to: 99.6560000181198     [s; relative to TRIGTIME]


  Fluence
     Peak Flux  (peak 1 second)
        Measured from: 0.368000030517578
                   to: 1.36800003051758     [s; relative to TRIGTIME]
     Total Fluence
        Measured from: -41.5119999647141
                   to: 137.180000066757     [s; relative to TRIGTIME]

             Band 1     Band 2     Band 3     Band 4
              15-25      25-50     50-100    100-350     keV
 Total     2.264412   2.516782   0.961812   0.047284
           0.084976   0.087598   0.075913   0.066699 [error]
 Peak      0.044735   0.049202   0.031357   0.004345
           0.006820   0.007077   0.006232   0.004860 [error]

     [ fluence units of on-axis counts / fully illuminated detector ]

======================================================================


====== Table of the duration information =============================

        Value   tstart    tstop
T100  178.692  -41.512  137.180
T90   167.660  -35.880  131.780
T50    98.684    0.972   99.656
Peak    1.000    0.368    1.368


====== Spectral Analysis Summary =====================================

Model      : spectral model: simple power-law (PL) and cutoff power-law (CPL)
Ph_index   : photon index: E^{Ph_index}
Ph_90err   : 90% error of the photon index
Epeak      : Epeak in keV
Epeak_90err: 90% error of Epeak
Norm       : normalization at 50 keV in both the PL model and CPL model
Nomr_90err : 90% error of the normalization
chi2       : Chi-Squared
dof        : degree of freedo

=== Time-averaged spectral analysis ===
(Best model with acceptable fit: N/A)

Model Ph_index Ph_90err_low Ph_90err_hi  Epeak  Epeak_90err_low  Epeak_90err_hi  Norm       Nomr_90err_low    Norm_90err_hi    chi2    dof
PL      -2.139    -0.098      0.095       -           -               -         1.81e-03     -1.10e-04          1.09e-04      74.240   57
CPL     -0.964    -0.487      0.547       36.907      -5.629         4.359      8.30e-03     -3.86e-03          8.60e-03      54.470   56


=== 1-s peak spectral analysis ===
(Best model with acceptable fit: N/A)

Model Ph_index Ph_90err_low Ph_90err_hi  Epeak  Epeak_90err_low  Epeak_90err_hi  Norm       Nomr_90err_low    Norm_90err_hi    chi2    dof
PL      -1.694     -0.272     0.256       -           -               -         7.91e-03     -1.40e-03          1.37e-03      48.530   57
CPL     -0.385     -1.249     1.836       56.063     -13.189       152.947      4.08e-02     -4.08e-02          3.57e-01      45.310   56


=== Fluence/Peak Flux Summary ===

              Model    Band1     Band2     Band3     Band4     Band5     Total
                       15-25     25-50    50-100    100-350    15-150    15-350    keV
Fluence         PL   7.55e-07  9.42e-07  8.56e-07  1.35e-06  3.02e-06  3.90e-06   erg/cm2
      90%_error_low -5.46e-08 -4.51e-08 -7.18e-08 -2.16e-07 -1.63e-07 -2.95e-07   erg/cm2
      90%_error_hi   5.56e-08  4.51e-08  7.27e-08  2.43e-07  1.64e-07  3.14e-07   erg/cm2
Peak flux       PL   3.92e-01  3.52e-01  2.18e-01  2.05e-01  1.05e+00  1.17e+00   ph/cm2/s
      90%_error_low -8.86e-02 -5.53e-02 -4.88e-02 -7.69e-02 -1.64e-01 -1.86e-01   ph/cm2/s
      90%_error_hi   9.31e-02  5.52e-02  4.88e-02  9.94e-02  1.64e-01  1.87e-01   ph/cm2/s

Fluence        CPL   6.58e-07  1.05e-06  7.94e-07  2.65e-07  2.70e-06  2.76e-06   erg/cm2
      90%_error_low -6.62e-08 -6.07e-08 -9.08e-08 -1.19e-07 -1.86e-07 -2.23e-07   erg/cm2
      90%_error_hi   6.70e-08  6.16e-08  8.81e-08  2.12e-07  1.94e-07  2.85e-07   erg/cm2
Peak flux      CPL   3.30e-01  4.05e-01  2.28e-01  5.49e-02  1.01e+00  1.02e+00   ph/cm2/s
      90%_error_low -1.12e-01 -7.51e-02 -5.99e-02 -5.49e-02 -1.71e-01 -1.79e-01   ph/cm2/s
      90%_error_hi   1.12e-01  8.01e-02  5.85e-02  1.39e-01  1.70e-01  1.98e-01   ph/cm2/s

======================================================================
Image
Pre-slew 15.0-350.0 keV image (Event data)
#   RAcent    DECcent   POSerr    Theta     Phi              Peak Cts       SNR   Name
    2.7783   -33.0024   0.0077    20.1553  -113.4665         5.4642150     24.944 TRIG_01040345

Foreground time interval of the image:
-41.512 137.180 (delta_t = 178.692 [sec])
Background time interval of the image:
-239.736 -41.512 (delta_t = 198.224 [sec])
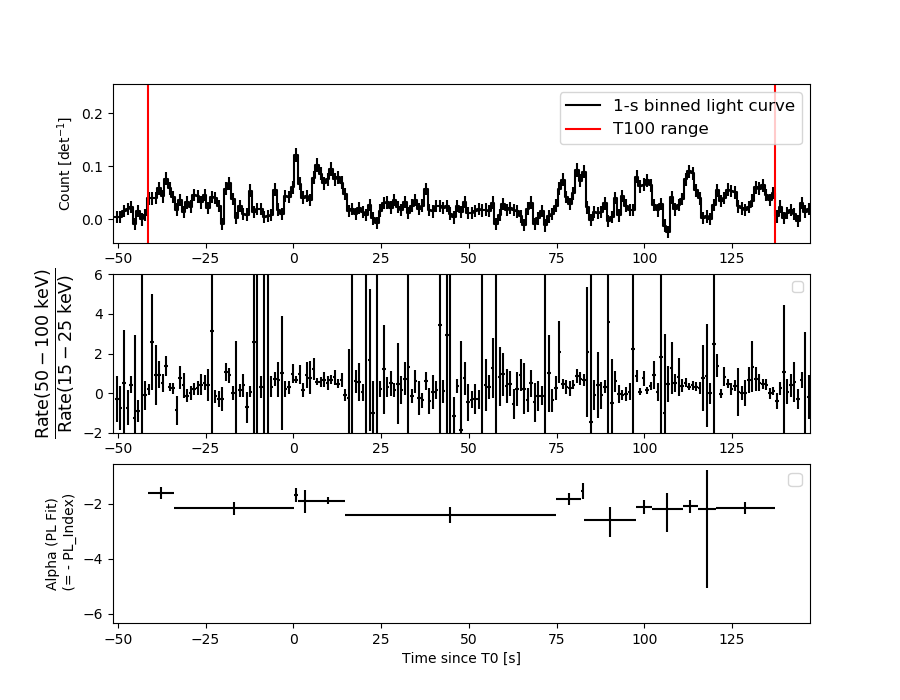
Light Curves
Note: The mask-weighted lightcurves have units of either count/det or counts/sec/det, where a det is 0.4 x 0.4 = 0.16 sq cm.
Full-time range; 1 s binning
Other quick-look light curves:
- 64 ms binning (zoomed)
- 16 ms binning (zoomed)
- 8 ms binning (zoomed)
- 2 ms binning (zoomed)
- SN=5 or 10 s binning (full-time range)
- Raw light curve
Spectra
- 64 ms binning (zoomed)
- 16 ms binning (zoomed)
- 8 ms binning (zoomed)
- 2 ms binning (zoomed)
- SN=5 or 10 s binning (full-time range)
- Raw light curve
Spectra
Notes:
- 1) The fitting includes the systematic errors.
- 2) When the burst includes telescope slew time periods, the fitting uses an average response file made from multiple 5-s response files through out the slew time plus single time preiod for the non-slew times, and weighted by the total counts in the corresponding time period using addrmf. An average response file is needed becuase a spectral fit using the pre-slew DRM will introduce some errors in both a spectral shape and a normalization if the PHA file contains a lot of the slew/post-slew time interval.
- 3) For fits to more complicated models (e.g. a power-law over a cutoff power-law), the BAT team has decided to require a chi-square improvement of more than 6 for each extra dof.
Time averaged spectrum fit using the average DRM
Power-law model

Time interval is from  -41.512 sec. to  137.180 sec.

Spectral model in power-law:
------------------------------------------------------------
Parameters  : value       lower 90%   higher 90%
Photon index: -2.13894     ( -0.0979627   0.0954955 )
Norm@50keV  : 1.80855E-03    ( -0.000109565   0.000108536 )
------------------------------------------------------------
#Fit statistic  : Chi-Squared                   74.24     using 59 bins.
 Reduced chi-squared = 1.30246
# Null hypothesis probability of 6.21e-02 with 57 degrees of freedom

Photon flux (15-150 keV)    in 178.7 sec: 0.290152 ( -0.014311  0.014336 ) ph/cm2/s
Energy fluence (15-150 keV)             : 3.01567e-06 ( -1.62849e-07  1.64458e-07 ) ergs/cm2
Cutoff power-law model

Time interval is from  -41.512 sec. to  137.180 sec.
Spectral model in the cutoff power-law:
------------------------------------------------------------
Parameters  : value       lower 90%   higher 90%
Photon index: -0.964136     ( -0.486828   0.547066 )
Epeak [keV] : 36.9070      ( -5.62927 4.35887 )
Norm@50keV  : 8.30175E-03    ( -0.00385535   0.00860376 )
------------------------------------------------------------
#Fit statistic  : Chi-Squared                   54.47     using 59 bins.
 Reduced chi-squared = 0.972679
# Null hypothesis probability of 5.33e-01 with 56 degrees of freedom

Photon flux (15-150 keV)    in 178.7 sec: 0.271190 ( -0.015865  0.015938 ) ph/cm2/s
Energy fluence (15-150 keV)             : 2.69565e-06 ( -1.85591e-07  1.94324e-07 ) ergs/cm2
1-s peak spectrum fit
Power-law model

Time interval is from    0.368 sec. to    1.368 sec.

Spectral model in power-law:
------------------------------------------------------------
Parameters  : value       lower 90%   higher 90%
Photon index: -1.69418     ( -0.271593   0.256013 )
Norm@50keV  : 7.91094E-03    ( -0.00139898   0.00136814 )
------------------------------------------------------------
#Fit statistic  : Chi-Squared                   48.53     using 59 bins.
 Reduced chi-squared = 0.851404
# Null hypothesis probability of 7.80e-01 with 57 degrees of freedom

Photon flux (15-150 keV)    in 1 sec: 1.04858 ( -0.163681  0.16371 ) ph/cm2/s
Energy fluence (15-150 keV)             : 7.32909e-08 ( -1.34029e-08  1.36852e-08 ) ergs/cm2
Cutoff power-law model

Time interval is from    0.368 sec. to    1.368 sec.
Spectral model in the cutoff power-law:
------------------------------------------------------------
Parameters  : value       lower 90%   higher 90%
Photon index: -0.384593     ( -1.24868   1.83573 )
Epeak [keV] : 56.0632      ( -13.1877 152.948 )
Norm@50keV  : 4.07524E-02    ( -0.0407595   0.357404 )
------------------------------------------------------------
#Fit statistic  : Chi-Squared                   45.31     using 59 bins.
 Reduced chi-squared = 0.809107
# Null hypothesis probability of 8.46e-01 with 56 degrees of freedom

Photon flux (15-150 keV)    in 1 sec: 1.00665 ( -0.170954  0.16977 ) ph/cm2/s
Energy fluence (15-150 keV)             : 6.65426e-08 ( -1.38924e-08  1.50799e-08 ) ergs/cm2
Time-resolved spectra
Distribution
T90 vs. Hardness ratio plot
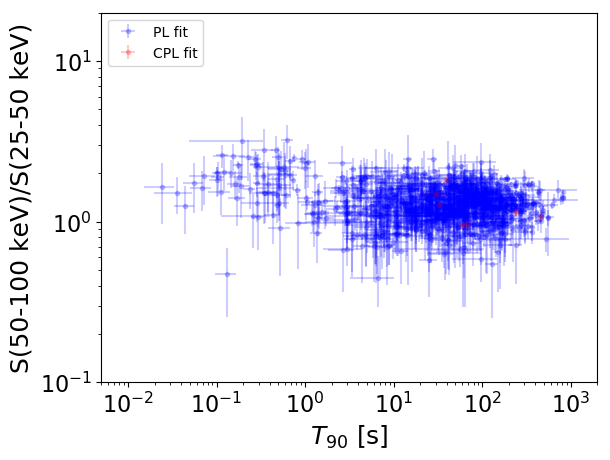
T90                                   = N/A sec.
Hardness ratio (energy fluence ratio) = N/A
S(15-50 keV) vs. S(50-150 keV) plot
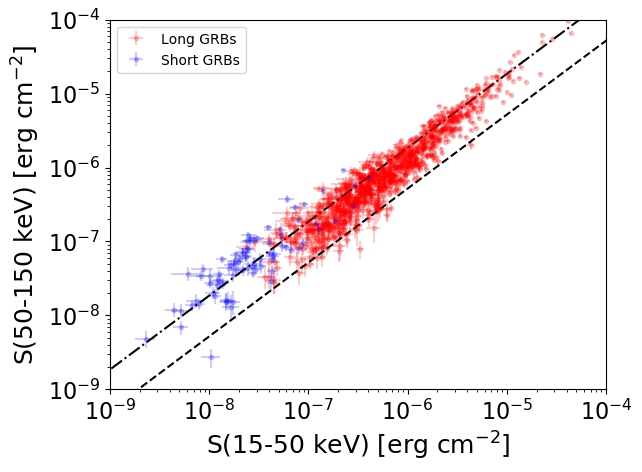
S(15-50 keV)  = N/A
S(50-150 keV) = N/A
The dash-dotted line and the dashed line traces the fluences calculated from the Band function with Epeak = 15 and 150 keV, respectively. Both lines assume a canonical values of alpha = -1 and beta = -2.5.
Mask shadow pattern
IMX = -1.461605609976621E-01, IMY = 3.366851304624006E-01
Spacecraft aspect plot

Bright source in the pre-burst/pre-slew/post-slew images
Pre-burst image of 15-350 keV band
Time interval of the image:
-239.736000 -41.512000

# RAcent  DECcent POSerr Theta    Phi  PeakCts   SNR AngSep     Name
#  [deg]    [deg]    ['] [deg]  [deg]                   [']
 94.3481 -61.4081    3.1  43.0   45.0   1.9623   3.8 ------	UNKNOWN
 26.8542 -69.4599    2.2  18.8   72.6   1.1696   5.1 ------	UNKNOWN
 69.5482 -55.9502    2.5  33.1   29.1   1.2864   4.6 ------	UNKNOWN
 33.9071 -58.6690    2.7  14.1   35.7   0.8063   4.3 ------	UNKNOWN
 83.9040 -28.7338    3.0  57.0    4.7   4.3488   3.8 ------	UNKNOWN
 70.0206 -18.3488    3.1  56.2  -14.9   2.8399   3.7 ------	UNKNOWN
315.4872 -12.7469    2.8  59.6 -161.2   7.5057   4.2 ------	UNKNOWN
319.0764 -10.4510    2.9  59.4 -156.4   5.7685   4.0 ------	UNKNOWN
Pre-slew background subtracted image of 15-350 keV band
Time interval of the image:
-41.512000 137.180000

# RAcent  DECcent POSerr Theta    Phi  PeakCts   SNR AngSep     Name
#  [deg]    [deg]    ['] [deg]  [deg]                   [']
 48.1719 -71.3138    2.0  25.1   62.4   1.4940   5.8 ------	UNKNOWN
  2.7782 -33.0024    0.5  20.2 -113.5   5.4644  24.9 ------	UNKNOWN
 14.9765 -16.5643    2.5  35.6  -85.8   2.1129   4.6 ------	UNKNOWN
Post-slew image of 15-350 keV band
Time interval of the image:
877.464610 944.440700
945.264000 962.364000

# RAcent  DECcent POSerr Theta    Phi  PeakCts   SNR AngSep     Name
#  [deg]    [deg]    ['] [deg]  [deg]                   [']
 83.6262  22.0020    2.4  56.4   -4.0   2.4380   4.8    0.8	Crab