Analysis Summary
Notes:
- 1) No attempt has been made to eliminate the non-significant decimal places.
- 2) This batgrbproduct analysis is done using the HEASARC data.
- 3) This batgrbproduct analysis is using the flight position for the mask-weighting calculation.
======================================================================
BAT GRB EVENT DATA PROCESSING REPORT
Process Script Ver: batgrbproduct v2.48
Process Start Time: Fri Jul 29 23:38:31 EDT 2022
Host Name: batproc1
Current Working Dir: /local/data/bat1/alien/Swift_3rdBATcatalog/event/batevent_reproc/trigger1042113
======================================================================
Trigger: 01042113 Segment: 000
BAT Trigger Time: 639708823.296 [s; MET]
Trigger Stop: 639708823.36 [s; MET]
UTC: 2021-04-10T00:53:16.478000 [includes UTCF correction]
Where From?: (*SHORT BURST*) TDRSS scaled map message
BAT
RA: 269.752937386226 Dec: 45.3707068254686 [deg; J2000]
Catalogged Source?: NO
Point Source?: YES
GRB Indicated?: YES [ by BAT flight software ]
Image S/N Ratio: 7.24
Image Trigger?: NO
Rate S/N Ratio: 58.9915248150105 [ if not an image trigger ]
Image S/N Ratio: 7.24
Analysis Position: [ source = BAT ]
RA: 269.752937386226 Dec: 45.3707068254686 [deg; J2000]
Refined Position: [ source = BAT pre-slew burst ]
RA: 269.740994496425 Dec: 45.358874981224 [deg; J2000]
{ 17h 58m 57.8s , +45d 21' 31.9" }
+/- 0.739746787136268 [arcmin] (estimated 90% radius based on SNR)
+/- 0.278852168624886 [arcmin] (formal 1-sigma fit error)
SNR: 46.7888682640872
Angular difference between the analysis and refined position is 0.870312 arcmin
Partial Coding Fraction: 0.5546875 [ including projection effects ]
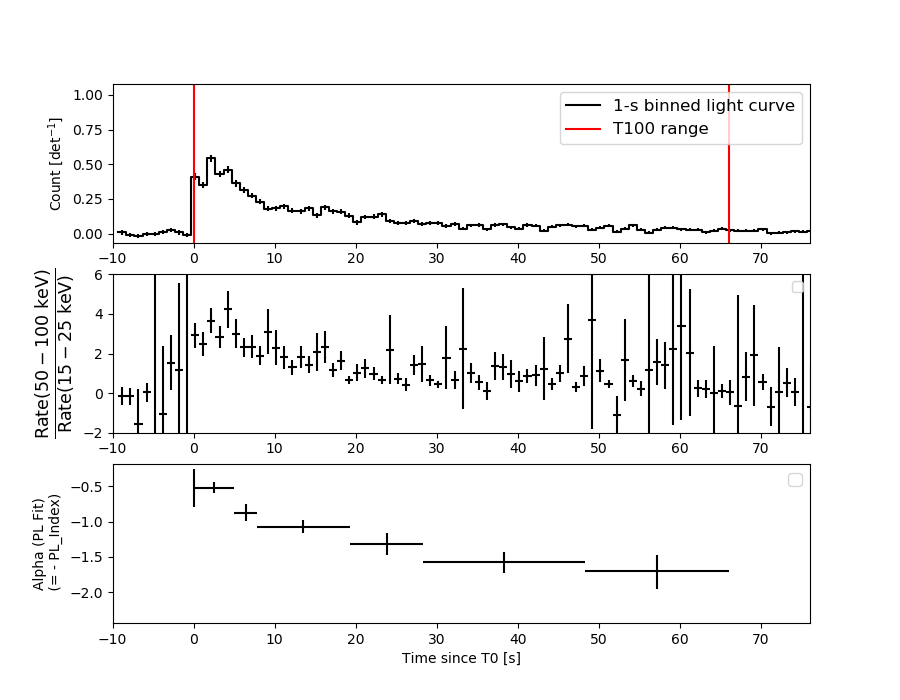
Duration
T90: 52.8759999275208 +/- 4.14596475750822
Measured from: 0.684000015258789
to: 53.5599999427795 [s; relative to TRIGTIME]
T50: 21.0199998617172 +/- 1.57035024751302
Measured from: 4.08000004291534
to: 25.0999999046326 [s; relative to TRIGTIME]
Fluence
Peak Flux (peak 1 second)
Measured from: 1.73599994182587
to: 2.73599994182587 [s; relative to TRIGTIME]
Total Fluence
Measured from: -0.00399994850158691
to: 66.0640000104904 [s; relative to TRIGTIME]
Band 1 Band 2 Band 3 Band 4
15-25 25-50 50-100 100-350 keV
Total 1.588350 2.433746 2.608836 1.084433
0.062638 0.066119 0.062206 0.054314 [error]
Peak 0.063677 0.121140 0.245373 0.118505
0.010664 0.012466 0.014378 0.013476 [error]
[ fluence units of on-axis counts / fully illuminated detector ]
======================================================================
====== Table of the duration information =============================
Value tstart tstop
T100 66.068 -0.004 66.064
T90 52.876 0.684 53.560
T50 21.020 4.080 25.100
Peak 1.000 1.736 2.736
====== Spectral Analysis Summary =====================================
Model : spectral model: simple power-law (PL) and cutoff power-law (CPL)
Ph_index : photon index: E^{Ph_index}
Ph_90err : 90% error of the photon index
Epeak : Epeak in keV
Epeak_90err: 90% error of Epeak
Norm : normalization at 50 keV in both the PL model and CPL model
Nomr_90err : 90% error of the normalization
chi2 : Chi-Squared
dof : degree of freedo
=== Time-averaged spectral analysis ===
(Best model with acceptable fit: N/A)
Model Ph_index Ph_90err_low Ph_90err_hi Epeak Epeak_90err_low Epeak_90err_hi Norm Nomr_90err_low Norm_90err_hi chi2 dof
PL -1.022 -0.056 0.057 - - - 7.79e-03 -2.30e-04 2.29e-04 64.080 57
CPL -1.021 -0.051 0.063 9999.360 -9999.360 -9999.360 7.84e-03 -2.37e-04 2.12e-04 64.440 56
=== 1-s peak spectral analysis ===
(Best model with acceptable fit: N/A)
Model Ph_index Ph_90err_low Ph_90err_hi Epeak Epeak_90err_low Epeak_90err_hi Norm Nomr_90err_low Norm_90err_hi chi2 dof
PL -0.471 -0.153 0.159 - - - 3.35e-02 -3.06e-03 2.99e-03 50.850 57
CPL -0.462 -0.153 0.162 9999.360 -9999.360 -9999.360 3.38e-02 -2.87e-03 1.69e-02 50.880 56
=== Fluence/Peak Flux Summary ===
Model Band1 Band2 Band3 Band4 Band5 Total
15-25 25-50 50-100 100-350 15-150 15-350 keV
Fluence PL 4.21e-07 1.04e-06 2.04e-06 9.99e-06 5.52e-06 1.35e-05 erg/cm2
90%_error_low -2.81e-08 -4.02e-08 -6.24e-08 -7.48e-07 -1.64e-07 -7.66e-07 erg/cm2
90%_error_hi 2.88e-08 4.00e-08 6.22e-08 7.94e-07 1.64e-07 8.06e-07 erg/cm2
Peak flux PL 7.25e-04 8.34e-03 8.86e-02 6.60e+00 3.80e-01 6.70e+00 ph/cm2/s
90%_error_low -3.61e-04 -3.83e-03 -3.76e-02 -2.17e+00 -1.49e-01 -2.21e+00 ph/cm2/s
90%_error_hi 7.46e-04 7.15e-03 5.90e-02 2.93e+00 2.36e-01 3.00e+00 ph/cm2/s
Fluence CPL 4.20e-07 1.04e-06 2.01e-06 1.00e-05 5.55e-06 1.26e-05 erg/cm2
90%_error_low -2.81e-08 N/A -3.07e-08 N/A -1.92e-07 N/A erg/cm2
90%_error_hi 2.89e-08 N/A 9.40e-08 N/A 1.35e-07 N/A erg/cm2
Peak flux CPL 5.18e-01 9.72e-01 1.40e+00 4.25e+00 3.99e+00 7.21e+00 ph/cm2/s
90%_error_low N/A N/A N/A N/A N/A -1.62e+00 ph/cm2/s
90%_error_hi N/A N/A N/A N/A N/A 7.51e-01 ph/cm2/s
======================================================================
Image
Pre-slew 15.0-350.0 keV image (Event data)
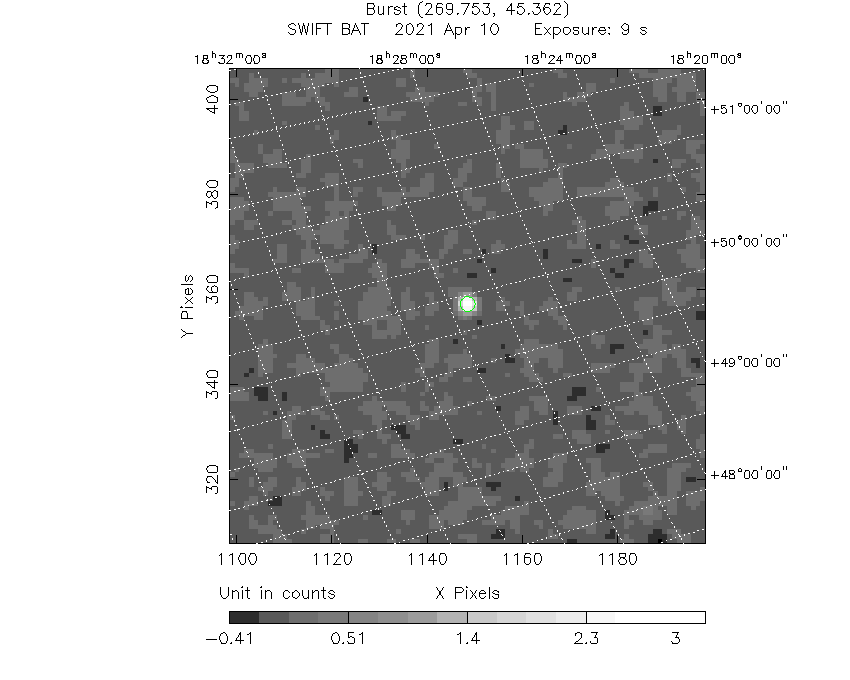
#   RAcent    DECcent   POSerr    Theta     Phi              Peak Cts       SNR   Name
  269.7410    45.3589   0.0041    31.7336   156.0012         3.6141380     46.789 TRIG_01042113

Foreground time interval of the image:
 -0.004   8.605 (delta_t =   8.609 [sec])
Background time interval of the image:
-160.195  -0.004 (delta_t = 160.191 [sec])
Light Curves
Note: The mask-weighted lightcurves have units of either count/det or counts/sec/det, where a det is 0.4 x 0.4 = 0.16 sq cm.
Full-time range; 1 s binning
Other quick-look light curves:
Spectra
Notes:
- 1) The fitting includes the systematic errors.
- 2) When the burst includes telescope slew time periods, the fitting uses an average response file made from multiple 5-s response files through out the slew time plus single time preiod for the non-slew times, and weighted by the total counts in the corresponding time period using addrmf. An average response file is needed becuase a spectral fit using the pre-slew DRM will introduce some errors in both a spectral shape and a normalization if the PHA file contains a lot of the slew/post-slew time interval.
- 3) For fits to more complicated models (e.g. a power-law over a cutoff power-law), the BAT team has decided to require a chi-square improvement of more than 6 for each extra dof.
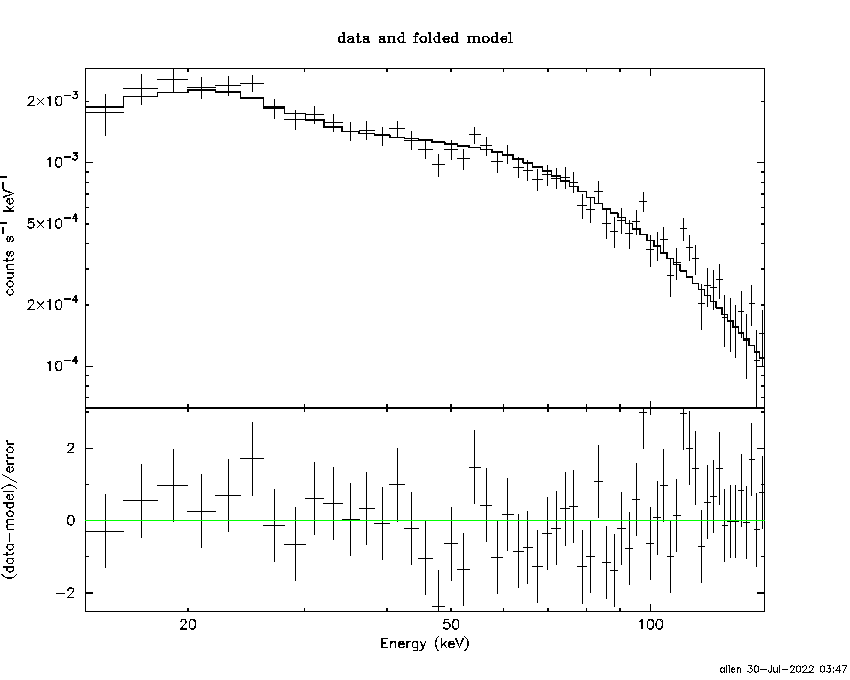
Time averaged spectrum fit using the average DRM
Power-law model

Time interval is from   -0.004 sec. to   66.064 sec.

Spectral model in power-law:
------------------------------------------------------------
Parameters  : value       lower 90%   higher 90%
Photon index: -1.02156     ( -0.0560931   0.0566251 )
Norm@50keV  : 7.78814E-03    ( -0.000229702   0.000228897 )
------------------------------------------------------------
#Fit statistic  : Chi-Squared                   64.08     using 59 bins.
 Reduced chi-squared = 1.12421
# Null hypothesis probability of 2.42e-01 with 57 degrees of freedom

Photon flux (15-150 keV)    in 66.07 sec: 0.897754 ( -0.027529  0.027667 ) ph/cm2/s
Energy fluence (15-150 keV)             : 5.52286e-06 ( -1.63734e-07  1.63888e-07 ) ergs/cm2
Cutoff power-law model
Time interval is from   -0.004 sec. to   66.064 sec.
Spectral model in the cutoff power-law:
------------------------------------------------------------
Parameters  : value       lower 90%   higher 90%
Photon index: -1.01581     ( -0.0518268   0.0623647 )
Epeak [keV] : 1.00000E+04      ( -10000 -10000 )
Norm@50keV  : 7.83296E-03    ( -0.000230181   0.000218434 )
------------------------------------------------------------
#Fit statistic  : Chi-Squared                   64.42     using 59 bins.
 Reduced chi-squared = 1.15036
# Null hypothesis probability of 2.06e-01 with 56 degrees of freedom

Photon flux (15-150 keV)    in 66.07 sec: 0.897421 ( -0.027565  0.02763 ) ph/cm2/s
Energy fluence (15-150 keV)             : 5.5495e-06 ( -1.92347e-07  1.35023e-07 ) ergs/cm2
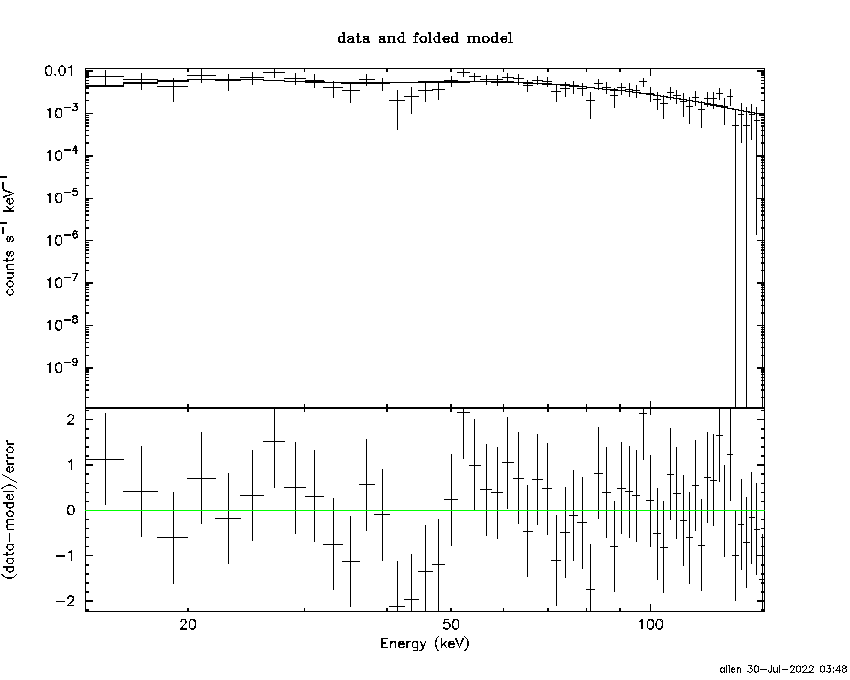
1-s peak spectrum fit
Power-law model

Time interval is from    1.736 sec. to    2.736 sec.

Spectral model in power-law:
------------------------------------------------------------
Parameters  : value       lower 90%   higher 90%
Photon index: -0.471297     ( -0.152676   0.159473 )
Norm@50keV  : 3.34853E-02    ( -0.00306073   0.00299067 )
------------------------------------------------------------
#Fit statistic  : Chi-Squared                   50.85     using 59 bins.
 Reduced chi-squared = 0.892105
# Null hypothesis probability of 7.04e-01 with 57 degrees of freedom

Photon flux (15-150 keV)    in 1 sec: 0.380174 ( -0.148779  0.235892 ) ph/cm2/s
Energy fluence (15-150 keV)             : 4.56562e-07 ( -3.7508e-08  3.76349e-08 ) ergs/cm2
Cutoff power-law model
Time interval is from    1.736 sec. to    2.736 sec.
Spectral model in the cutoff power-law:
------------------------------------------------------------
Parameters  : value       lower 90%   higher 90%
Photon index: -0.461528     ( -0.153514   0.161847 )
Epeak [keV] : 9999.36      ( -9999.36 -9999.36 )
Norm@50keV  : 3.37885E-02    ( -0.0028698   0.0169081 )
------------------------------------------------------------
#Fit statistic  : Chi-Squared                   50.88     using 59 bins.
 Reduced chi-squared = 0.908571
# Null hypothesis probability of 6.69e-01 with 56 degrees of freedom

Photon flux (15-150 keV)    in 1 sec: 3.99308 (    ) ph/cm2/s
Energy fluence (15-150 keV)             : 4.56825e-07 ( -4.13834e-08  4.08319e-08 ) ergs/cm2
Time-resolved spectra
Distribution
T90 vs. Hardness ratio plot
T90                                   = N/A sec.
Hardness ratio (energy fluence ratio) = N/A
S(15-50 keV) vs. S(50-150 keV) plot
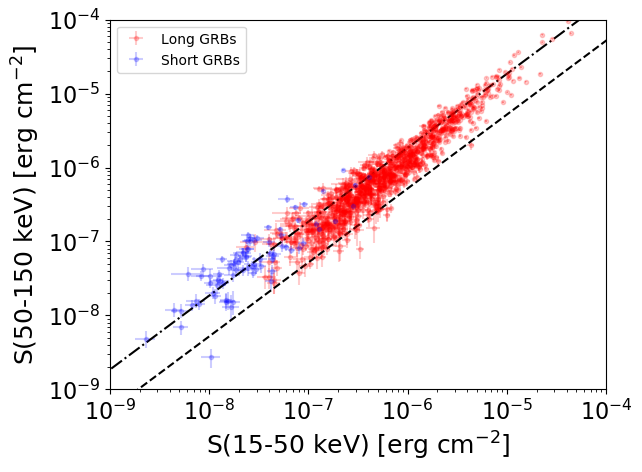
S(15-50 keV)  = N/A
S(50-150 keV) = N/A
The dash-dotted line and the dashed line traces the fluences calculated from the Band function with Epeak = 15 and 150 keV, respectively. Both lines assume a canonical values of alpha = -1 and beta = -2.5.
Mask shadow pattern
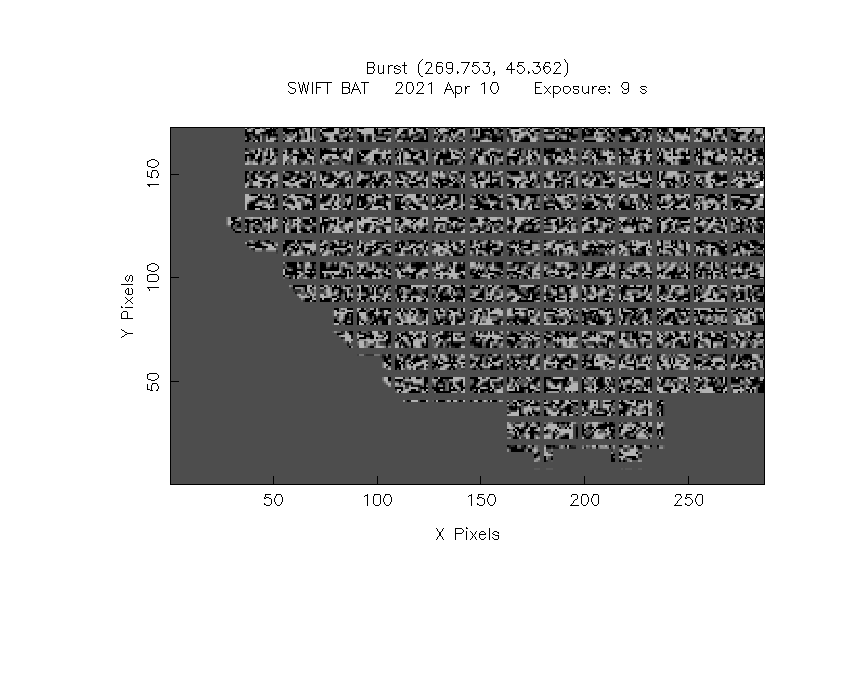
IMX = -5.649636120925426E-01, IMY = -2.515239810748552E-01
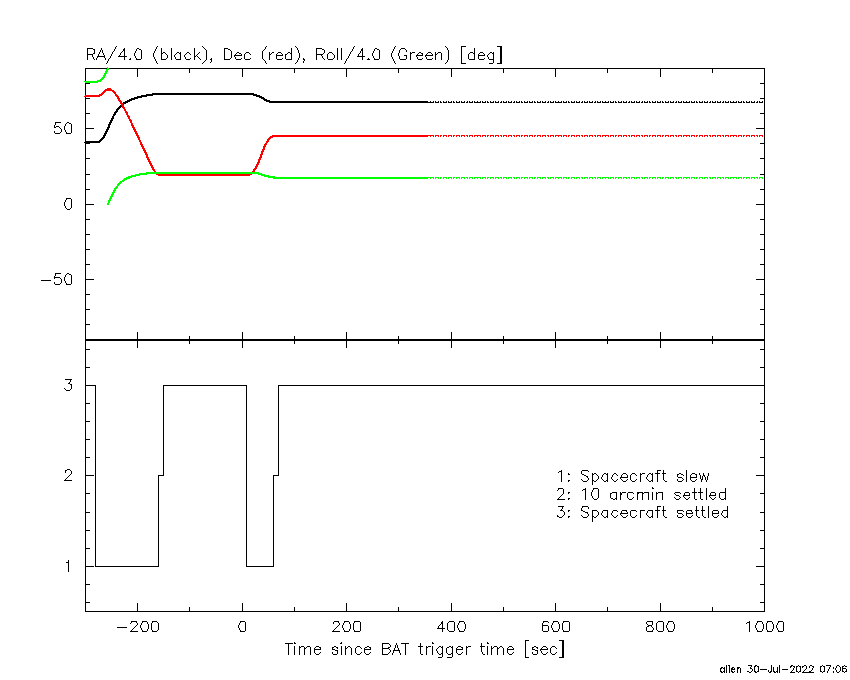
Spacecraft aspect plot
Bright source in the pre-burst/pre-slew/post-slew images
Pre-burst image of 15-350 keV band
Time interval of the image:
-160.195410 -0.004000

# RAcent  DECcent POSerr Theta    Phi  PeakCts   SNR AngSep     Name
#  [deg]    [deg]    ['] [deg]  [deg]                   [']
254.5673  35.2405    4.7  36.5  129.9   0.9504   2.4    8.1	Her X-1
268.5243  -1.4829   49.8  31.3   56.9   0.0694   0.2    9.5	SW J1753.5-0127
270.4677 -25.2244    7.3  49.5   32.6   1.1196   1.6   13.2	GX 5-1
270.3737 -25.7279    2.9  50.0   32.4   2.9378   3.9    4.0	GRS 1758-258
274.0259 -14.0806    6.0  38.1   35.8   0.6750   1.9    2.9	GX 17+2
276.0566 -30.3836   19.5  52.3   24.1  -0.5268  -0.6    6.9	H1820-303
285.1664 -24.9484    4.6  45.0   15.5   0.9386   2.5    7.3	HT1900.1-2455
288.6277  11.0753    0.0   9.1   28.6  -0.0376  -0.2   12.7	GRS 1915+105
299.5732  35.1894    1.1  17.0 -152.1   1.8927  10.6    1.1	Cyg X-1
308.2101  41.0925    7.1  25.5 -144.4   0.3264   1.6    9.5	Cyg X-3
326.3023  38.3810    6.0  35.0 -123.3   0.5606   1.9    7.1	Cyg X-2
252.6820   9.4562    1.8  39.4   87.5   4.1862   6.3 ------	UNKNOWN
332.2637  -3.9520    2.7  45.9  -57.0   3.8127   4.3 ------	UNKNOWN
Pre-slew background subtracted image of 15-350 keV band
Time interval of the image:
-0.004000 8.604600

# RAcent  DECcent POSerr Theta    Phi  PeakCts   SNR AngSep     Name
#  [deg]    [deg]    ['] [deg]  [deg]                   [']
254.4894  35.5135    7.0  36.7  130.3   0.2153   1.6   10.4	Her X-1
268.3731  -1.4535  220.8  31.4   57.2  -0.0053  -0.1    0.3	SW J1753.5-0127
270.1533 -25.0870   12.9  49.5   33.0  -0.1958  -0.9    7.1	GX 5-1
270.1699 -25.7024    6.6  50.0   32.6  -0.4180  -1.7    7.6	GRS 1758-258
273.8361 -13.9150    8.0  38.0   36.2   0.1618   1.4   12.3	GX 17+2
275.7753 -30.2998   11.6  52.3   24.4   0.2739   1.0    8.7	H1820-303
285.1187 -24.9359    4.9  45.0   15.5  -0.2506  -2.4    4.6	HT1900.1-2455
288.8972  10.9454    6.0   9.2   26.8   0.1046   1.9    5.8	GRS 1915+105
299.5531  35.2625    5.3  17.0 -152.3  -0.1125  -2.2    4.1	Cyg X-1
307.9273  40.8305    5.5  25.2 -144.5  -0.1192  -2.1   11.1	Cyg X-3
326.1784  38.3224   22.5  34.9 -123.3   0.0439   0.5    0.3	Cyg X-2
242.3483  63.9234    3.0  55.4  162.5   1.2723   3.9 ------	UNKNOWN
269.7413  45.3593    0.2  31.7  156.0   3.6201  46.9 ------	UNKNOWN
264.6463  71.1700    2.5  54.1  176.0   0.8954   4.7 ------	UNKNOWN
304.3629 -23.8250    2.7  45.0   -9.4   0.3939   4.3 ------	UNKNOWN
315.3496 -21.3358    3.1  46.8  -23.7   0.4003   3.6 ------	UNKNOWN
331.0162 -11.1977    2.4  49.1  -48.0   1.1830   4.8 ------	UNKNOWN
Post-slew image of 15-350 keV band
Time interval of the image:
60.204600 718.080700
720.704000 962.835700

# RAcent  DECcent POSerr Theta    Phi  PeakCts   SNR AngSep     Name
#  [deg]    [deg]    ['] [deg]  [deg]                   [']
254.4854  35.3788    2.9  15.3   74.1   3.1870   3.9    2.6	Her X-1
268.3192  -1.5823   22.3  47.0   21.5   0.9028   0.5    8.3	SW J1753.5-0127
288.9090  11.0436   16.0  38.0  -12.0   0.6316   0.7    8.8	GRS 1915+105
299.5971  35.2162    1.3  24.7  -56.8   8.2261   9.1    0.9	Cyg X-1
308.1641  40.9529    8.1  28.1  -75.3   1.3841   1.4    2.4	Cyg X-3
258.8706  49.3118    3.8   8.4  141.6   1.8466   3.0 ------	UNKNOWN
356.7314  67.2051    2.8  47.9 -129.1  11.6297   4.1 ------	UNKNOWN