Analysis Summary
Notes:
- 1) No attempt has been made to eliminate the non-significant decimal places.
- 2) This batgrbproduct analysis is done using the HEASARC data.
- 3) This batgrbproduct analysis is using the flight position for the mask-weighting calculation.
======================================================================
                  BAT GRB EVENT DATA PROCESSING REPORT
    Process Script Ver: batgrbproduct v2.48
    Process Start Time: Fri Jul 29 23:36:37 EDT 2022
             Host Name: batproc1
   Current Working Dir: /local/data/bat1/alien/Swift_3rdBATcatalog/event/batevent_reproc/trigger1042398
======================================================================

  Trigger: 01042398      Segment: 000

  BAT Trigger Time: 639846378.304   [s; MET]
      Trigger Stop: 639846378.56   [s; MET]
               UTC: 2021-04-11T15:05:51.476880    [includes UTCF correction]
       Where From?: TDRSS position message

  BAT
    RA: 296.559356259681   Dec: -39.3728157586284  [deg; J2000]

     Catalogged Source?: NO
     Point Source?:      YES
     GRB Indicated?:     YES    [ by BAT flight software ]
     Image S/N Ratio:    8.09
     Image Trigger?:     NO
     Rate S/N Ratio:     14.6969384566991  [ if not an image trigger ]
     Image S/N Ratio:    8.09

  Analysis Position:   [ source = BAT ]
    RA: 296.559356259681   Dec: -39.3728157586284  [deg; J2000]

  Refined Position:   [ source = BAT pre-slew burst ]
    RA: 296.599206049108   Dec: -39.4012618719957  [deg; J2000]
        { 19h 46m 23.8s , -39d 24' 04.5" }
         +/- 0.787544710060317 [arcmin] (estimated 90% radius based on SNR)
         +/- 0.274704245068984 [arcmin] (formal 1-sigma fit error)
    SNR: 42.7855026984112

  Angular difference between the analysis and refined position is 2.515538 arcmin

  Partial Coding Fraction: 0.796875    [ including projection effects ]

  Duration
     T90: 12.7999999523163 +/- 0.597059479426177
        Measured from: 0.379999995231628
                   to: 13.1799999475479     [s; relative to TRIGTIME]
     T50: 6.86799991130829 +/- 0.364263653124258
        Measured from: 3.51999998092651
                   to: 10.3879998922348     [s; relative to TRIGTIME]


  Fluence
     Peak Flux  (peak 1 second)
        Measured from: 3.86800003051758
                   to: 4.86800003051758     [s; relative to TRIGTIME]
     Total Fluence
        Measured from: -0.448000073432922
                   to: 14.4399999380112     [s; relative to TRIGTIME]

             Band 1     Band 2     Band 3     Band 4
              15-25      25-50     50-100    100-350     keV
 Total     1.418456   1.113022   0.322379   0.034321
           0.033714   0.032794   0.026136   0.023159 [error]
 Peak      0.221712   0.236745   0.093356   0.009778
           0.010831   0.011274   0.008159   0.006053 [error]

     [ fluence units of on-axis counts / fully illuminated detector ]

======================================================================


====== Table of the duration information =============================

        Value   tstart    tstop
T100   14.888   -0.448   14.440
T90    12.800    0.380   13.180
T50     6.868    3.520   10.388
Peak    1.000    3.868    4.868


====== Spectral Analysis Summary =====================================

Model      : spectral model: simple power-law (PL) and cutoff power-law (CPL)
Ph_index   : photon index: E^{Ph_index}
Ph_90err   : 90% error of the photon index
Epeak      : Epeak in keV
Epeak_90err: 90% error of Epeak
Norm       : normalization at 50 keV in both the PL model and CPL model
Nomr_90err : 90% error of the normalization
chi2       : Chi-Squared
dof        : degree of freedo

=== Time-averaged spectral analysis ===
(Best model with acceptable fit: N/A)

Model Ph_index Ph_90err_low Ph_90err_hi  Epeak  Epeak_90err_low  Epeak_90err_hi  Norm       Nomr_90err_low    Norm_90err_hi    chi2    dof
PL      -2.615    -0.093      0.091       -           -               -         8.46e-03     -4.96e-04          4.94e-04      73.230   57
CPL     -1.619    -0.453      0.503       14.364     -13.490         8.015      3.36e-02     -1.43e-02          3.42e-02      56.450   56


=== 1-s peak spectral analysis ===
(Best model with acceptable fit: N/A)

Model Ph_index Ph_90err_low Ph_90err_hi  Epeak  Epeak_90err_low  Epeak_90err_hi  Norm       Nomr_90err_low    Norm_90err_hi    chi2    dof
PL      -2.217     -0.111     0.108       -           -               -         2.84e-02     -2.16e-03          2.14e-03      87.450   57
CPL     -1.047     -0.549     0.636       32.637      -7.914         4.832      1.40e-01     -7.29e-02          1.95e-01      72.160   56


=== Fluence/Peak Flux Summary ===

              Model    Band1     Band2     Band3     Band4     Band5     Total
                       15-25     25-50    50-100    100-350    15-150    15-350    keV
Fluence         PL   4.64e-07  4.36e-07  2.85e-07  2.88e-07  1.30e-06  1.47e-06   erg/cm2
      90%_error_low -2.84e-08 -1.82e-08 -2.32e-08 -4.37e-08 -5.57e-08 -7.51e-08   erg/cm2
      90%_error_hi   2.89e-08  1.81e-08  2.37e-08  4.90e-08  5.60e-08  7.78e-08   erg/cm2
Peak flux       PL   2.34e+00  1.55e+00  6.66e-01  3.93e-01  4.75e+00  4.95e+00   ph/cm2/s
      90%_error_low -1.99e-01 -9.32e-02 -6.54e-02 -6.81e-02 -2.92e-01 -2.98e-01   ph/cm2/s
      90%_error_hi   2.02e-01  9.32e-02  6.60e-02  7.62e-02  2.92e-01  2.98e-01   ph/cm2/s

Fluence        CPL   4.24e-07  4.70e-07  2.44e-07  5.82e-08  1.18e-06  1.20e-06   erg/cm2
      90%_error_low -3.32e-08 -2.33e-08 -3.27e-08 -2.82e-08 -6.74e-08 -7.48e-08   erg/cm2
      90%_error_hi   3.34e-08  2.35e-08  3.17e-08  4.83e-08  7.01e-08  8.86e-08   erg/cm2
Peak flux      CPL   2.11e+00  1.75e+00  6.31e-01  9.65e-02  4.58e+00  4.59e+00   ph/cm2/s
      90%_error_low -2.27e-01 -1.31e-01 -8.63e-02 -4.91e-02 -3.01e-01 -3.07e-01   ph/cm2/s
      90%_error_hi   2.29e-01  1.34e-01  8.11e-02  8.37e-02  3.01e-01  3.10e-01   ph/cm2/s

======================================================================
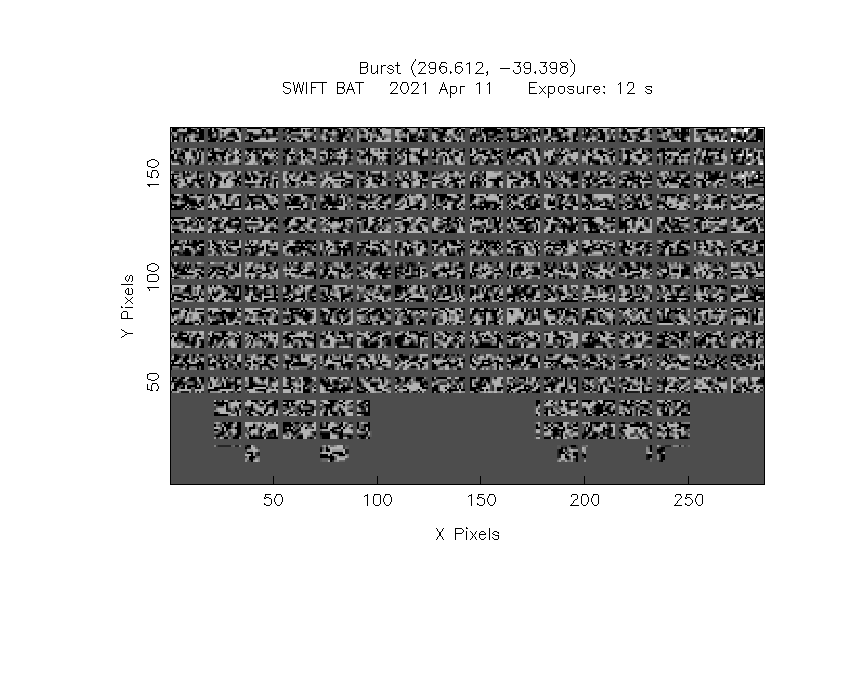
Image
Pre-slew 15.0-350.0 keV image (Event data)
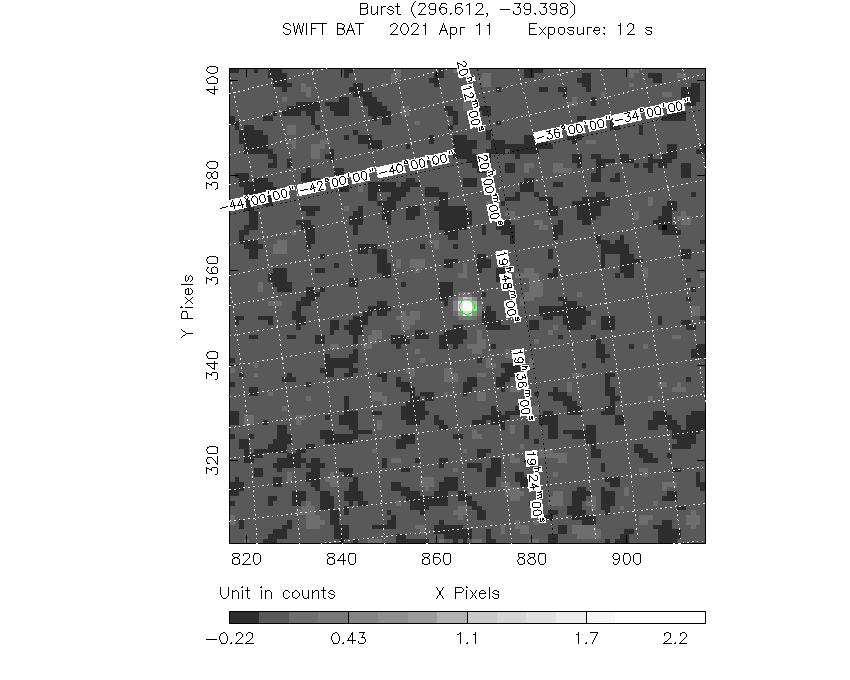
#   RAcent    DECcent   POSerr    Theta     Phi              Peak Cts       SNR   Name
  296.5992   -39.4013   0.0045    14.7145    83.8958         2.6703249     42.786 TRIG_01042398

Foreground time interval of the image:
 -0.448  11.597 (delta_t =  12.045 [sec])
Background time interval of the image:
-145.803  -0.448 (delta_t = 145.355 [sec])
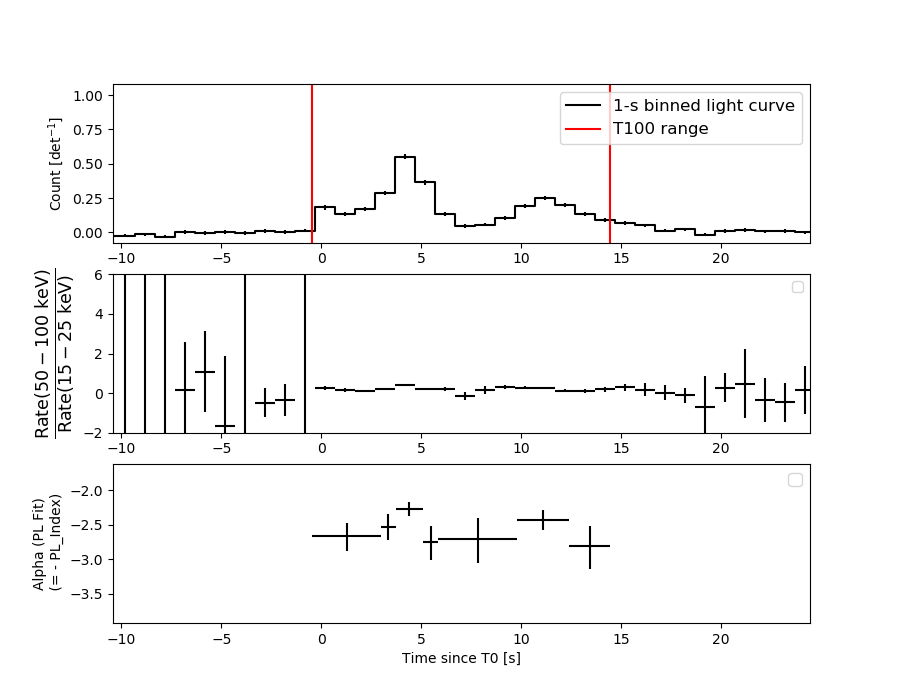
Light Curves
Note: The mask-weighted lightcurves have units of either count/det or counts/sec/det, where a det is 0.4 x 0.4 = 0.16 sq cm.
Full-time range; 1 s binning
Other quick-look light curves:
- 64 ms binning (zoomed)
- 16 ms binning (zoomed)
- 8 ms binning (zoomed)
- 2 ms binning (zoomed)
- SN=5 or 10 s binning (full-time range)
- Raw light curve
Spectra
- 64 ms binning (zoomed)
- 16 ms binning (zoomed)
- 8 ms binning (zoomed)
- 2 ms binning (zoomed)
- SN=5 or 10 s binning (full-time range)
- Raw light curve
Spectra
Notes:
- 1) The fitting includes the systematic errors.
- 2) When the burst includes telescope slew time periods, the fitting uses an average response file made from multiple 5-s response files through out the slew time plus single time preiod for the non-slew times, and weighted by the total counts in the corresponding time period using addrmf. An average response file is needed becuase a spectral fit using the pre-slew DRM will introduce some errors in both a spectral shape and a normalization if the PHA file contains a lot of the slew/post-slew time interval.
- 3) For fits to more complicated models (e.g. a power-law over a cutoff power-law), the BAT team has decided to require a chi-square improvement of more than 6 for each extra dof.
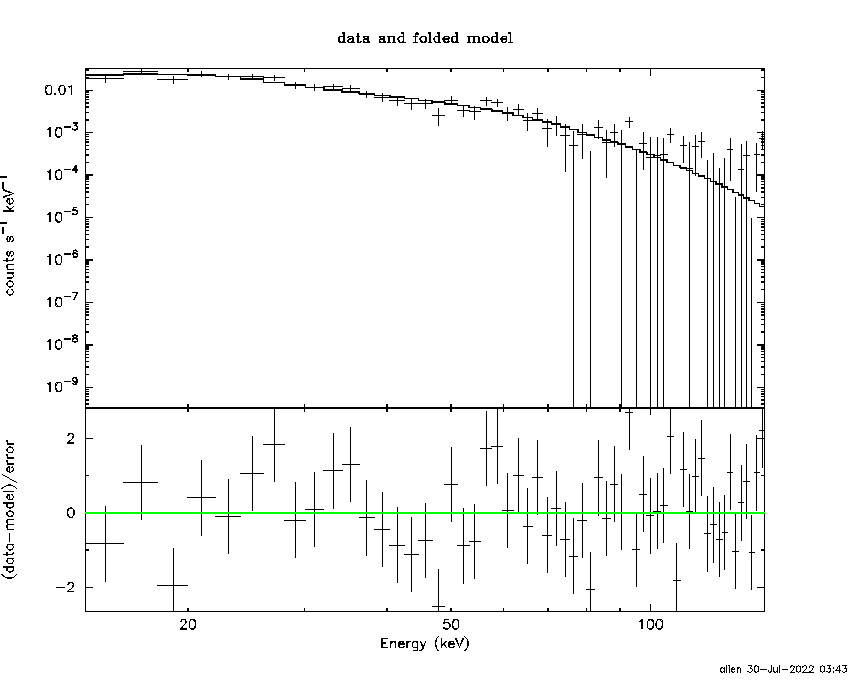
Time averaged spectrum fit using the average DRM
Power-law model
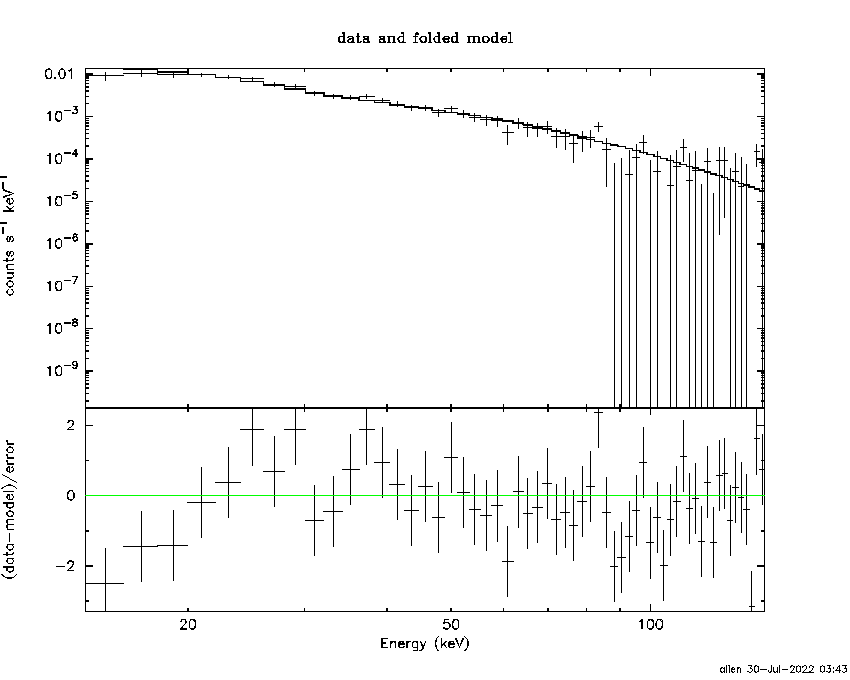
Time interval is from   -0.448 sec. to   14.440 sec.

Spectral model in power-law:
------------------------------------------------------------
Parameters  : value       lower 90%   higher 90%
Photon index: -2.61464     ( -0.0928269   0.0907473 )
Norm@50keV  : 8.45571E-03    ( -0.000496315   0.000493648 )
------------------------------------------------------------
#Fit statistic  : Chi-Squared                   73.23     using 59 bins.
 Reduced chi-squared = 1.28474
# Null hypothesis probability of 7.25e-02 with 57 degrees of freedom

Photon flux (15-150 keV)    in 14.89 sec: 1.78525 ( -0.07893  0.07927 ) ph/cm2/s
Energy fluence (15-150 keV)             : 1.30225e-06 ( -5.57441e-08  5.59833e-08 ) ergs/cm2
Cutoff power-law model
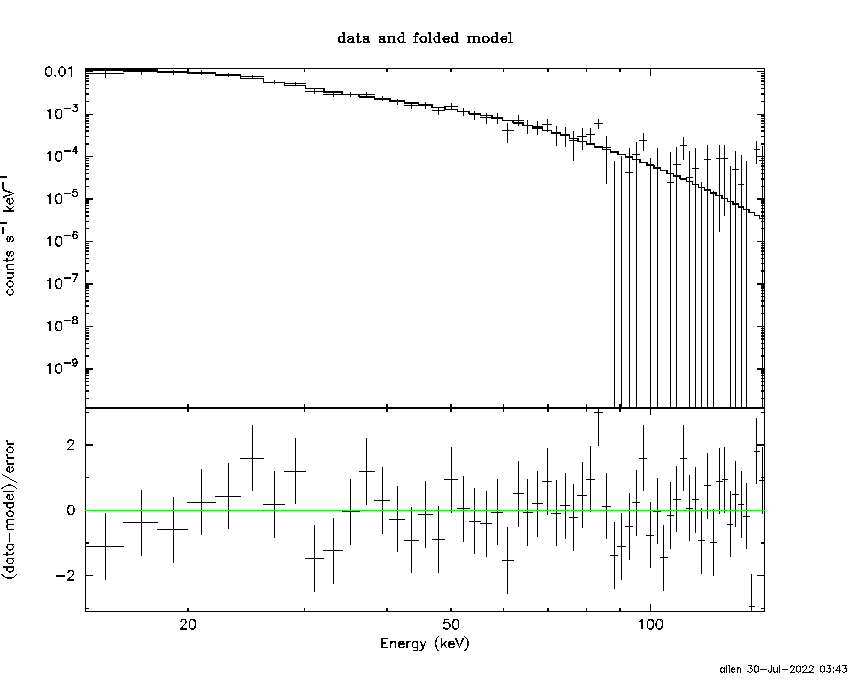
Time interval is from   -0.448 sec. to   14.440 sec.
Spectral model in the cutoff power-law:
------------------------------------------------------------
Parameters  : value       lower 90%   higher 90%
Photon index: -1.61872     ( -0.453431   0.503209 )
Epeak [keV] : 14.3636      ( -13.4918 8.01361 )
Norm@50keV  : 3.36059E-02    ( -0.0143037   0.0341496 )
------------------------------------------------------------
#Fit statistic  : Chi-Squared                   56.45     using 59 bins.
 Reduced chi-squared = 1.00804
# Null hypothesis probability of 4.58e-01 with 56 degrees of freedom

Photon flux (15-150 keV)    in 14.89 sec: 1.68491 ( -0.0887  0.08896 ) ph/cm2/s
Energy fluence (15-150 keV)             : 1.18463e-06 ( -6.74253e-08  7.00789e-08 ) ergs/cm2
1-s peak spectrum fit
Power-law model
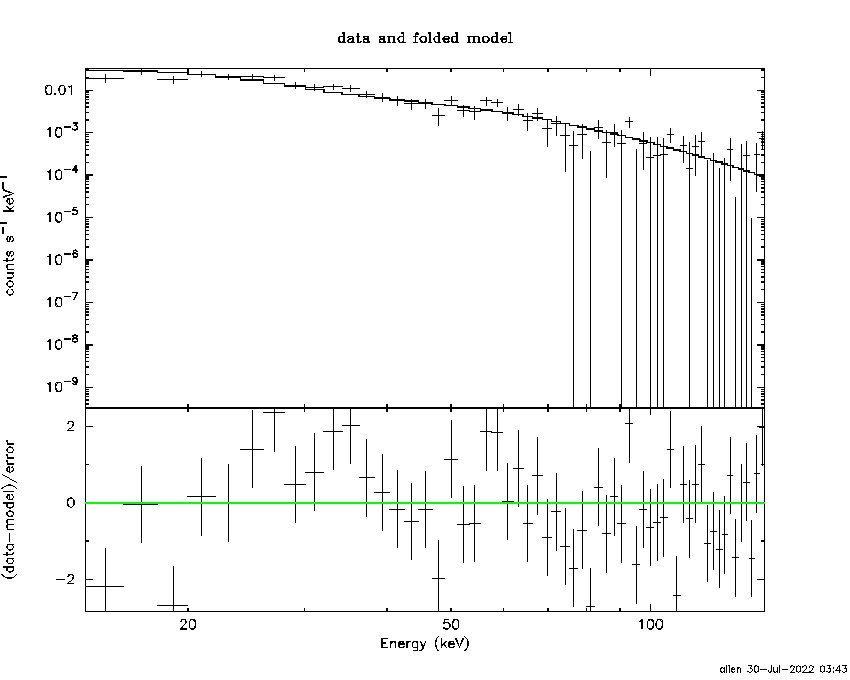
Time interval is from    3.868 sec. to    4.868 sec.

Spectral model in power-law:
------------------------------------------------------------
Parameters  : value       lower 90%   higher 90%
Photon index: -2.21733     ( -0.111359   0.107825 )
Norm@50keV  : 2.84293E-02    ( -0.00216059   0.002137 )
------------------------------------------------------------
#Fit statistic  : Chi-Squared                   87.45     using 59 bins.
 Reduced chi-squared = 1.53421
# Null hypothesis probability of 5.86e-03 with 57 degrees of freedom

Photon flux (15-150 keV)    in 1 sec: 4.75037 ( -0.29169  0.29195 ) ph/cm2/s
Energy fluence (15-150 keV)             : 2.68022e-07 ( -1.78838e-08  1.80135e-08 ) ergs/cm2
Cutoff power-law model
Time interval is from    3.868 sec. to    4.868 sec.
Spectral model in the cutoff power-law:
------------------------------------------------------------
Parameters  : value       lower 90%   higher 90%
Photon index: -1.04672     ( -0.549181   0.635506 )
Epeak [keV] : 32.6366      ( -7.91486 4.83152 )
Norm@50keV  : 0.139500    ( -0.0729389   0.19537 )
------------------------------------------------------------
#Fit statistic  : Chi-Squared                   72.16     using 59 bins.
 Reduced chi-squared = 1.28857
# Null hypothesis probability of 7.18e-02 with 56 degrees of freedom

Photon flux (15-150 keV)    in 1 sec: 4.57746 ( -0.3009  0.30132 ) ph/cm2/s
Energy fluence (15-150 keV)             : 2.44861e-07 ( -1.93073e-08  1.99646e-08 ) ergs/cm2
Time-resolved spectra
Distribution
T90 vs. Hardness ratio plot
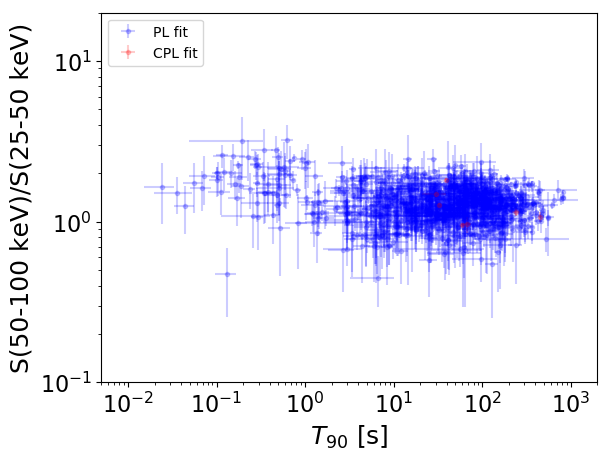
T90                                   = N/A sec.
Hardness ratio (energy fluence ratio) = N/A
S(15-50 keV) vs. S(50-150 keV) plot
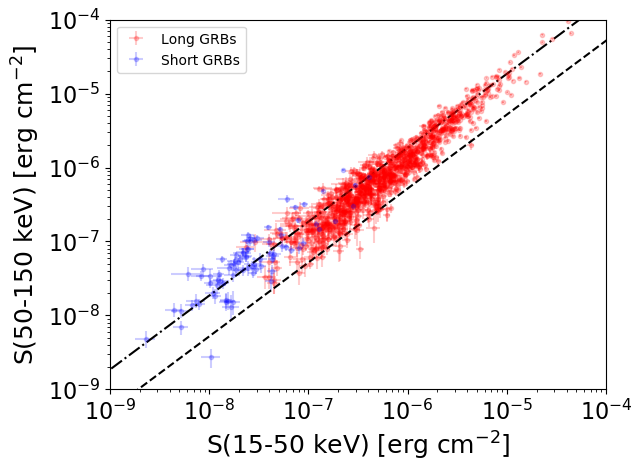
S(15-50 keV)  = N/A
S(50-150 keV) = N/A
The dash-dotted line and the dashed line traces the fluences calculated from the Band function with Epeak = 15 and 150 keV, respectively. Both lines assume a canonical values of alpha = -1 and beta = -2.5.
Mask shadow pattern
IMX = 2.792549792731256E-02, IMY = -2.611258187836020E-01
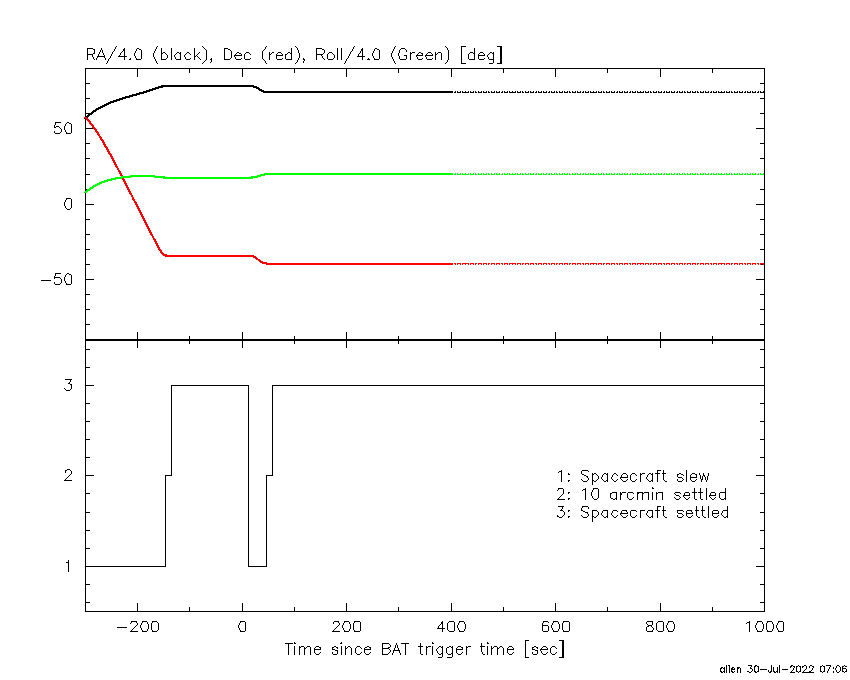
Spacecraft aspect plot
Bright source in the pre-burst/pre-slew/post-slew images
Pre-burst image of 15-350 keV band
Time interval of the image:
-145.803400 -0.448000

# RAcent  DECcent POSerr Theta    Phi  PeakCts   SNR AngSep     Name
#  [deg]    [deg]    ['] [deg]  [deg]                   [']
264.7985 -44.5838    5.0  38.7   79.1   1.4220   2.3    8.4	4U 1735-44
270.1625 -25.1094   22.7  38.7  111.3   0.3169   0.5    6.9	GX 5-1
270.1984 -25.6869   16.4  38.4  110.5   0.4159   0.7    6.6	GRS 1758-258
274.0814 -14.1300    6.4  41.0  129.0   1.1282   1.8    7.1	GX 17+2
275.9298 -30.3682   20.9  32.1  105.9   0.1809   0.6    0.3	H1820-303
285.1929 -24.8435    4.5  26.5  122.7   0.6721   2.6    9.7	HT1900.1-2455
288.9056  10.8947    8.3  50.9  167.6  -0.9036  -1.4    7.0	GRS 1915+105
286.2300 -15.8953    2.7  30.8  139.3   1.0860   4.2 ------	UNKNOWN
338.2790   0.2707    2.2  41.4 -121.4   2.4352   5.3 ------	UNKNOWN
Pre-slew background subtracted image of 15-350 keV band
Time interval of the image:
-0.448000 11.596600

# RAcent  DECcent POSerr Theta    Phi  PeakCts   SNR AngSep     Name
#  [deg]    [deg]    ['] [deg]  [deg]                   [']
264.8125 -44.4430    6.4  38.7   79.3  -0.3943  -1.8    3.0	4U 1735-44
270.1039 -25.2085    0.0  38.7  111.1  -0.1115  -0.6   12.5	GX 5-1
270.2611 -25.6817    7.8  38.4  110.5   0.2738   1.5    4.3	GRS 1758-258
274.0243 -13.9064   48.5  41.2  129.3  -0.0459  -0.2    7.9	GX 17+2
276.0809 -30.4921    6.0  31.9  105.7   0.1862   1.9   11.0	H1820-303
285.0918 -24.9960   12.5  26.5  122.3   0.0715   0.9    5.5	HT1900.1-2455
288.8907  11.0069   19.8  51.0  167.6   0.1081   0.6    6.6	GRS 1915+105
296.5992 -39.4012    0.3  14.7   83.9   2.6702  42.7 ------	UNKNOWN
294.8363   2.2326    2.6  40.5  169.8   0.3944   4.4 ------	UNKNOWN
304.7438 -17.7536    2.2  18.3  171.2   0.2742   5.2 ------	UNKNOWN
317.3815 -34.9172    2.1   3.0  -54.7   0.2702   5.4 ------	UNKNOWN
  7.8418 -60.1729    2.4  43.2  -16.2   0.4362   4.8 ------	UNKNOWN
313.7814  22.1746    2.7  56.3 -160.3   0.8431   4.2 ------	UNKNOWN
  5.0241 -27.9441    2.8  43.9  -63.8   0.8745   4.2 ------	UNKNOWN
  6.9791 -29.6692    2.5  44.9  -60.7   1.0159   4.5 ------	UNKNOWN
Post-slew image of 15-350 keV band
Time interval of the image:
47.196580 962.775900

# RAcent  DECcent POSerr Theta    Phi  PeakCts   SNR AngSep     Name
#  [deg]    [deg]    ['] [deg]  [deg]                   [']
255.9703 -37.8506    1.1  31.5   90.5  16.5455  10.6    0.9	4U 1700-377
256.4673 -36.4320    5.3  31.5   93.3   3.1131   2.2    1.6	GX 349+2
262.9370 -24.7536   10.3  31.8  118.1   2.1008   1.1    4.0	GX 1+4
264.5627 -44.4526    4.0  24.2   78.3   3.3957   2.9    7.7	4U 1735-44
268.2405  -1.5001   24.4  45.8  149.4   1.4778   0.5    8.2	SW J1753.5-0127
270.2744 -25.1172    6.2  26.3  125.8   2.3172   1.8    2.3	GX 5-1
270.4816 -25.6048    0.0  25.8  125.2   2.3277   1.9   12.8	GRS 1758-258
274.0691 -13.9779    4.0  32.2  146.6   3.6750   2.9    5.1	GX 17+2
275.8840 -30.4194    6.1  19.1  122.4   1.9850   1.9    3.8	H1820-303
284.8678 -24.7896    6.6  17.6  153.3  -1.7213  -1.8   12.1	HT1900.1-2455
288.7159  10.8818   10.2  50.8 -179.2   2.7886   1.1    6.2	GRS 1915+105
262.9207 -33.9618   13.7  27.4  101.6   1.1856   0.8    8.4	GX 354-0
171.3123 -84.0918    2.7  54.2   16.8  19.1635   4.4 ------	UNKNOWN
276.0493 -61.6058    3.7  25.5   33.6   3.2639   3.1 ------	UNKNOWN
325.1363   0.7632    3.0  47.9 -129.1  17.2511   3.9 ------	UNKNOWN
328.5247  -4.4334    3.2  45.3 -121.3  13.0145   3.6 ------	UNKNOWN