Analysis Summary
Notes:
- 1) No attempt has been made to eliminate the non-significant decimal places.
- 2) This batgrbproduct analysis is done using the HEASARC data.
- 3) This batgrbproduct analysis is using the flight position for the mask-weighting calculation.
======================================================================
                  BAT GRB EVENT DATA PROCESSING REPORT
    Process Script Ver: batgrbproduct v2.48
    Process Start Time: Fri Jul 29 23:34:54 EDT 2022
             Host Name: batproc1
   Current Working Dir: /local/data/bat1/alien/Swift_3rdBATcatalog/event/batevent_reproc/trigger1044032
======================================================================

  Trigger: 01044032      Segment: 000

  BAT Trigger Time: 640508048   [s; MET]
      Trigger Stop: 640508112   [s; MET]
               UTC: 2021-04-19T06:53:41.128920    [includes UTCF correction]
       Where From?: TDRSS position message

  BAT
    RA: 86.8619158317771   Dec: -65.5391081568672  [deg; J2000]

     Catalogged Source?: NO
     Point Source?:      YES
     GRB Indicated?:     YES    [ by BAT flight software ]
     Image S/N Ratio:    8.15
     Image Trigger?:     YES
     Rate S/N Ratio:     0  [ if not an image trigger ]
     Image S/N Ratio:    8.15

  Analysis Position:   [ source = BAT ]
    RA: 86.8619158317771   Dec: -65.5391081568672  [deg; J2000]

  Refined Position:   [ source = BAT pre-slew burst ]
    RA: 86.9191773348288   Dec: -65.4532058391007  [deg; J2000]
        { 05h 47m 40.6s , -65d 27' 11.5" }
         +/- 2.69991093185425 [arcmin] (estimated 90% radius based on SNR)
         +/- 1.55537845599141 [arcmin] (formal 1-sigma fit error)
    SNR: 7.36045900335675

  Angular difference between the analysis and refined position is 5.347492 arcmin

  Partial Coding Fraction: 0.6171875    [ including projection effects ]

  Duration
     T90: 71.0759999752045 +/- 13.780151681585
        Measured from: 27.8159999847412
                   to: 98.8919999599457     [s; relative to TRIGTIME]
     T50: 35.8959999084473 +/- 10.7951324586934
        Measured from: 41.3680000305176
                   to: 77.2639999389648     [s; relative to TRIGTIME]


  Fluence
     Peak Flux  (peak 1 second)
        Measured from: 41.8200000524521
                   to: 42.8200000524521     [s; relative to TRIGTIME]
     Total Fluence
        Measured from: 22.7920000553131
                   to: 111.424000024796     [s; relative to TRIGTIME]

             Band 1     Band 2     Band 3     Band 4
              15-25      25-50     50-100    100-350     keV
 Total     0.704768   0.657641   0.249905   0.025083
           0.069778   0.071562   0.061949   0.055520 [error]
 Peak      0.024392   0.026597   0.020512   0.007078
           0.007874   0.008506   0.006866   0.006082 [error]

     [ fluence units of on-axis counts / fully illuminated detector ]

======================================================================


====== Table of the duration information =============================

        Value   tstart    tstop
T100   88.632   22.792  111.424
T90    71.076   27.816   98.892
T50    35.896   41.368   77.264
Peak    1.000   41.820   42.820


====== Spectral Analysis Summary =====================================

Model      : spectral model: simple power-law (PL) and cutoff power-law (CPL)
Ph_index   : photon index: E^{Ph_index}
Ph_90err   : 90% error of the photon index
Epeak      : Epeak in keV
Epeak_90err: 90% error of Epeak
Norm       : normalization at 50 keV in both the PL model and CPL model
Nomr_90err : 90% error of the normalization
chi2       : Chi-Squared
dof        : degree of freedo

=== Time-averaged spectral analysis ===
(Best model with acceptable fit: N/A)

Model Ph_index Ph_90err_low Ph_90err_hi  Epeak  Epeak_90err_low  Epeak_90err_hi  Norm       Nomr_90err_low    Norm_90err_hi    chi2    dof
PL      -2.144    -0.246      0.227       -           -               -         1.02e-03     -1.75e-04          1.72e-04      57.680   57
CPL     -1.256    -0.705      1.369       31.492      -9.375        15.644      3.59e-03     -3.59e-03          2.27e-02      55.560   56


=== 1-s peak spectral analysis ===
(Best model with acceptable fit: N/A)

Model Ph_index Ph_90err_low Ph_90err_hi  Epeak  Epeak_90err_low  Epeak_90err_hi  Norm       Nomr_90err_low    Norm_90err_hi    chi2    dof
PL      -1.668     -0.546     0.503       -           -               -         4.54e-03     -1.60e-03          1.54e-03      45.820   57
CPL     -0.455     -1.749     3.212       58.477     -58.477       -58.477      2.08e-02     -2.08e-02          1.06e+00      44.800   56


=== Fluence/Peak Flux Summary ===

              Model    Band1     Band2     Band3     Band4     Band5     Total
                       15-25     25-50    50-100    100-350    15-150    15-350    keV
Fluence         PL   2.11e-07  2.63e-07  2.38e-07  3.74e-07  8.40e-07  1.09e-06   erg/cm2
      90%_error_low -3.26e-08 -3.32e-08 -5.44e-08 -1.42e-07 -1.26e-07 -2.18e-07   erg/cm2
      90%_error_hi   3.31e-08  3.29e-08  5.69e-08  1.92e-07  1.30e-07  2.56e-07   erg/cm2
Peak flux       PL   2.19e-01  2.00e-01  1.26e-01  1.21e-01  5.96e-01  6.66e-01   ph/cm2/s
      90%_error_low -9.61e-02 -6.36e-02 -5.40e-02 -7.68e-02 -1.88e-01 -2.12e-01   ph/cm2/s
      90%_error_hi   1.05e-01  6.33e-02  5.44e-02  1.26e-01  1.88e-01  2.15e-01   ph/cm2/s

Fluence        CPL   2.02e-07  2.91e-07  2.11e-07  7.83e-08  7.61e-07  7.83e-07   erg/cm2
      90%_error_low -3.59e-08 -4.58e-08 -7.64e-08 -6.68e-08 -1.34e-07 -1.54e-07   erg/cm2
      90%_error_hi   3.55e-08  4.80e-08  6.97e-08  3.59e-07  1.56e-07  4.33e-07   erg/cm2
Peak flux      CPL   1.89e-01  2.31e-01  1.34e-01  3.60e-02  5.81e-01  5.90e-01   ph/cm2/s
      90%_error_low -1.14e-01 -8.16e-02 -6.66e-02 -3.60e-02 -1.89e-01 -1.95e-01   ph/cm2/s
      90%_error_hi   1.18e-01  8.94e-02  6.57e-02  1.23e-01  1.89e-01  2.35e-01   ph/cm2/s

======================================================================
Image
Pre-slew 15.0-350.0 keV image (Event data)
#   RAcent    DECcent   POSerr    Theta     Phi              Peak Cts       SNR   Name
   86.9192   -65.4532   0.0260    21.1227    98.4774         1.0856255      7.360 TRIG_01044032

Foreground time interval of the image:
 22.792  73.901 (delta_t =  51.109 [sec])
Background time interval of the image:
-15.699  22.792 (delta_t =  38.491 [sec])
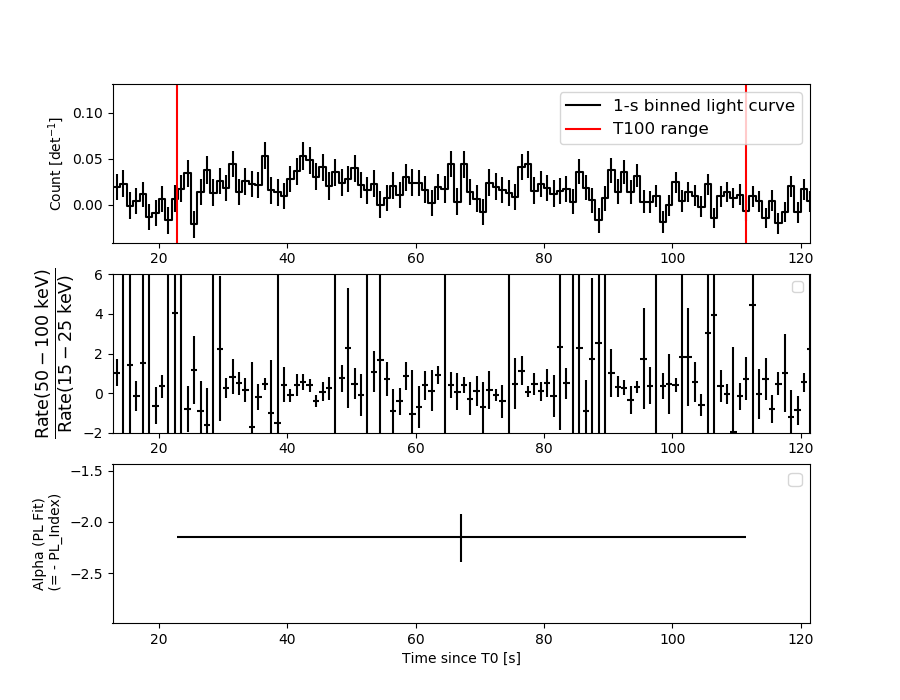
Light Curves
Note: The mask-weighted lightcurves have units of either count/det or counts/sec/det, where a det is 0.4 x 0.4 = 0.16 sq cm.
Full-time range; 1 s binning
Other quick-look light curves:
- 64 ms binning (zoomed)
- 16 ms binning (zoomed)
- 8 ms binning (zoomed)
- 2 ms binning (zoomed)
- SN=5 or 10 s binning (full-time range)
- Raw light curve
Spectra
- 64 ms binning (zoomed)
- 16 ms binning (zoomed)
- 8 ms binning (zoomed)
- 2 ms binning (zoomed)
- SN=5 or 10 s binning (full-time range)
- Raw light curve
Spectra
Notes:
- 1) The fitting includes the systematic errors.
- 2) When the burst includes telescope slew time periods, the fitting uses an average response file made from multiple 5-s response files through out the slew time plus single time preiod for the non-slew times, and weighted by the total counts in the corresponding time period using addrmf. An average response file is needed becuase a spectral fit using the pre-slew DRM will introduce some errors in both a spectral shape and a normalization if the PHA file contains a lot of the slew/post-slew time interval.
- 3) For fits to more complicated models (e.g. a power-law over a cutoff power-law), the BAT team has decided to require a chi-square improvement of more than 6 for each extra dof.
Time averaged spectrum fit using the average DRM
Power-law model
Time interval is from   22.792 sec. to  111.424 sec.

Spectral model in power-law:
------------------------------------------------------------
Parameters  : value       lower 90%   higher 90%
Photon index: -2.14412     ( -0.245514   0.227071 )
Norm@50keV  : 1.01565E-03    ( -0.000175342   0.000171597 )
------------------------------------------------------------
#Fit statistic  : Chi-Squared                   57.68     using 59 bins.
 Reduced chi-squared = 1.01193
# Null hypothesis probability of 4.50e-01 with 57 degrees of freedom

Photon flux (15-150 keV)    in 88.63 sec: 0.163372 ( -0.019444  0.019445 ) ph/cm2/s
Energy fluence (15-150 keV)             : 8.40448e-07 ( -1.25868e-07  1.30175e-07 ) ergs/cm2
Cutoff power-law model
Time interval is from   22.792 sec. to  111.424 sec.
Spectral model in the cutoff power-law:
------------------------------------------------------------
Parameters  : value       lower 90%   higher 90%
Photon index: -1.25578     ( -0.70541   1.36938 )
Epeak [keV] : 31.4925      ( -9.37503 15.6438 )
Norm@50keV  : 3.58696E-03    ( -0.00358731   0.0226514 )
------------------------------------------------------------
#Fit statistic  : Chi-Squared                   55.56     using 59 bins.
 Reduced chi-squared = 0.992143
# Null hypothesis probability of 4.92e-01 with 56 degrees of freedom

Photon flux (15-150 keV)    in 88.63 sec: 0.158870 ( -0.019907  0.02004 ) ph/cm2/s
Energy fluence (15-150 keV)             : 7.60993e-07 ( -1.34249e-07  1.55609e-07 ) ergs/cm2
1-s peak spectrum fit
Power-law model
Time interval is from   41.820 sec. to   42.820 sec.

Spectral model in power-law:
------------------------------------------------------------
Parameters  : value       lower 90%   higher 90%
Photon index: -1.66756     ( -0.546093   0.502535 )
Norm@50keV  : 4.53626E-03    ( -0.0015954   0.00154077 )
------------------------------------------------------------
#Fit statistic  : Chi-Squared                   45.82     using 59 bins.
 Reduced chi-squared = 0.80386
# Null hypothesis probability of 8.56e-01 with 57 degrees of freedom

Photon flux (15-150 keV)    in 1 sec: 0.595821 ( -0.187587  0.187722 ) ph/cm2/s
Energy fluence (15-150 keV)             : 4.2124e-08 ( -1.50252e-08  1.56045e-08 ) ergs/cm2
Cutoff power-law model
Time interval is from   41.820 sec. to   42.820 sec.
Spectral model in the cutoff power-law:
------------------------------------------------------------
Parameters  : value       lower 90%   higher 90%
Photon index: -0.455432     ( -1.7488   3.21205 )
Epeak [keV] : 58.4775      ( -58.4782 -58.4782 )
Norm@50keV  : 2.07820E-02    ( -0.0207811   1.05877 )
------------------------------------------------------------
#Fit statistic  : Chi-Squared                   44.80     using 59 bins.
 Reduced chi-squared = 0.8
# Null hypothesis probability of 8.59e-01 with 56 degrees of freedom

Photon flux (15-150 keV)    in 1 sec: 0.581422 ( -0.18912  0.189239 ) ph/cm2/s
Energy fluence (15-150 keV)             : 3.904e-08 ( -1.44686e-08  1.62632e-08 ) ergs/cm2
Time-resolved spectra
Distribution
T90 vs. Hardness ratio plot
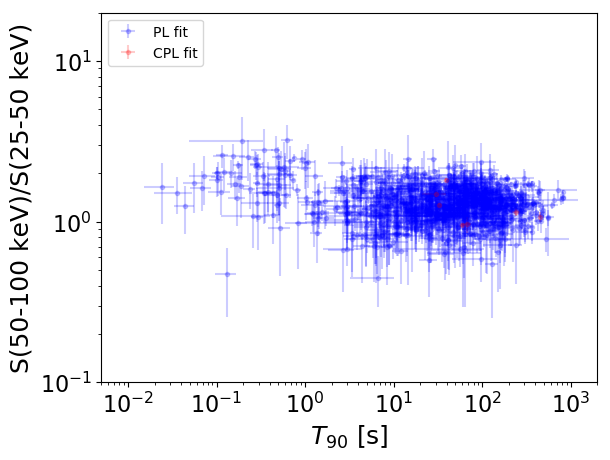
T90                                   = N/A sec.
Hardness ratio (energy fluence ratio) = N/A
S(15-50 keV) vs. S(50-150 keV) plot
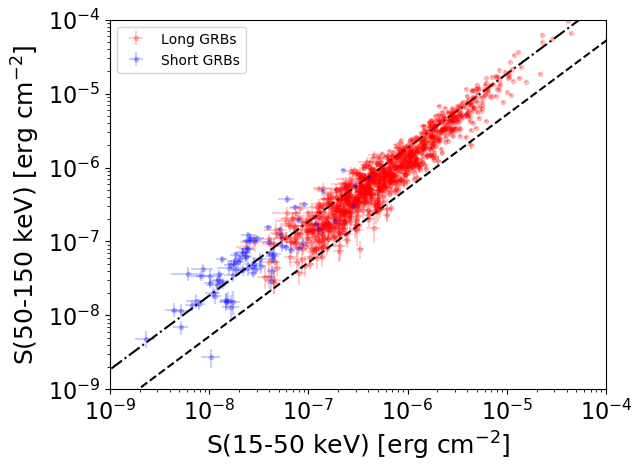
S(15-50 keV)  = N/A
S(50-150 keV) = N/A
The dash-dotted line and the dashed line traces the fluences calculated from the Band function with Epeak = 15 and 150 keV, respectively. Both lines assume a canonical values of alpha = -1 and beta = -2.5.
Mask shadow pattern
IMX = -5.695155266419270E-02, IMY = -3.821016374942349E-01
Spacecraft aspect plot
Bright source in the pre-burst/pre-slew/post-slew images
Pre-burst image of 15-350 keV band
Time interval of the image:
-15.699400 22.792000

# RAcent  DECcent POSerr Theta    Phi  PeakCts   SNR AngSep     Name
#  [deg]    [deg]    ['] [deg]  [deg]                   [']
Pre-slew background subtracted image of 15-350 keV band
Time interval of the image:
22.792000 73.900600

# RAcent  DECcent POSerr Theta    Phi  PeakCts   SNR AngSep     Name
#  [deg]    [deg]    ['] [deg]  [deg]                   [']
 86.9193 -65.4532    1.6  21.1   98.5   1.0858   7.3 ------	UNKNOWN
Post-slew image of 15-350 keV band
Time interval of the image:
117.300600 963.147900

# RAcent  DECcent POSerr Theta    Phi  PeakCts   SNR AngSep     Name
#  [deg]    [deg]    ['] [deg]  [deg]                   [']
135.4526 -40.5070    3.8  36.9   39.6   3.4563   3.0    4.5	Vela X-1
170.3418 -60.6207   26.6  35.3   90.4   0.6311   0.4    0.8	Cen X-3
186.3189 -62.8209   10.5  38.9  102.0  -2.1218  -1.1    9.8	GX 301-2
183.1067 -59.0897    2.5  40.8   96.4  11.0182   4.7 ------	UNKNOWN
157.0866 -76.5499    3.9  23.4  114.4   2.5945   3.0 ------	UNKNOWN
128.7830 -63.4427    3.0  17.9   70.7   2.8374   3.8 ------	UNKNOWN
 57.4225 -77.6226    4.1  14.9  172.0   1.5553   2.8 ------	UNKNOWN
330.0819 -45.0329    2.9  59.2 -164.9  20.4140   3.9 ------	UNKNOWN