Analysis Summary
Notes:
- 1) No attempt has been made to eliminate the non-significant decimal places.
- 2) This batgrbproduct analysis is done using the HEASARC data.
- 3) This batgrbproduct analysis is using the flight position for the mask-weighting calculation.
======================================================================
                  BAT GRB EVENT DATA PROCESSING REPORT
    Process Script Ver: batgrbproduct v2.48
    Process Start Time: Fri Jul 29 23:31:18 EDT 2022
             Host Name: batproc1
   Current Working Dir: /local/data/bat1/alien/Swift_3rdBATcatalog/event/batevent_reproc/trigger1044236
======================================================================

  Trigger: 01044236      Segment: 000

  BAT Trigger Time: 640567696   [s; MET]
      Trigger Stop: 640567760   [s; MET]
               UTC: 2021-04-19T23:27:49.124960    [includes UTCF correction]
       Where From?: TDRSS position message

  BAT
    RA: 212.967782252655   Dec: 35.9985418752642  [deg; J2000]

     Catalogged Source?: NO
     Point Source?:      YES
     GRB Indicated?:     YES    [ by BAT flight software ]
     Image S/N Ratio:    12.81
     Image Trigger?:     YES
     Rate S/N Ratio:     0  [ if not an image trigger ]
     Image S/N Ratio:    12.81

  Analysis Position:   [ source = BAT ]
    RA: 212.967782252655   Dec: 35.9985418752642  [deg; J2000]

  Refined Position:   [ source = BAT pre-slew burst ]
    RA: 212.961104221361   Dec: 35.9952863248875  [deg; J2000]
        { 14h 11m 50.7s , +35d 59' 43.0" }
         +/- 1.69728304086601 [arcmin] (estimated 90% radius based on SNR)
         +/- 1.02883628737264 [arcmin] (formal 1-sigma fit error)
    SNR: 14.2855837531291

  Angular difference between the analysis and refined position is 0.378473 arcmin

  Partial Coding Fraction: 0.71875    [ including projection effects ]

  Duration
     T90: 54.4919998645782 +/- 12.0104655973999
        Measured from: 26.2640000581741
                   to: 80.7559999227524     [s; relative to TRIGTIME]
     T50: 16.7919999361038 +/- 10.5560464329482
        Measured from: 40.8159999847412
                   to: 57.607999920845     [s; relative to TRIGTIME]


  Fluence
     Peak Flux  (peak 1 second)
        Measured from: 47.972000002861
                   to: 48.972000002861     [s; relative to TRIGTIME]
     Total Fluence
        Measured from: 11.960000038147
                   to: 88.7799999713898     [s; relative to TRIGTIME]

             Band 1     Band 2     Band 3     Band 4
              15-25      25-50     50-100    100-350     keV
 Total     0.692219   0.681621   0.182173   0.071353
           0.065066   0.066559   0.057263   0.049632 [error]
 Peak      0.031525   0.041424   0.016436   0.001344
           0.007691   0.007958   0.006823   0.005429 [error]

     [ fluence units of on-axis counts / fully illuminated detector ]

======================================================================


====== Table of the duration information =============================

        Value   tstart    tstop
T100   76.820   11.960   88.780
T90    54.492   26.264   80.756
T50    16.792   40.816   57.608
Peak    1.000   47.972   48.972


====== Spectral Analysis Summary =====================================

Model      : spectral model: simple power-law (PL) and cutoff power-law (CPL)
Ph_index   : photon index: E^{Ph_index}
Ph_90err   : 90% error of the photon index
Epeak      : Epeak in keV
Epeak_90err: 90% error of Epeak
Norm       : normalization at 50 keV in both the PL model and CPL model
Nomr_90err : 90% error of the normalization
chi2       : Chi-Squared
dof        : degree of freedo

=== Time-averaged spectral analysis ===
(Best model with acceptable fit: N/A)

Model Ph_index Ph_90err_low Ph_90err_hi  Epeak  Epeak_90err_low  Epeak_90err_hi  Norm       Nomr_90err_low    Norm_90err_hi    chi2    dof
PL      -2.426    -0.272      0.245       -           -               -         1.04e-03     -2.01e-04          1.97e-04      56.590   57
CPL     -1.611    -0.398      1.411       17.562     -15.070        14.676      3.33e-03     -1.80e-03          2.28e-02      55.040   56


=== 1-s peak spectral analysis ===
(Best model with acceptable fit: N/A)

Model Ph_index Ph_90err_low Ph_90err_hi  Epeak  Epeak_90err_low  Epeak_90err_hi  Norm       Nomr_90err_low    Norm_90err_hi    chi2    dof
PL      -1.877     -0.484     0.437       -           -               -         5.78e-03     -1.71e-03          1.60e-03      76.210   57
CPL     -1.878     -0.484     0.599     9999.150    -9999.140      -9999.150      5.77e-03     -3.87e-03          2.39e-02      76.210   56


=== Fluence/Peak Flux Summary ===

              Model    Band1     Band2     Band3     Band4     Band5     Total
                       15-25     25-50    50-100    100-350    15-150    15-350    keV
Fluence         PL   2.45e-07  2.57e-07  1.91e-07  2.31e-07  7.82e-07  9.24e-07   erg/cm2
      90%_error_low -3.62e-08 -3.41e-08 -4.87e-08 -9.54e-08 -1.14e-07 -1.70e-07   erg/cm2
      90%_error_hi   3.68e-08  3.34e-08  5.20e-08  1.33e-07  1.18e-07  1.98e-07   erg/cm2
Peak flux       PL   3.42e-01  2.76e-01  1.50e-01  1.20e-01  8.21e-01  8.87e-01   ph/cm2/s
      90%_error_low -1.18e-01 -6.44e-02 -5.65e-02 -6.95e-02 -1.93e-01 -2.09e-01   ph/cm2/s
      90%_error_hi   1.24e-01  6.44e-02  5.67e-02  1.10e-01  1.93e-01  2.10e-01   ph/cm2/s

Fluence        CPL   2.35e-07  2.80e-07  1.69e-07  5.46e-08  7.24e-07  7.39e-07   erg/cm2
      90%_error_low -4.02e-08 -4.19e-08 -6.52e-08 -4.73e-08 -1.19e-07 -1.32e-07   erg/cm2
      90%_error_hi   3.87e-08  4.73e-08  6.26e-08  1.58e-07  1.32e-07  2.14e-07   erg/cm2
Peak flux      CPL   3.21e-01  2.16e-01  9.87e-02  7.33e-02  6.66e-01  7.11e-01   ph/cm2/s
      90%_error_low -1.42e-01 -9.46e-02 -9.87e-02 -7.33e-02 -2.92e-01 -3.16e-01   ph/cm2/s
      90%_error_hi   1.36e-01  1.25e-01  3.75e-02  4.92e-02  4.76e-01  3.66e-01   ph/cm2/s

======================================================================
Image
Pre-slew 15.0-350.0 keV image (Event data)
#   RAcent    DECcent   POSerr    Theta     Phi              Peak Cts       SNR   Name
  212.9611    35.9953   0.0134    32.4196   -22.1333         1.6556148     14.286 TRIG_01044236

Foreground time interval of the image:
 11.960  72.501 (delta_t =  60.541 [sec])
Background time interval of the image:
-203.899  11.960 (delta_t = 215.859 [sec])
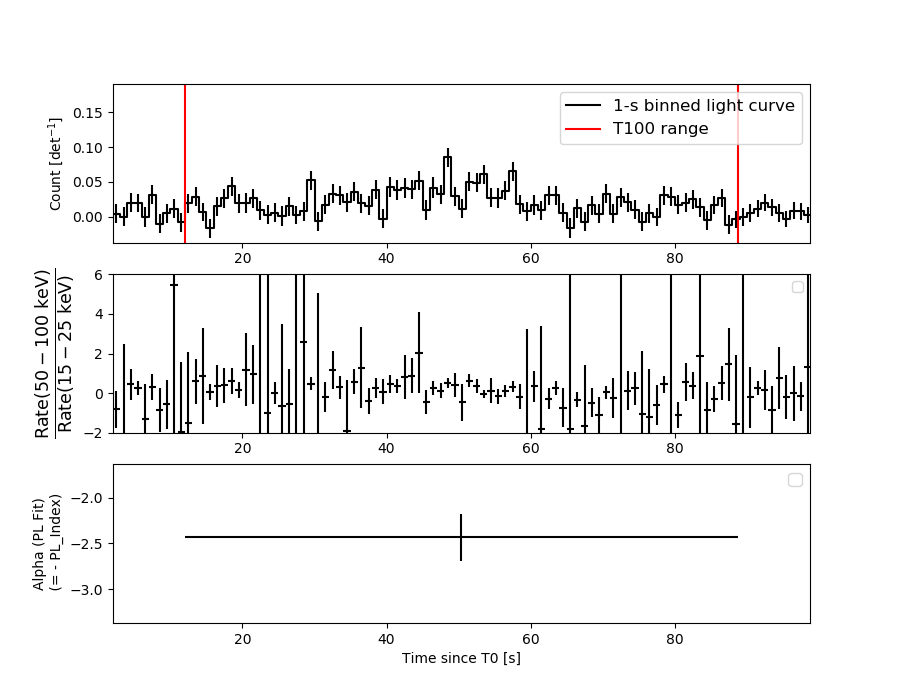
Light Curves
Note: The mask-weighted lightcurves have units of either count/det or counts/sec/det, where a det is 0.4 x 0.4 = 0.16 sq cm.
Full-time range; 1 s binning
Other quick-look light curves:
- 64 ms binning (zoomed)
- 16 ms binning (zoomed)
- 8 ms binning (zoomed)
- 2 ms binning (zoomed)
- SN=5 or 10 s binning (full-time range)
- Raw light curve
Spectra
- 64 ms binning (zoomed)
- 16 ms binning (zoomed)
- 8 ms binning (zoomed)
- 2 ms binning (zoomed)
- SN=5 or 10 s binning (full-time range)
- Raw light curve
Spectra
Notes:
- 1) The fitting includes the systematic errors.
- 2) When the burst includes telescope slew time periods, the fitting uses an average response file made from multiple 5-s response files through out the slew time plus single time preiod for the non-slew times, and weighted by the total counts in the corresponding time period using addrmf. An average response file is needed becuase a spectral fit using the pre-slew DRM will introduce some errors in both a spectral shape and a normalization if the PHA file contains a lot of the slew/post-slew time interval.
- 3) For fits to more complicated models (e.g. a power-law over a cutoff power-law), the BAT team has decided to require a chi-square improvement of more than 6 for each extra dof.
Time averaged spectrum fit using the average DRM
Power-law model
Time interval is from   11.960 sec. to   88.780 sec.

Spectral model in power-law:
------------------------------------------------------------
Parameters  : value       lower 90%   higher 90%
Photon index: -2.4257     ( -0.272017   0.245422 )
Norm@50keV  : 1.03667E-03    ( -0.000200566   0.000197202 )
------------------------------------------------------------
#Fit statistic  : Chi-Squared                   56.59     using 59 bins.
 Reduced chi-squared = 0.992807
# Null hypothesis probability of 4.91e-01 with 57 degrees of freedom

Photon flux (15-150 keV)    in 76.82 sec: 0.194760 ( -0.022761  0.022761 ) ph/cm2/s
Energy fluence (15-150 keV)             : 7.81674e-07 ( -1.13877e-07  1.17956e-07 ) ergs/cm2
Cutoff power-law model
Time interval is from   11.960 sec. to   88.780 sec.
Spectral model in the cutoff power-law:
------------------------------------------------------------
Parameters  : value       lower 90%   higher 90%
Photon index: -1.61098     ( -0.398179   1.41116 )
Epeak [keV] : 17.5623      ( -15.0695 14.6765 )
Norm@50keV  : 3.33265E-03    ( -0.00180141   0.0228322 )
------------------------------------------------------------
#Fit statistic  : Chi-Squared                   55.04     using 59 bins.
 Reduced chi-squared = 0.982857
# Null hypothesis probability of 5.11e-01 with 56 degrees of freedom

Photon flux (15-150 keV)    in 76.82 sec: 0.189889 ( -0.023447  0.023577 ) ph/cm2/s
Energy fluence (15-150 keV)             : 7.2416e-07 ( -1.18743e-07  1.32097e-07 ) ergs/cm2
1-s peak spectrum fit
Power-law model
Time interval is from   47.972 sec. to   48.972 sec.

Spectral model in power-law:
------------------------------------------------------------
Parameters  : value       lower 90%   higher 90%
Photon index: -1.87677     ( -0.483855   0.436885 )
Norm@50keV  : 5.77815E-03    ( -0.00170785   0.0015984 )
------------------------------------------------------------
#Fit statistic  : Chi-Squared                   76.21     using 59 bins.
 Reduced chi-squared = 1.33702
# Null hypothesis probability of 4.55e-02 with 57 degrees of freedom

Photon flux (15-150 keV)    in 1 sec: 0.821217 ( -0.192549  0.192673 ) ph/cm2/s
Energy fluence (15-150 keV)             : 5.31276e-08 ( -1.48134e-08  1.52935e-08 ) ergs/cm2
Cutoff power-law model
Time interval is from   47.972 sec. to   48.972 sec.
Spectral model in the cutoff power-law:
------------------------------------------------------------
Parameters  : value       lower 90%   higher 90%
Photon index: -2.26113     ( -0.483741   0.598576 )
Epeak [keV] : 100.789      ( -9999.32 -9999.33 )
Norm@50keV  : 3.56048E-03    ( -0.00167181   0.026067 )
------------------------------------------------------------
#Fit statistic  : Chi-Squared                   75.78     using 59 bins.
 Reduced chi-squared = 1.35321
# Null hypothesis probability of 4.03e-02 with 56 degrees of freedom

Photon flux (15-150 keV)    in 1 sec: 0.665916 ( -0.29162  0.475754 ) ph/cm2/s
Energy fluence (15-150 keV)             : 4.8463e-08 ( -2.09435e-08  1.51169e-08 ) ergs/cm2
Time-resolved spectra
Distribution
T90 vs. Hardness ratio plot
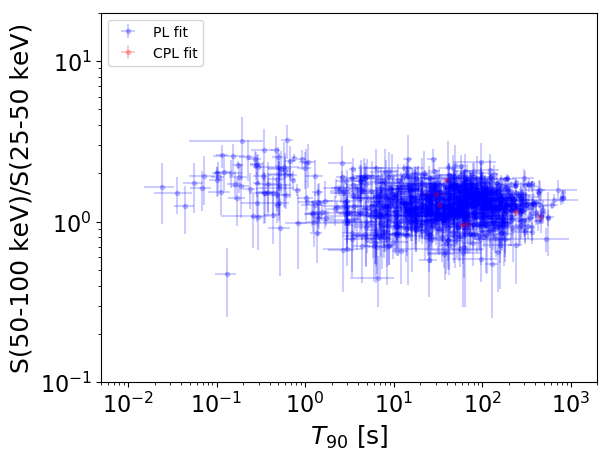
T90                                   = N/A sec.
Hardness ratio (energy fluence ratio) = N/A
S(15-50 keV) vs. S(50-150 keV) plot
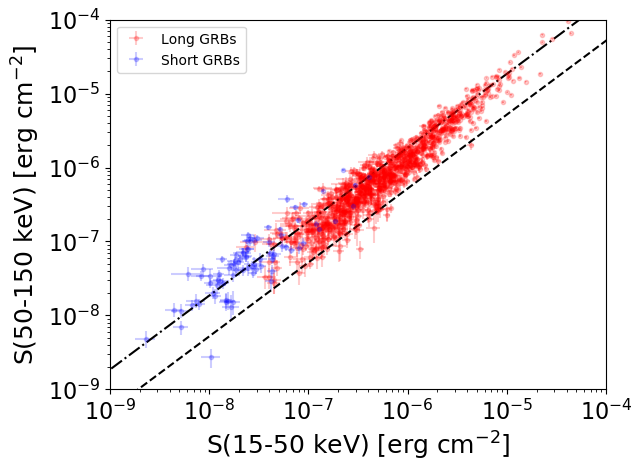
S(15-50 keV)  = N/A
S(50-150 keV) = N/A
The dash-dotted line and the dashed line traces the fluences calculated from the Band function with Epeak = 15 and 150 keV, respectively. Both lines assume a canonical values of alpha = -1 and beta = -2.5.
Mask shadow pattern
IMX = 5.882977985748454E-01, IMY = 2.392812365451210E-01
Spacecraft aspect plot
Bright source in the pre-burst/pre-slew/post-slew images
Pre-burst image of 15-350 keV band
Time interval of the image:
-203.899390 11.960000

# RAcent  DECcent POSerr Theta    Phi  PeakCts   SNR AngSep     Name
#  [deg]    [deg]    ['] [deg]  [deg]                   [']
161.3357  23.4290    3.0  32.3 -116.0   1.4078   3.8 ------	UNKNOWN
Pre-slew background subtracted image of 15-350 keV band
Time interval of the image:
11.960000 72.500590

# RAcent  DECcent POSerr Theta    Phi  PeakCts   SNR AngSep     Name
#  [deg]    [deg]    ['] [deg]  [deg]                   [']
183.3775 -12.3301    2.9  23.7  146.6   0.4245   4.0 ------	UNKNOWN
217.9949  35.5287    2.6  35.0  -16.3   0.5639   4.4 ------	UNKNOWN
212.9611  35.9954    0.8  32.4  -22.1   1.6548  14.3 ------	UNKNOWN
228.8389  41.2229    2.4  45.2  -15.3   0.8059   4.8 ------	UNKNOWN
154.2576  18.6884    1.7  37.6 -126.8   1.1509   6.6 ------	UNKNOWN
149.1931  26.6425    2.2  43.8 -116.2   2.1575   5.2 ------	UNKNOWN
Post-slew image of 15-350 keV band
Time interval of the image:
136.100600 408.100600

# RAcent  DECcent POSerr Theta    Phi  PeakCts   SNR AngSep     Name
#  [deg]    [deg]    ['] [deg]  [deg]                   [']
254.5446  35.4389   73.8  33.5  -18.0   0.0500   0.2    7.2	Her X-1
209.3279  14.7456    2.5  21.5   93.3   1.4814   4.6 ------	UNKNOWN
213.1117  39.3191    2.7   3.3  -94.4   0.9888   4.3 ------	UNKNOWN
275.1574  23.9230    2.3  54.3  -11.8   3.8642   5.1 ------	UNKNOWN
141.2798  48.3952    3.7  52.5 -148.9   2.5935   3.1 ------	UNKNOWN
270.0378  63.6232    2.8  43.8  -63.7   4.6163   4.1 ------	UNKNOWN