Analysis Summary
Notes:
- 1) No attempt has been made to eliminate the non-significant decimal places.
- 2) This batgrbproduct analysis is done using the HEASARC data.
- 3) This batgrbproduct analysis is using the flight position for the mask-weighting calculation.
======================================================================
BAT GRB EVENT DATA PROCESSING REPORT
Process Script Ver: batgrbproduct v2.48
Process Start Time: Fri Jul 29 23:29:00 EDT 2022
Host Name: batproc1
Current Working Dir: /local/data/bat1/alien/Swift_3rdBATcatalog/event/batevent_reproc/trigger1044382
======================================================================
Trigger: 01044382 Segment: 000
BAT Trigger Time: 640636504 [s; MET]
Trigger Stop: 640636568 [s; MET]
UTC: 2021-04-20T18:34:37.120380 [includes UTCF correction]
Where From?: TDRSS position message
BAT
RA: 254.360983528566 Dec: 42.5571753858575 [deg; J2000]
Catalogged Source?: NO
Point Source?: YES
GRB Indicated?: YES [ by BAT flight software ]
Image S/N Ratio: 8.66
Image Trigger?: YES
Rate S/N Ratio: 0 [ if not an image trigger ]
Image S/N Ratio: 8.66
Analysis Position: [ source = BAT ]
RA: 254.360983528566 Dec: 42.5571753858575 [deg; J2000]
Refined Position: [ source = BAT pre-slew burst ]
RA: 254.319248237532 Dec: 42.5675160368958 [deg; J2000]
{ 16h 57m 16.6s , +42d 34' 03.1" }
+/- 2.13658210707974 [arcmin] (estimated 90% radius based on SNR)
+/- 1.09994493449598 [arcmin] (formal 1-sigma fit error)
SNR: 10.2823030220112
Angular difference between the analysis and refined position is 1.945947 arcmin
Partial Coding Fraction: 0.7734375 [ including projection effects ]
Duration
T90: 158.160000085831 +/- 29.6897030356576
Measured from: -12.8400000333786
to: 145.320000052452 [s; relative to TRIGTIME]
T50: 74.0640000104904 +/- 19.7721242218422
Measured from: 14.8880000114441
to: 88.9520000219345 [s; relative to TRIGTIME]
Fluence
Peak Flux (peak 1 second)
Measured from: 21.0199999809265
to: 22.0199999809265 [s; relative to TRIGTIME]
Total Fluence
Measured from: -21.3040000200272
to: 160.136000037193 [s; relative to TRIGTIME]
Band 1 Band 2 Band 3 Band 4
15-25 25-50 50-100 100-350 keV
Total 0.627133 0.872941 0.742785 0.193734
0.089420 0.091601 0.080209 0.069551 [error]
Peak 0.024451 0.018113 0.010655 0.002775
0.007125 0.007115 0.006145 0.005552 [error]
[ fluence units of on-axis counts / fully illuminated detector ]
======================================================================
====== Table of the duration information =============================
Value tstart tstop
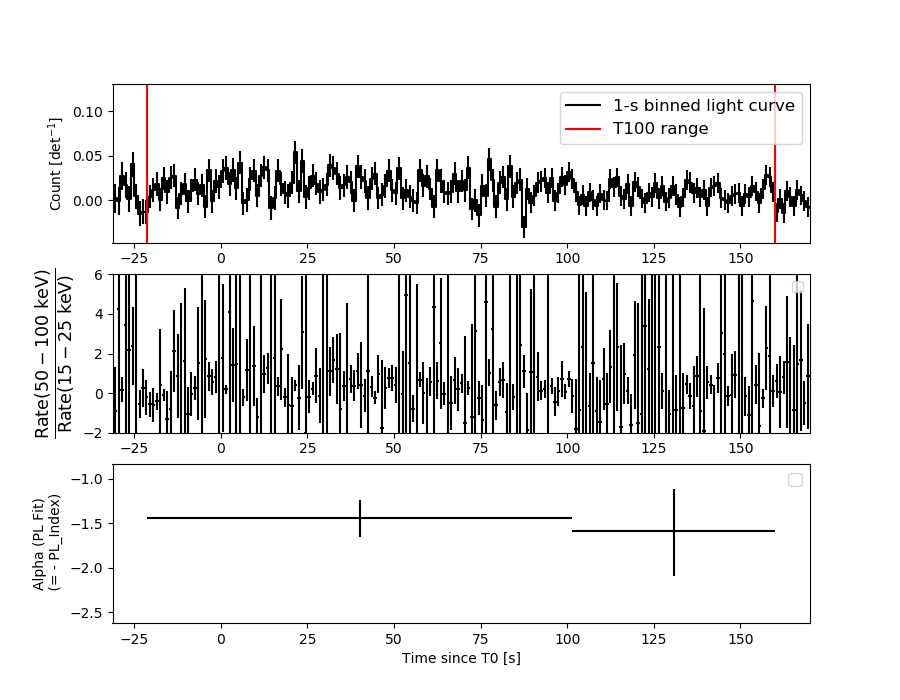
T100 181.440 -21.304 160.136
T90 158.160 -12.840 145.320
T50 74.064 14.888 88.952
Peak 1.000 21.020 22.020
====== Spectral Analysis Summary =====================================
Model : spectral model: simple power-law (PL) and cutoff power-law (CPL)
Ph_index : photon index: E^{Ph_index}
Ph_90err : 90% error of the photon index
Epeak : Epeak in keV
Epeak_90err: 90% error of Epeak
Norm : normalization at 50 keV in both the PL model and CPL model
Nomr_90err : 90% error of the normalization
chi2 : Chi-Squared
dof : degree of freedo
=== Time-averaged spectral analysis ===
(Best model with acceptable fit: N/A)
Model Ph_index Ph_90err_low Ph_90err_hi Epeak Epeak_90err_low Epeak_90err_hi Norm Nomr_90err_low Norm_90err_hi chi2 dof
PL -1.471 -0.191 0.189 - - - 8.73e-04 -9.81e-05 9.75e-05 48.100 57
CPL -0.963 -0.638 0.924 101.999 -37.881 -101.999 1.58e-03 -7.72e-04 2.74e-03 46.790 56
=== 1-s peak spectral analysis ===
(Best model with acceptable fit: N/A)
Model Ph_index Ph_90err_low Ph_90err_hi Epeak Epeak_90err_low Epeak_90err_hi Norm Nomr_90err_low Norm_90err_hi chi2 dof
PL -2.119 -0.934 0.679 - - - 3.16e-03 -1.71e-03 1.51e-03 61.870 57
CPL -2.219 -1.008 3.113 95.098 N/A N/A 2.67e-03 N/A N/A 61.810 56
=== Fluence/Peak Flux Summary ===
Model Band1 Band2 Band3 Band4 Band5 Total
15-25 25-50 50-100 100-350 15-150 15-350 keV
Fluence PL 1.97e-07 3.68e-07 5.31e-07 1.63e-06 1.51e-06 2.72e-06 erg/cm2
90%_error_low -3.55e-08 -4.21e-08 -7.74e-08 -4.53e-07 -1.86e-07 -5.23e-07 erg/cm2
90%_error_hi 3.72e-08 4.18e-08 7.69e-08 5.59e-07 1.89e-07 6.10e-07 erg/cm2
Peak flux PL 2.37e-01 1.66e-01 7.62e-02 4.90e-02 5.02e-01 5.28e-01 ph/cm2/s
90%_error_low -1.08e-01 -6.09e-02 -4.90e-02 -4.90e-02 -1.70e-01 -1.82e-01 ph/cm2/s
90%_error_hi 1.15e-01 5.74e-02 5.23e-02 9.07e-02 1.70e-01 1.84e-01 ph/cm2/s
Fluence CPL 1.81e-07 3.88e-07 5.48e-07 7.86e-07 1.45e-06 1.90e-06 erg/cm2
90%_error_low -4.30e-08 -5.11e-08 -8.38e-08 -4.86e-07 -2.05e-07 -5.30e-07 erg/cm2
90%_error_hi 4.37e-08 5.32e-08 8.58e-08 9.99e-07 2.07e-07 1.04e-06 erg/cm2
Peak flux CPL 2.27e-01 1.12e-01 3.14e-02 1.41e-02 3.84e-01 4.02e-01 ph/cm2/s
90%_error_low -1.21e-01 -1.12e-01 -3.14e-02 -1.41e-02 -2.08e-01 -2.96e-01 ph/cm2/s
90%_error_hi 1.21e-01 1.23e-01 8.26e-02 7.93e-02 2.82e-01 3.08e-01 ph/cm2/s
======================================================================
Image
Pre-slew 15.0-350.0 keV image (Event data)
#   RAcent    DECcent   POSerr    Theta     Phi              Peak Cts       SNR   Name
  254.3192    42.5675   0.0188    27.0766    11.9744         1.4358452     10.282 TRIG_01044382

Foreground time interval of the image:
-14.299  74.301 (delta_t =  88.600 [sec])
Background time interval of the image:
Light Curves
Note: The mask-weighted lightcurves have units of either count/det or counts/sec/det, where a det is 0.4 x 0.4 = 0.16 sq cm.
Full-time range; 1 s binning
Other quick-look light curves:
- 64 ms binning (zoomed)
- 16 ms binning (zoomed)
- 8 ms binning (zoomed)
- 2 ms binning (zoomed)
- SN=5 or 10 s binning (full-time range)
- Raw light curve
Spectra
- 64 ms binning (zoomed)
- 16 ms binning (zoomed)
- 8 ms binning (zoomed)
- 2 ms binning (zoomed)
- SN=5 or 10 s binning (full-time range)
- Raw light curve
Spectra
Notes:
- 1) The fitting includes the systematic errors.
- 2) When the burst includes telescope slew time periods, the fitting uses an average response file made from multiple 5-s response files through out the slew time plus single time preiod for the non-slew times, and weighted by the total counts in the corresponding time period using addrmf. An average response file is needed becuase a spectral fit using the pre-slew DRM will introduce some errors in both a spectral shape and a normalization if the PHA file contains a lot of the slew/post-slew time interval.
- 3) For fits to more complicated models (e.g. a power-law over a cutoff power-law), the BAT team has decided to require a chi-square improvement of more than 6 for each extra dof.
Time averaged spectrum fit using the average DRM
Power-law model
Time interval is from  -21.304 sec. to  160.136 sec.

Spectral model in power-law:
------------------------------------------------------------
Parameters  : value       lower 90%   higher 90%
Photon index: -1.47066     ( -0.191135   0.18924 )
Norm@50keV  : 8.73005E-04    ( -9.80937e-05   9.75057e-05 )
------------------------------------------------------------
#Fit statistic  : Chi-Squared                   48.10     using 59 bins.
 Reduced chi-squared = 0.84386
# Null hypothesis probability of 7.93e-01 with 57 degrees of freedom

Photon flux (15-150 keV)    in 181.4 sec: 0.108151 ( -0.0119674  0.011983 ) ph/cm2/s
Energy fluence (15-150 keV)             : 1.51e-06 ( -1.8643e-07  1.88545e-07 ) ergs/cm2
Cutoff power-law model

Time interval is from  -21.304 sec. to  160.136 sec.
Spectral model in the cutoff power-law:
------------------------------------------------------------
Parameters  : value       lower 90%   higher 90%
Photon index: -0.963259     ( -0.637882   0.923551 )
Epeak [keV] : 101.999      ( -37.8818 -101.999 )
Norm@50keV  : 1.57717E-03    ( -0.000771777   0.00274121 )
------------------------------------------------------------
#Fit statistic  : Chi-Squared                   46.79     using 59 bins.
 Reduced chi-squared = 0.835536
# Null hypothesis probability of 8.05e-01 with 56 degrees of freedom

Photon flux (15-150 keV)    in 181.4 sec: 0.105752 ( -0.0124863  0.012505 ) ph/cm2/s
Energy fluence (15-150 keV)             : 1.45217e-06 ( -2.05454e-07  2.0691e-07 ) ergs/cm2
1-s peak spectrum fit
Power-law model
Time interval is from   21.020 sec. to   22.020 sec.

Spectral model in power-law:
------------------------------------------------------------
Parameters  : value       lower 90%   higher 90%
Photon index: -2.11944     ( -0.933715   0.678538 )
Norm@50keV  : 3.16189E-03    ( -0.0017101   0.00150599 )
------------------------------------------------------------
#Fit statistic  : Chi-Squared                   61.87     using 59 bins.
 Reduced chi-squared = 1.08544
# Null hypothesis probability of 3.06e-01 with 57 degrees of freedom

Photon flux (15-150 keV)    in 1 sec: 0.502319 ( -0.169728  0.169737 ) ph/cm2/s
Energy fluence (15-150 keV)             : 2.94408e-08 ( -1.26493e-08  1.36416e-08 ) ergs/cm2
Cutoff power-law model

Time interval is from   21.020 sec. to   22.020 sec.
Spectral model in the cutoff power-law:
------------------------------------------------------------
Parameters  : value       lower 90%   higher 90%
Photon index: -2.89151     ( -0.333503   3.78773 )
Epeak [keV] : 281.185      (   )
Norm@50keV  : 1.33891E-03    (     )
------------------------------------------------------------
#Fit statistic  : Chi-Squared                   61.61     using 59 bins.
 Reduced chi-squared = 1.10018
# Null hypothesis probability of 2.82e-01 with 56 degrees of freedom

Photon flux (15-150 keV)    in 1 sec: 0.384059 ( -0.207679  0.281689 ) ph/cm2/s
Energy fluence (15-150 keV)             : 2.98119e-08 ( -1.01842e-08  1.1395e-08 ) ergs/cm2
Time-resolved spectra
Distribution
T90 vs. Hardness ratio plot
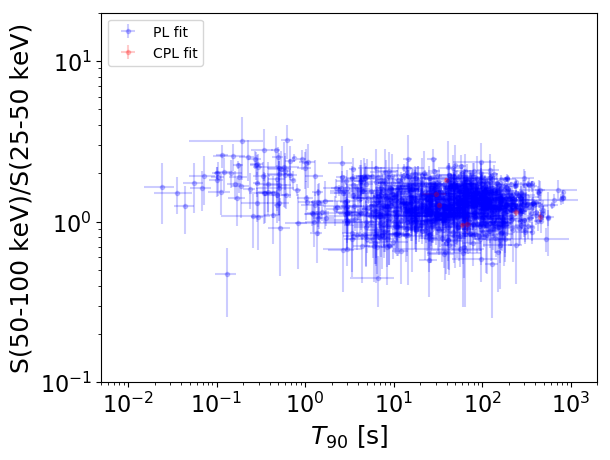
T90                                   = N/A sec.
Hardness ratio (energy fluence ratio) = N/A
S(15-50 keV) vs. S(50-150 keV) plot
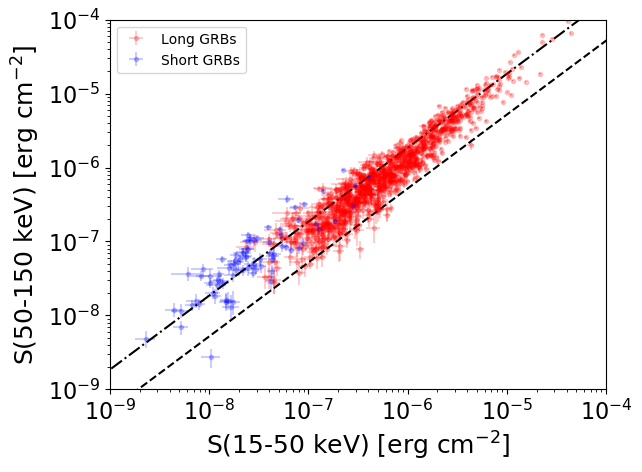
S(15-50 keV)  = N/A
S(50-150 keV) = N/A
The dash-dotted line and the dashed line traces the fluences calculated from the Band function with Epeak = 15 and 150 keV, respectively. Both lines assume a canonical values of alpha = -1 and beta = -2.5.
Mask shadow pattern
IMX = 5.000862298625791E-01, IMY = -1.060633959254108E-01
Spacecraft aspect plot
Bright source in the pre-burst/pre-slew/post-slew images
Pre-burst image of 15-350 keV band
Time interval of the image:
Pre-slew background subtracted image of 15-350 keV band
Time interval of the image:
-14.299400 74.300600

# RAcent  DECcent POSerr Theta    Phi  PeakCts   SNR AngSep     Name
#  [deg]    [deg]    ['] [deg]  [deg]                   [']
254.5784  35.3883    3.5  32.9   20.4   0.5732   3.3    6.5	Her X-1
299.4821  35.0340    6.7  55.8  -21.7   0.8595   1.8   11.4	Cyg X-1
254.3192  42.5675    1.1  27.1   12.0   1.4362  10.3 ------	UNKNOWN
110.4945  51.7444    2.6  55.3 -144.7   3.0987   4.4 ------	UNKNOWN
Post-slew image of 15-350 keV band
Time interval of the image:
124.300590 718.602900
721.000000 963.094800

# RAcent  DECcent POSerr Theta    Phi  PeakCts   SNR AngSep     Name
#  [deg]    [deg]    ['] [deg]  [deg]                   [']
254.4023  35.2971    7.1   7.3   41.2   0.9663   1.6    3.8	Her X-1
268.3934  -1.3997    8.4  45.7   21.7   1.6885   1.4    3.5	SW J1753.5-0127
288.8918  11.0169   11.2  43.5  -12.4   1.1408   1.0    7.0	GRS 1915+105
299.6124  35.2361    1.7  35.5  -52.1   7.0063   6.8    2.3	Cyg X-1
308.1752  40.9278    5.0  39.5  -65.0   3.9160   2.3    3.3	Cyg X-3
274.6911 -10.0521    2.9  55.8   17.1  11.4604   3.9 ------	UNKNOWN
272.8521  22.2216    3.6  25.5   -1.5   2.1259   3.2 ------	UNKNOWN
156.7287  60.9533    3.5  57.1 -173.5   8.3253   3.3 ------	UNKNOWN
306.8168  16.0796    2.8  51.8  -34.4   8.2587   4.0 ------	UNKNOWN