Analysis Summary
Notes:
- 1) No attempt has been made to eliminate the non-significant decimal places.
- 2) This batgrbproduct analysis is done using the HEASARC data.
- 3) This batgrbproduct analysis is using the flight position for the mask-weighting calculation.
======================================================================
                  BAT GRB EVENT DATA PROCESSING REPORT
    Process Script Ver: batgrbproduct v2.48
    Process Start Time: Fri Jul 29 23:27:00 EDT 2022
             Host Name: batproc1
   Current Working Dir: /local/data/bat1/alien/Swift_3rdBATcatalog/event/batevent_reproc/trigger1044426
======================================================================

  Trigger: 01044426      Segment: 000

  BAT Trigger Time: 640657677.184   [s; MET]
      Trigger Stop: 640657679.232   [s; MET]
               UTC: 2021-04-21T00:27:30.302980    [includes UTCF correction]
       Where From?: TDRSS position message

  BAT
    RA: 104.908402667149   Dec: 4.93417169695035  [deg; J2000]

     Catalogged Source?: NO
     Point Source?:      YES
     GRB Indicated?:     YES    [ by BAT flight software ]
     Image S/N Ratio:    10.17
     Image Trigger?:     NO
     Rate S/N Ratio:     11.4455231422596  [ if not an image trigger ]
     Image S/N Ratio:    10.17

  Analysis Position:   [ source = BAT ]
    RA: 104.908402667149   Dec: 4.93417169695035  [deg; J2000]

  Refined Position:   [ source = BAT pre-slew burst ]
    RA: 104.88322254258   Dec: 4.92855764403151  [deg; J2000]
        { 06h 59m 32.0s , +04d 55' 42.8" }
         +/- 1.14388246263258 [arcmin] (estimated 90% radius based on SNR)
         +/- 0.476040365481007 [arcmin] (formal 1-sigma fit error)
    SNR: 25.1024654255154

  Angular difference between the analysis and refined position is 1.542445 arcmin

  Partial Coding Fraction: 0.4453125    [ including projection effects ]

  Duration
     T90: 79.1999999284744 +/- 26.8281989732373
        Measured from: -18.3359999656677
                   to: 60.8639999628067     [s; relative to TRIGTIME]
     T50: 15.808000087738 +/- 3.31756052546882
        Measured from: -7.53600001335144
                   to: 8.2720000743866     [s; relative to TRIGTIME]


  Fluence
     Peak Flux  (peak 1 second)
        Measured from: 2.46799993515015
                   to: 3.46799993515015     [s; relative to TRIGTIME]
     Total Fluence
        Measured from: -21.7439999580383
                   to: 73.2159999608994     [s; relative to TRIGTIME]

             Band 1     Band 2     Band 3     Band 4
              15-25      25-50     50-100    100-350     keV
 Total     1.529624   1.622713   0.698580   0.175097
           0.087951   0.090480   0.076335   0.064500 [error]
 Peak      0.073339   0.101636   0.051456   0.012165
           0.011255   0.012371   0.009740   0.007540 [error]

     [ fluence units of on-axis counts / fully illuminated detector ]

======================================================================


====== Table of the duration information =============================

        Value   tstart    tstop
T100   94.960  -21.744   73.216
T90    79.200  -18.336   60.864
T50    15.808   -7.536    8.272
Peak    1.000    2.468    3.468


====== Spectral Analysis Summary =====================================

Model      : spectral model: simple power-law (PL) and cutoff power-law (CPL)
Ph_index   : photon index: E^{Ph_index}
Ph_90err   : 90% error of the photon index
Epeak      : Epeak in keV
Epeak_90err: 90% error of Epeak
Norm       : normalization at 50 keV in both the PL model and CPL model
Nomr_90err : 90% error of the normalization
chi2       : Chi-Squared
dof        : degree of freedo

=== Time-averaged spectral analysis ===
(Best model with acceptable fit: N/A)

Model Ph_index Ph_90err_low Ph_90err_hi  Epeak  Epeak_90err_low  Epeak_90err_hi  Norm       Nomr_90err_low    Norm_90err_hi    chi2    dof
PL      -2.143    -0.133      0.128       -           -               -         2.44e-03     -2.13e-04          2.10e-04      63.710   57
CPL     -2.132    -0.145      0.119     9999.360      N/A           N/A         2.46e-03        N/A               N/A         63.760   56


=== 1-s peak spectral analysis ===
(Best model with acceptable fit: N/A)

Model Ph_index Ph_90err_low Ph_90err_hi  Epeak  Epeak_90err_low  Epeak_90err_hi  Norm       Nomr_90err_low    Norm_90err_hi    chi2    dof
PL      -1.905     -0.231     0.216       -           -               -         1.41e-02     -2.33e-03          2.28e-03      56.770   57
CPL     -0.108     -1.160     1.657       46.616      -8.185        13.645      1.42e-01     -1.42e-01          1.11e+00      48.770   56


=== Fluence/Peak Flux Summary ===

              Model    Band1     Band2     Band3     Band4     Band5     Total
                       15-25     25-50    50-100    100-350    15-150    15-350    keV
Fluence         PL   5.42e-07  6.75e-07  6.11e-07  9.62e-07  2.16e-06  2.79e-06   erg/cm2
      90%_error_low -5.17e-08 -4.57e-08 -7.27e-08 -2.08e-07 -1.67e-07 -2.97e-07   erg/cm2
      90%_error_hi   5.27e-08  4.57e-08  7.39e-08  2.44e-07  1.70e-07  3.22e-07   erg/cm2
Peak flux       PL   8.55e-01  6.78e-01  3.62e-01  2.81e-01  2.02e+00  2.18e+00   ph/cm2/s
      90%_error_low -1.66e-01 -9.76e-02 -7.43e-02 -9.46e-02 -2.93e-01 -3.14e-01   ph/cm2/s
      90%_error_hi   1.72e-01  9.76e-02  7.42e-02  1.16e-01  2.93e-01  3.15e-01   ph/cm2/s

Fluence        CPL    N/A      N/A      N/A      N/A      N/A      N/A      erg/cm2
      90%_error_low -5.17e-08 -4.57e-08 -7.27e-08 -2.08e-07 -1.67e-07 -2.97e-07   erg/cm2
      90%_error_hi   5.27e-08  4.57e-08  7.39e-08  2.44e-07  1.70e-07  3.22e-07   erg/cm2
Peak flux      CPL   7.04e-01  8.42e-01  3.88e-01  5.47e-02  1.98e+00  1.99e+00   ph/cm2/s
      90%_error_low -1.97e-01 -1.43e-01 -1.03e-01 -5.47e-02 -2.96e-01 -3.00e-01   ph/cm2/s
      90%_error_hi   2.00e-01  1.53e-01  9.63e-02  1.01e-01  2.96e-01  3.03e-01   ph/cm2/s

======================================================================
Image
Pre-slew 15.0-350.0 keV image (Event data)
#   RAcent    DECcent   POSerr    Theta     Phi              Peak Cts       SNR   Name
  104.8832     4.9286   0.0077    34.1798    24.9301         3.7244045     25.102 TRIG_01044426

Foreground time interval of the image:
-21.744  23.517 (delta_t =  45.261 [sec])
Background time interval of the image:
-239.184 -21.744 (delta_t = 217.440 [sec])
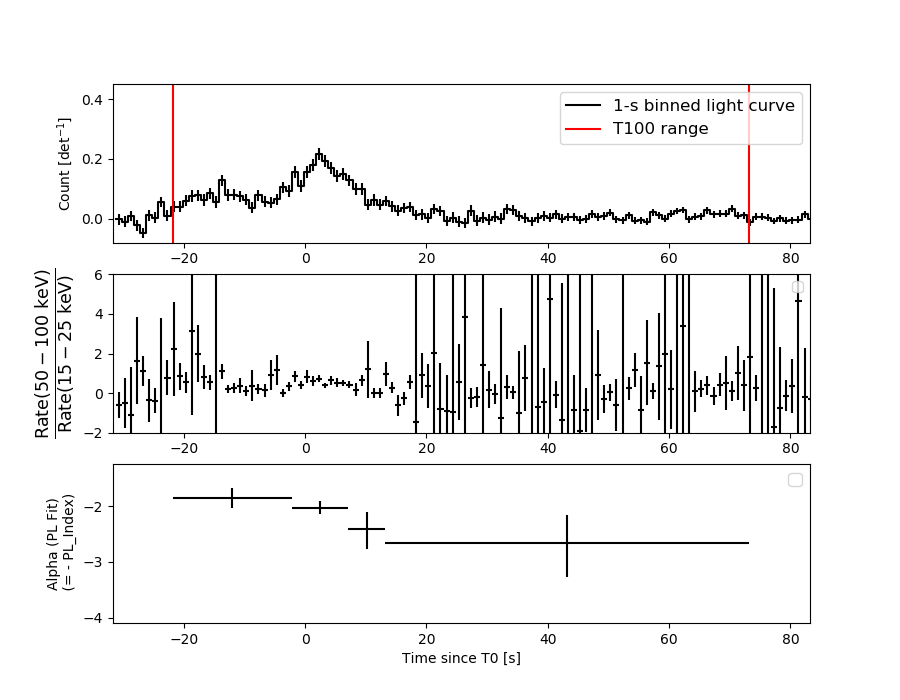
Light Curves
Note: The mask-weighted lightcurves have units of either count/det or counts/sec/det, where a det is 0.4 x 0.4 = 0.16 sq cm.
Full-time range; 1 s binning
Other quick-look light curves:
- 64 ms binning (zoomed)
- 16 ms binning (zoomed)
- 8 ms binning (zoomed)
- 2 ms binning (zoomed)
- SN=5 or 10 s binning (full-time range)
- Raw light curve
Spectra
- 64 ms binning (zoomed)
- 16 ms binning (zoomed)
- 8 ms binning (zoomed)
- 2 ms binning (zoomed)
- SN=5 or 10 s binning (full-time range)
- Raw light curve
Spectra
Notes:
- 1) The fitting includes the systematic errors.
- 2) When the burst includes telescope slew time periods, the fitting uses an average response file made from multiple 5-s response files through out the slew time plus single time preiod for the non-slew times, and weighted by the total counts in the corresponding time period using addrmf. An average response file is needed becuase a spectral fit using the pre-slew DRM will introduce some errors in both a spectral shape and a normalization if the PHA file contains a lot of the slew/post-slew time interval.
- 3) For fits to more complicated models (e.g. a power-law over a cutoff power-law), the BAT team has decided to require a chi-square improvement of more than 6 for each extra dof.
Time averaged spectrum fit using the average DRM
Power-law model
Time interval is from  -21.744 sec. to   73.216 sec.

Spectral model in power-law:
------------------------------------------------------------
Parameters  : value       lower 90%   higher 90%
Photon index: -2.14293     ( -0.133211   0.128413 )
Norm@50keV  : 2.43501E-03    ( -0.000212842   0.000209833 )
------------------------------------------------------------
#Fit statistic  : Chi-Squared                   63.71     using 59 bins.
 Reduced chi-squared = 1.11772
# Null hypothesis probability of 2.52e-01 with 57 degrees of freedom

Photon flux (15-150 keV)    in 94.96 sec: 0.391447 ( -0.026619  0.026638 ) ph/cm2/s
Energy fluence (15-150 keV)             : 2.15859e-06 ( -1.6732e-07  1.69503e-07 ) ergs/cm2
Cutoff power-law model
Time interval is from  -21.744 sec. to   73.216 sec.
Spectral model in the cutoff power-law:
------------------------------------------------------------
Parameters  : value       lower 90%   higher 90%
Photon index: -2.13245     ( -0.144751   0.119649 )
Epeak [keV] : 9999.36      (   )
Norm@50keV  : 2.45667E-03    (     )
------------------------------------------------------------
#Fit statistic  : Chi-Squared                   63.74     using 59 bins.
 Reduced chi-squared = 1.13821
# Null hypothesis probability of 2.23e-01 with 56 degrees of freedom

Photon flux (15-150 keV)    in 94.96 sec: 0.378954 ( -0.02844  0.028413 ) ph/cm2/s
Energy fluence (15-150 keV)             : 0 ( 0  0 ) ergs/cm2
1-s peak spectrum fit
Power-law model
Time interval is from    2.468 sec. to    3.468 sec.

Spectral model in power-law:
------------------------------------------------------------
Parameters  : value       lower 90%   higher 90%
Photon index: -1.9052     ( -0.231347   0.216109 )
Norm@50keV  : 1.40632E-02    ( -0.00232672   0.00228206 )
------------------------------------------------------------
#Fit statistic  : Chi-Squared                   56.77     using 59 bins.
 Reduced chi-squared = 0.995965
# Null hypothesis probability of 4.84e-01 with 57 degrees of freedom

Photon flux (15-150 keV)    in 1 sec: 2.02282 ( -0.29281  0.29293 ) ph/cm2/s
Energy fluence (15-150 keV)             : 1.29318e-07 ( -2.08829e-08  2.10966e-08 ) ergs/cm2
Cutoff power-law model
Time interval is from    2.468 sec. to    3.468 sec.
Spectral model in the cutoff power-law:
------------------------------------------------------------
Parameters  : value       lower 90%   higher 90%
Photon index: -0.108457     ( -1.16323   1.65311 )
Epeak [keV] : 46.6161      ( -8.16965 13.6602 )
Norm@50keV  : 0.142076    ( -0.142979   1.11356 )
------------------------------------------------------------
#Fit statistic  : Chi-Squared                   48.77     using 59 bins.
 Reduced chi-squared = 0.870893
# Null hypothesis probability of 7.42e-01 with 56 degrees of freedom

Photon flux (15-150 keV)    in 1 sec: 1.98206 ( -0.29618  0.29574 ) ph/cm2/s
Energy fluence (15-150 keV)             : 1.20224e-07 ( -2.09741e-08  2.1963e-08 ) ergs/cm2
Time-resolved spectra
Distribution
T90 vs. Hardness ratio plot
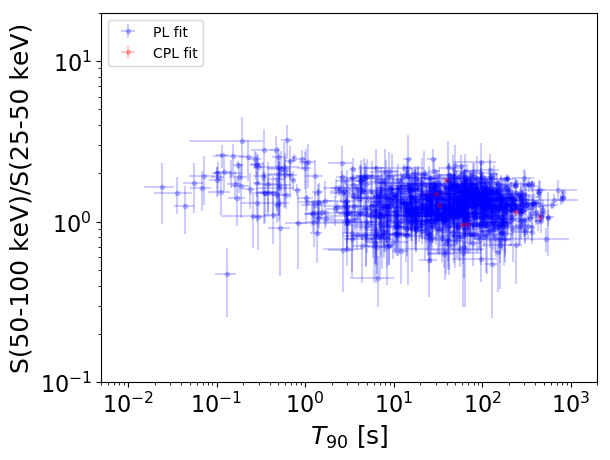
T90                                   = N/A sec.
Hardness ratio (energy fluence ratio) = N/A
S(15-50 keV) vs. S(50-150 keV) plot
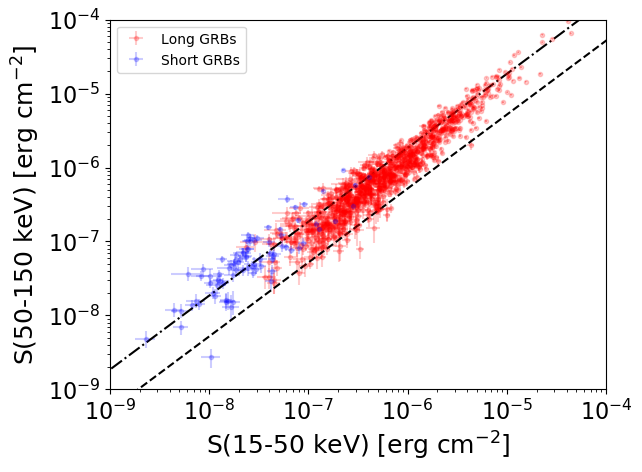
S(15-50 keV)  = N/A
S(50-150 keV) = N/A
The dash-dotted line and the dashed line traces the fluences calculated from the Band function with Epeak = 15 and 150 keV, respectively. Both lines assume a canonical values of alpha = -1 and beta = -2.5.
Mask shadow pattern
IMX = 6.158086990259720E-01, IMY = -2.862423554189181E-01
Spacecraft aspect plot
Bright source in the pre-burst/pre-slew/post-slew images
Pre-burst image of 15-350 keV band
Time interval of the image:
-239.184000 -21.744000

# RAcent  DECcent POSerr Theta    Phi  PeakCts   SNR AngSep     Name
#  [deg]    [deg]    ['] [deg]  [deg]                   [']
 83.6337  22.0220    0.6  44.0  -15.4   8.8795  20.7    0.5	Crab
 87.2798  19.2404    2.7  41.4  -10.1   1.5981   4.3 ------	UNKNOWN
Pre-slew background subtracted image of 15-350 keV band
Time interval of the image:
-21.744000 23.516590

# RAcent  DECcent POSerr Theta    Phi  PeakCts   SNR AngSep     Name
#  [deg]    [deg]    ['] [deg]  [deg]                   [']
 83.5217  22.0562   27.7  44.0  -15.5  -0.0666  -0.4    6.7	Crab
104.8832   4.9286    0.5  34.2   24.9   3.7252  25.1 ------	UNKNOWN
 32.0933 -55.5871    2.2  50.5 -161.0   1.0231   5.2 ------	UNKNOWN
 24.8496 -39.2538    2.3  52.2 -139.2   2.2571   5.1 ------	UNKNOWN
Post-slew image of 15-350 keV band
Time interval of the image:
77.116590 483.616600

# RAcent  DECcent POSerr Theta    Phi  PeakCts   SNR AngSep     Name
#  [deg]    [deg]    ['] [deg]  [deg]                   [']
 83.6311  22.0145    0.4  26.7  -59.1  16.6718  28.2    0.1	Crab
143.6054  -8.3299    3.7  40.8   98.0   4.9131   3.1 ------	UNKNOWN
145.2109   9.1288    6.7  40.2   70.9   3.1567   1.7 ------	UNKNOWN
122.1410 -41.3478    2.9  48.9  152.0   5.5198   4.0 ------	UNKNOWN
110.4368 -45.7212    3.3  50.9  164.2   5.2659   3.5 ------	UNKNOWN
 81.0799 -40.1381    4.0  50.1 -167.1   3.1660   2.9 ------	UNKNOWN
 84.4844  22.9084    2.8  26.7  -56.5   2.2305   4.1 ------	UNKNOWN
 66.1696 -40.3651    3.0  57.6 -156.4   8.7421   3.8 ------	UNKNOWN