Analysis Summary
Notes:
- 1) No attempt has been made to eliminate the non-significant decimal places.
- 2) This batgrbproduct analysis is done using the HEASARC data.
- 3) This batgrbproduct analysis is using the flight position for the mask-weighting calculation.
======================================================================
BAT GRB EVENT DATA PROCESSING REPORT
Process Script Ver: batgrbproduct v2.48
Process Start Time: Fri Jul 29 23:25:30 EDT 2022
Host Name: batproc1
Current Working Dir: /local/data/bat1/alien/Swift_3rdBATcatalog/event/batevent_reproc/trigger1044678
======================================================================
Trigger: 01044678 Segment: 000
BAT Trigger Time: 640806457.408 [s; MET]
Trigger Stop: 640806458.432 [s; MET]
UTC: 2021-04-22T17:47:10.517100 [includes UTCF correction]
Where From?: TDRSS position message
BAT
RA: 21.1388394372711 Dec: 42.1100322338717 [deg; J2000]
Catalogged Source?: NO
Point Source?: YES
GRB Indicated?: YES [ by BAT flight software ]
Image S/N Ratio: 8.15
Image Trigger?: NO
Rate S/N Ratio: 14.8996644257513 [ if not an image trigger ]
Image S/N Ratio: 8.15
Analysis Position: [ source = BAT ]
RA: 21.1388394372711 Dec: 42.1100322338717 [deg; J2000]
Refined Position: [ source = BAT pre-slew burst ]
RA: 21.079452806016 Dec: 42.1028144656682 [deg; J2000]
{ 01h 24m 19.1s , +42d 06' 10.1" }
+/- 2.12682330290029 [arcmin] (estimated 90% radius based on SNR)
+/- 1.15788035830628 [arcmin] (formal 1-sigma fit error)
SNR: 10.3497688701698
Angular difference between the analysis and refined position is 2.678777 arcmin
Partial Coding Fraction: 0.5390625 [ including projection effects ]
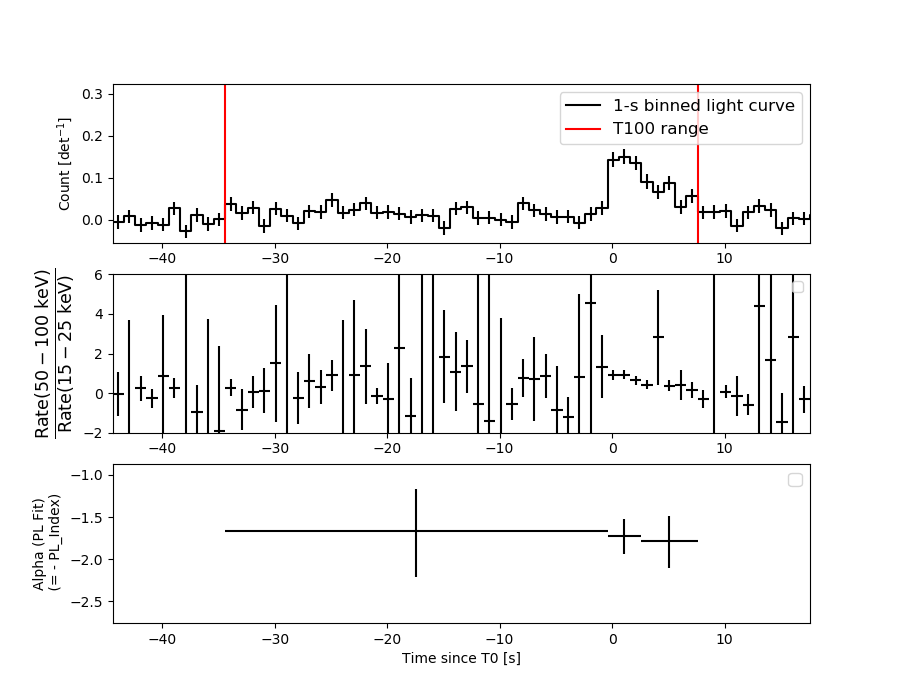
Duration
T90: 39 +/- 7.28010988928052
Measured from: -32.4079999923706
to: 6.59200000762939 [s; relative to TRIGTIME]
T50: 18 +/- 8.55862138431185
Measured from: -15.4079999923706
to: 2.59200000762939 [s; relative to TRIGTIME]
Fluence
Peak Flux (peak 1 second)
Measured from: 0.592000007629395
to: 1.59200000762939 [s; relative to TRIGTIME]
Total Fluence
Measured from: -34.4079999923706
to: 7.59200000762939 [s; relative to TRIGTIME]
Band 1 Band 2 Band 3 Band 4
15-25 25-50 50-100 100-350 keV
Total 0.385027 0.484361 0.349006 0.059659
0.055540 0.057343 0.050065 0.045411 [error]
Peak 0.052374 0.045534 0.049201 0.003406
0.009975 0.010040 0.008965 0.007213 [error]
[ fluence units of on-axis counts / fully illuminated detector ]
======================================================================
====== Table of the duration information =============================
Value tstart tstop
T100 42.000 -34.408 7.592
T90 39.000 -32.408 6.592
T50 18.000 -15.408 2.592
Peak 1.000 0.592 1.592
====== Spectral Analysis Summary =====================================
Model : spectral model: simple power-law (PL) and cutoff power-law (CPL)
Ph_index : photon index: E^{Ph_index}
Ph_90err : 90% error of the photon index
Epeak : Epeak in keV
Epeak_90err: 90% error of Epeak
Norm : normalization at 50 keV in both the PL model and CPL model
Nomr_90err : 90% error of the normalization
chi2 : Chi-Squared
dof : degree of freedo
=== Time-averaged spectral analysis ===
(Best model with acceptable fit: N/A)
Model Ph_index Ph_90err_low Ph_90err_hi Epeak Epeak_90err_low Epeak_90err_hi Norm Nomr_90err_low Norm_90err_hi chi2 dof
PL -1.736 -0.233 0.223 - - - 1.85e-03 -2.80e-04 2.74e-04 53.320 57
CPL -0.727 -0.914 1.134 57.300 -13.694 93.556 6.56e-03 -6.56e-03 1.99e-02 49.680 56
=== 1-s peak spectral analysis ===
(Best model with acceptable fit: N/A)
Model Ph_index Ph_90err_low Ph_90err_hi Epeak Epeak_90err_low Epeak_90err_hi Norm Nomr_90err_low Norm_90err_hi chi2 dof
PL -1.597 -0.348 0.328 - - - 1.01e-02 -2.03e-03 1.97e-03 48.760 57
CPL -1.568 -2.688 1.247 755.609 -755.609 -755.609 1.05e-02 -2.37e-03 -1.05e-02 48.780 56
=== Fluence/Peak Flux Summary ===
Model Band1 Band2 Band3 Band4 Band5 Total
15-25 25-50 50-100 100-350 15-150 15-350 keV
Fluence PL 1.24e-07 1.97e-07 2.37e-07 5.56e-07 7.18e-07 1.11e-06 erg/cm2
90%_error_low -2.34e-08 -2.59e-08 -4.72e-08 -1.94e-07 -1.11e-07 -2.48e-07 erg/cm2
90%_error_hi 2.43e-08 2.59e-08 4.77e-08 2.53e-07 1.14e-07 2.95e-07 erg/cm2
Peak flux PL 4.57e-01 4.34e-01 2.87e-01 2.95e-01 1.30e+00 1.47e+00 ph/cm2/s
90%_error_low -1.34e-01 -8.30e-02 -7.45e-02 -1.30e-01 -2.40e-01 -2.75e-01 ph/cm2/s
90%_error_hi 1.45e-01 8.20e-02 7.25e-02 1.78e-01 2.41e-01 2.77e-01 ph/cm2/s
Fluence CPL 1.10e-07 2.22e-07 2.40e-07 1.42e-07 6.64e-07 7.14e-07 erg/cm2
90%_error_low -2.77e-08 -3.40e-08 -5.50e-08 -9.78e-08 -1.14e-07 -1.52e-07 erg/cm2
90%_error_hi 2.77e-08 3.54e-08 5.43e-08 3.34e-07 1.21e-07 3.41e-07 erg/cm2
Peak flux CPL 4.61e-01 4.31e-01 2.85e-01 2.94e-01 1.30e+00 1.49e+00 ph/cm2/s
90%_error_low N/A -8.23e-02 N/A N/A N/A -3.03e-01 ph/cm2/s
90%_error_hi N/A 8.78e-02 N/A N/A N/A 2.48e-01 ph/cm2/s
======================================================================
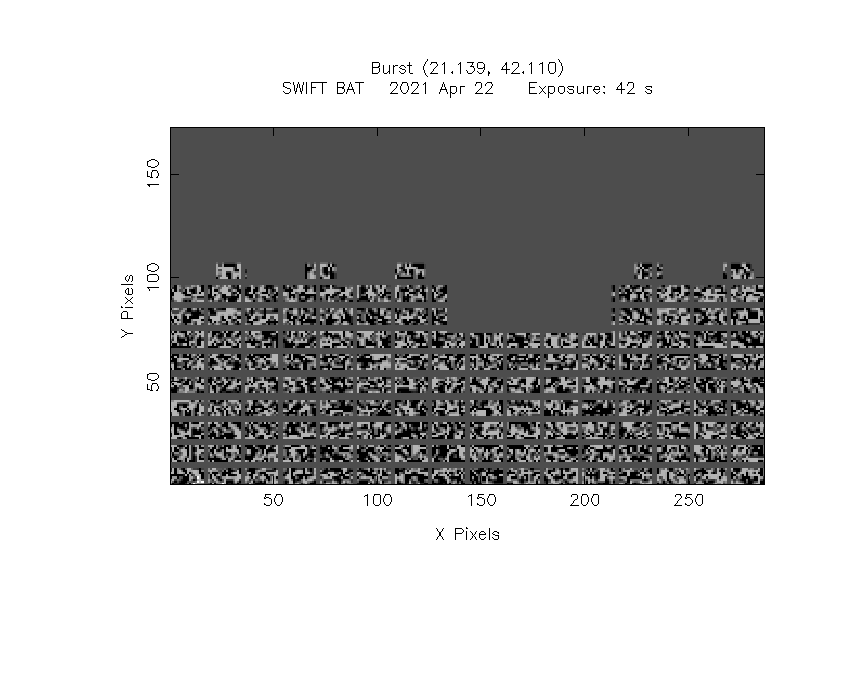
Image
Pre-slew 15.0-350.0 keV image (Event data)
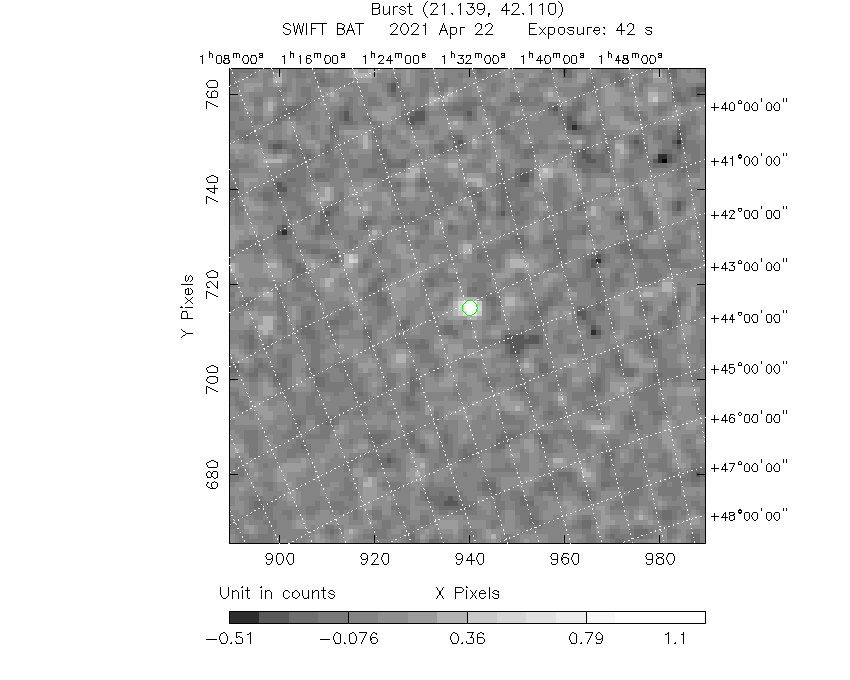
#   RAcent    DECcent   POSerr    Theta     Phi              Peak Cts       SNR   Name
   21.0795    42.1028   0.0186    27.3287  -104.1974         1.2080288     10.350 TRIG_01044678

Foreground time interval of the image:
-34.408   7.592 (delta_t =  42.000 [sec])
Background time interval of the image:
-239.408 -34.408 (delta_t = 205.000 [sec])
Light Curves
Note: The mask-weighted lightcurves have units of either count/det or counts/sec/det, where a det is 0.4 x 0.4 = 0.16 sq cm.
Full-time range; 1 s binning
Other quick-look light curves:
- 64 ms binning (zoomed)
- 16 ms binning (zoomed)
- 8 ms binning (zoomed)
- 2 ms binning (zoomed)
- SN=5 or 10 s binning (full-time range)
- Raw light curve
Spectra
- 64 ms binning (zoomed)
- 16 ms binning (zoomed)
- 8 ms binning (zoomed)
- 2 ms binning (zoomed)
- SN=5 or 10 s binning (full-time range)
- Raw light curve
Spectra
Notes:
- 1) The fitting includes the systematic errors.
- 2) When the burst includes telescope slew time periods, the fitting uses an average response file made from multiple 5-s response files through out the slew time plus single time preiod for the non-slew times, and weighted by the total counts in the corresponding time period using addrmf. An average response file is needed becuase a spectral fit using the pre-slew DRM will introduce some errors in both a spectral shape and a normalization if the PHA file contains a lot of the slew/post-slew time interval.
- 3) For fits to more complicated models (e.g. a power-law over a cutoff power-law), the BAT team has decided to require a chi-square improvement of more than 6 for each extra dof.
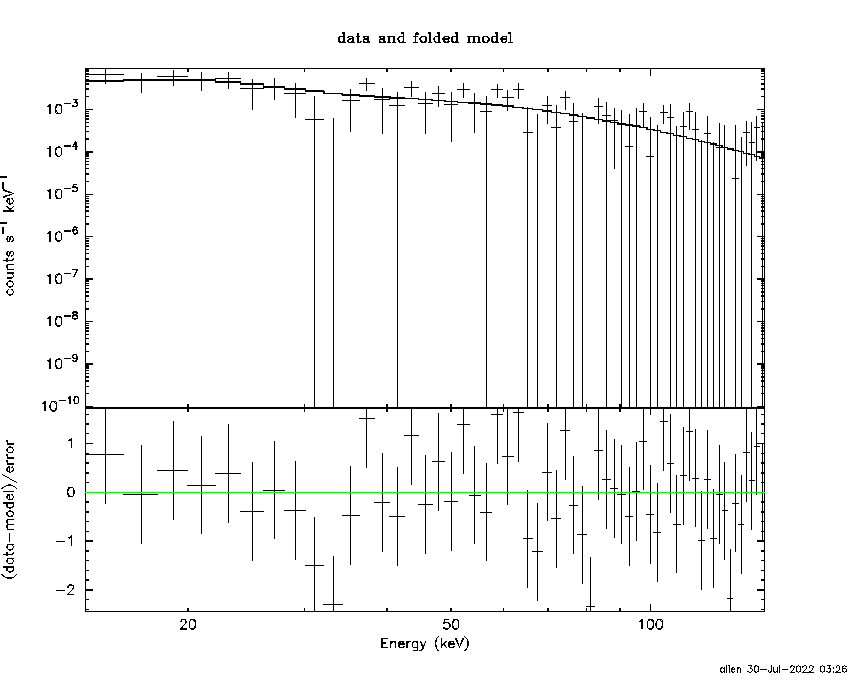
Time averaged spectrum fit using the average DRM
Power-law model
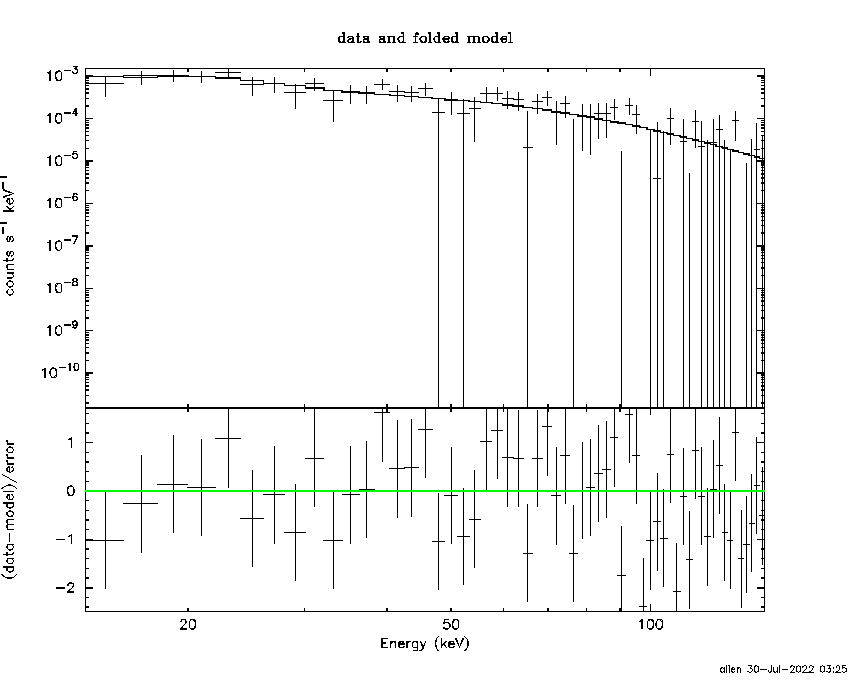
Time interval is from  -34.408 sec. to    7.592 sec.

Spectral model in power-law:
------------------------------------------------------------
Parameters  : value       lower 90%   higher 90%
Photon index: -1.73567     ( -0.233251   0.222609 )
Norm@50keV  : 1.85101E-03    ( -0.000279706   0.000274257 )
------------------------------------------------------------
#Fit statistic  : Chi-Squared                   53.32     using 59 bins.
 Reduced chi-squared = 0.935439
# Null hypothesis probability of 6.14e-01 with 57 degrees of freedom

Photon flux (15-150 keV)    in 42 sec: 0.248989 ( -0.032752  0.032762 ) ph/cm2/s
Energy fluence (15-150 keV)             : 7.18091e-07 ( -1.11286e-07  1.13672e-07 ) ergs/cm2
Cutoff power-law model
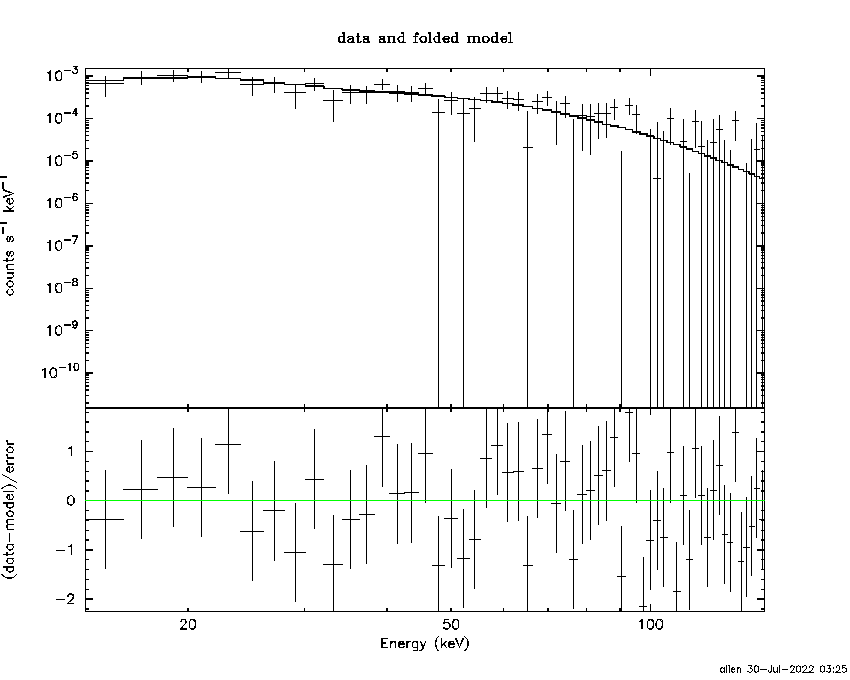
Time interval is from  -34.408 sec. to    7.592 sec.
Spectral model in the cutoff power-law:
------------------------------------------------------------
Parameters  : value       lower 90%   higher 90%
Photon index: -0.726749     ( -0.913906   1.13377 )
Epeak [keV] : 57.3002      ( -13.6941 93.5556 )
Norm@50keV  : 6.56178E-03    ( -0.00656158   0.0199127 )
------------------------------------------------------------
#Fit statistic  : Chi-Squared                   49.68     using 59 bins.
 Reduced chi-squared = 0.887143
# Null hypothesis probability of 7.11e-01 with 56 degrees of freedom

Photon flux (15-150 keV)    in 42 sec: 0.240547 ( -0.033525  0.03357 ) ph/cm2/s
Energy fluence (15-150 keV)             : 6.63512e-07 ( -1.13655e-07  1.21144e-07 ) ergs/cm2
1-s peak spectrum fit
Power-law model
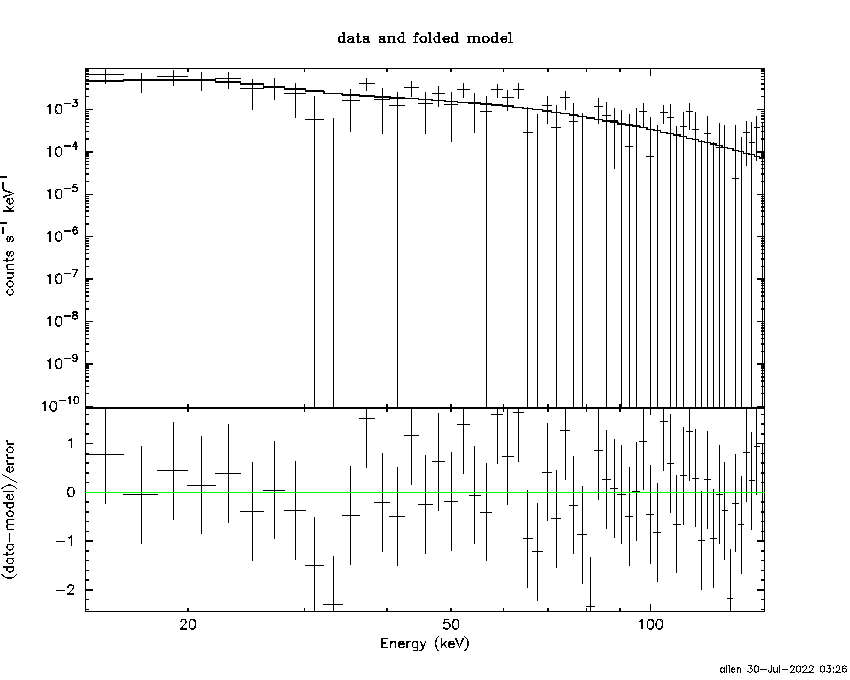
Time interval is from    0.592 sec. to    1.592 sec.

Spectral model in power-law:
------------------------------------------------------------
Parameters  : value       lower 90%   higher 90%
Photon index: -1.59729     ( -0.348497   0.328147 )
Norm@50keV  : 1.01119E-02    ( -0.00202496   0.00196787 )
------------------------------------------------------------
#Fit statistic  : Chi-Squared                   48.76     using 59 bins.
 Reduced chi-squared = 0.855439
# Null hypothesis probability of 7.73e-01 with 57 degrees of freedom

Photon flux (15-150 keV)    in 1 sec: 1.29837 ( -0.24037  0.24083 ) ph/cm2/s
Energy fluence (15-150 keV)             : 9.46106e-08 ( -2.01528e-08  2.04482e-08 ) ergs/cm2
Cutoff power-law model
Time interval is from    0.592 sec. to    1.592 sec.
Spectral model in the cutoff power-law:
------------------------------------------------------------
Parameters  : value       lower 90%   higher 90%
Photon index: -1.59524     ( -2.68721   1.24772 )
Epeak [keV] : 1.00000E+04      ( -10000 -10000 )
Norm@50keV  : 1.01366E-02    ( -0.00204126   -0.0101368 )
------------------------------------------------------------
#Fit statistic  : Chi-Squared                   48.77     using 59 bins.
 Reduced chi-squared = 0.870893
# Null hypothesis probability of 7.43e-01 with 56 degrees of freedom

Photon flux (15-150 keV)    in 1 sec: 1.30191 (    ) ph/cm2/s
Energy fluence (15-150 keV)             : 9.48702e-08 ( -2.13037e-08  2.14138e-08 ) ergs/cm2
Time-resolved spectra
Distribution
T90 vs. Hardness ratio plot
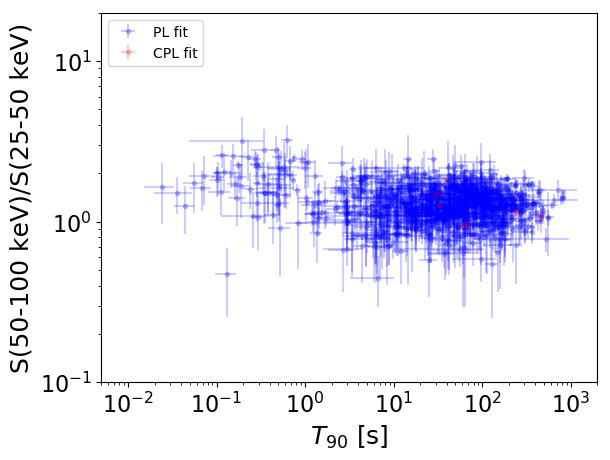
T90                                   = N/A sec.
Hardness ratio (energy fluence ratio) = N/A
S(15-50 keV) vs. S(50-150 keV) plot
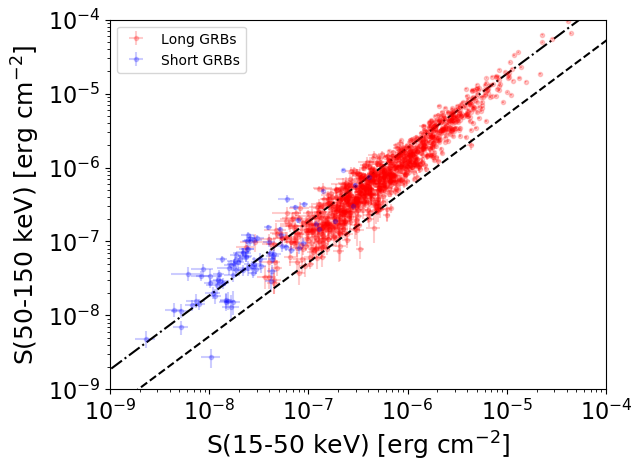
S(15-50 keV)  = N/A
S(50-150 keV) = N/A
The dash-dotted line and the dashed line traces the fluences calculated from the Band function with Epeak = 15 and 150 keV, respectively. Both lines assume a canonical values of alpha = -1 and beta = -2.5.
Mask shadow pattern
IMX = -1.267459649226316E-01, IMY = 5.009892620903551E-01
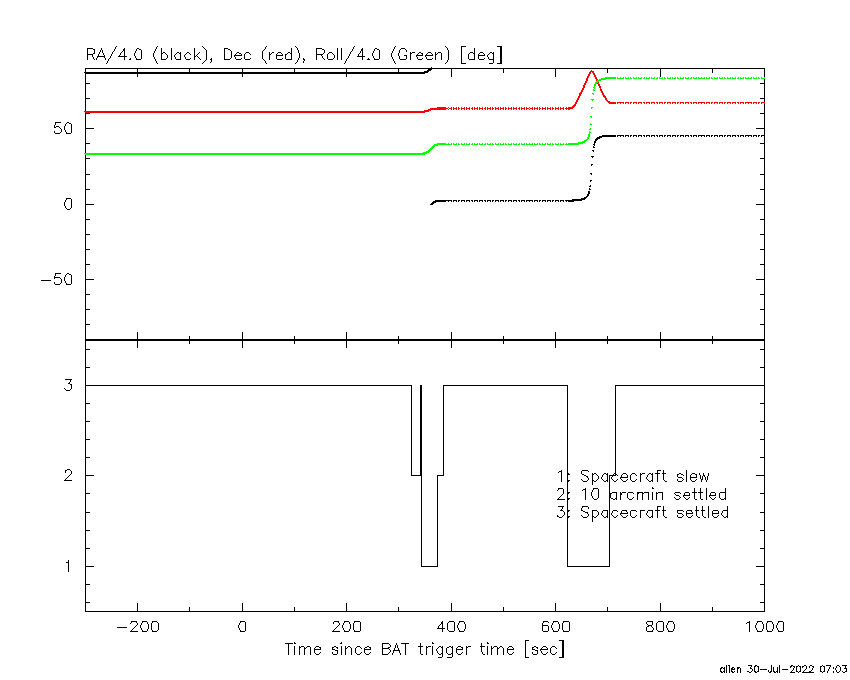
Spacecraft aspect plot
Bright source in the pre-burst/pre-slew/post-slew images
Pre-burst image of 15-350 keV band
Time interval of the image:
-239.408000 -34.408000

# RAcent  DECcent POSerr Theta    Phi  PeakCts   SNR AngSep     Name
#  [deg]    [deg]    ['] [deg]  [deg]                   [']
299.7420  35.1902   19.9  40.2   28.6  -0.2553  -0.6    7.5	Cyg X-1
308.2051  40.9983    2.9  31.6   25.1   1.3609   4.1    5.1	Cyg X-3
326.1205  38.3857    3.3  26.8   -2.2   0.8425   3.5    4.5	Cyg X-2
215.7474  74.3911    2.2  40.8  118.7   4.1356   5.2 ------	UNKNOWN
294.6469  33.5396    3.5  43.9   32.5   1.5264   3.3 ------	UNKNOWN
303.8047  15.6409    3.4  55.6   11.5   3.8802   3.4 ------	UNKNOWN
356.1278  78.7302    3.5  17.6  141.2   0.8119   3.3 ------	UNKNOWN
Pre-slew background subtracted image of 15-350 keV band
Time interval of the image:
-34.408000 7.592000

# RAcent  DECcent POSerr Theta    Phi  PeakCts   SNR AngSep     Name
#  [deg]    [deg]    ['] [deg]  [deg]                   [']
299.6877  35.2013    5.2  40.2   28.7   0.3481   2.2    4.8	Cyg X-1
308.1021  40.8588    5.9  31.7   25.0  -0.2372  -1.9    5.6	Cyg X-3
326.2012  38.3237   10.6  26.8   -2.4  -0.1020  -1.1    1.4	Cyg X-2
311.5036  21.7433    2.4  47.0    6.1   0.8270   4.9 ------	UNKNOWN
330.9860  44.4235    2.3  19.8   -4.2   0.4186   4.9 ------	UNKNOWN
 21.0795  42.1029    1.1  27.3 -104.2   1.2082  10.4 ------	UNKNOWN
 61.8460  35.7238    2.2  51.4 -139.3   1.8631   5.1 ------	UNKNOWN
Post-slew image of 15-350 keV band
Time interval of the image:
374.492590 622.292590

# RAcent  DECcent POSerr Theta    Phi  PeakCts   SNR AngSep     Name
#  [deg]    [deg]    ['] [deg]  [deg]                   [']
299.7159  35.1139    5.2  50.2   21.5   1.9980   2.2    8.1	Cyg X-1
308.0420  40.9751    3.3  41.7   18.7   1.5967   3.5    3.4	Cyg X-3
326.1566  38.3111    5.9  36.0   -2.2   0.7439   1.9    1.0	Cyg X-2
222.1636  74.0436    3.2  40.9   98.0   3.6679   3.6 ------	UNKNOWN
116.6790  54.4124    3.6  49.4  158.2   2.6599   3.2 ------	UNKNOWN
301.0727  29.7824    2.8  54.2   16.7   4.9604   4.1 ------	UNKNOWN
319.6897  22.0589    2.7  53.0   -6.2   2.7523   4.3 ------	UNKNOWN
 81.7084  27.5632    3.5  57.6 -156.4   4.8994   3.3 ------	UNKNOWN
350.3753  14.6755    2.6  50.6  -44.5   5.4139   4.5 ------	UNKNOWN