Analysis Summary
Notes:
- 1) No attempt has been made to eliminate the non-significant decimal places.
- 2) This batgrbproduct analysis is done using the HEASARC data.
- 3) This batgrbproduct analysis is using the flight position for the mask-weighting calculation.
======================================================================
                  BAT GRB EVENT DATA PROCESSING REPORT
    Process Script Ver: batgrbproduct v2.48
    Process Start Time: Fri Jul 29 23:24:22 EDT 2022
             Host Name: batproc1
   Current Working Dir: /local/data/bat1/alien/Swift_3rdBATcatalog/event/batevent_reproc/trigger1046014
======================================================================

  Trigger: 01046014      Segment: 000

  BAT Trigger Time: 641472156.8   [s; MET]
      Trigger Stop: 641472160.896   [s; MET]
               UTC: 2021-04-30T10:42:09.864820    [includes UTCF correction]
       Where From?: TDRSS position message

  BAT
    RA: 57.1977339845647   Dec: 45.074287242736  [deg; J2000]

     Catalogged Source?: NO
     Point Source?:      YES
     GRB Indicated?:     YES    [ by BAT flight software ]
     Image S/N Ratio:    8.71
     Image Trigger?:     NO
     Rate S/N Ratio:     10.0498756211209  [ if not an image trigger ]
     Image S/N Ratio:    8.71

  Analysis Position:   [ source = BAT ]
    RA: 57.1977339845647   Dec: 45.074287242736  [deg; J2000]

  Refined Position:   [ source = BAT pre-slew burst ]
    RA: 57.1849876529012   Dec: 45.0796454358532  [deg; J2000]
        { 03h 48m 44.4s , +45d 04' 46.7" }
         +/- 1.70247036983487 [arcmin] (estimated 90% radius based on SNR)
         +/- 0.864925581268913 [arcmin] (formal 1-sigma fit error)
    SNR: 14.2234424487545

  Angular difference between the analysis and refined position is 0.628502 arcmin

  Partial Coding Fraction: 0.25    [ including projection effects ]

  Duration
     T90: 13.9319999217987 +/- 2.81434398237871
        Measured from: -1.69199991226196
                   to: 12.2400000095367     [s; relative to TRIGTIME]
     T50: 6.60399985313416 +/- 1.39216662433767
        Measured from: 1.40000009536743
                   to: 8.00399994850159     [s; relative to TRIGTIME]


  Fluence
     Peak Flux  (peak 1 second)
        Measured from: 1.14000010490417
                   to: 2.14000010490417     [s; relative to TRIGTIME]
     Total Fluence
        Measured from: -2.71999990940094
                   to: 14.5960000753403     [s; relative to TRIGTIME]

             Band 1     Band 2     Band 3     Band 4
              15-25      25-50     50-100    100-350     keV
 Total     0.602870   0.737917   0.296042   0.072816
           0.064432   0.066154   0.056308   0.048890 [error]
 Peak      0.076687   0.075864   0.057730   0.015058
           0.016202   0.016939   0.015242   0.011833 [error]

     [ fluence units of on-axis counts / fully illuminated detector ]

======================================================================


====== Table of the duration information =============================

        Value   tstart    tstop
T100   17.316   -2.720   14.596
T90    13.932   -1.692   12.240
T50     6.604    1.400    8.004
Peak    1.000    1.140    2.140


====== Spectral Analysis Summary =====================================

Model      : spectral model: simple power-law (PL) and cutoff power-law (CPL)
Ph_index   : photon index: E^{Ph_index}
Ph_90err   : 90% error of the photon index
Epeak      : Epeak in keV
Epeak_90err: 90% error of Epeak
Norm       : normalization at 50 keV in both the PL model and CPL model
Nomr_90err : 90% error of the normalization
chi2       : Chi-Squared
dof        : degree of freedo

=== Time-averaged spectral analysis ===
(Best model with acceptable fit: N/A)

Model Ph_index Ph_90err_low Ph_90err_hi  Epeak  Epeak_90err_low  Epeak_90err_hi  Norm       Nomr_90err_low    Norm_90err_hi    chi2    dof
PL      -2.136    -0.217      0.202       -           -               -         6.08e-03     -8.77e-04          8.56e-04      75.860   57
CPL     -1.238    -0.714      1.296       34.699     -30.280        13.675      2.03e-02     -2.03e-02          9.99e-02      73.360   56


=== 1-s peak spectral analysis ===
(Best model with acceptable fit: N/A)

Model Ph_index Ph_90err_low Ph_90err_hi  Epeak  Epeak_90err_low  Epeak_90err_hi  Norm       Nomr_90err_low    Norm_90err_hi    chi2    dof
PL      -1.826     -0.425     0.387       -           -               -         1.35e-02     -3.61e-03          3.48e-03      49.640   57
CPL     -1.367     -0.858     1.952       65.053     -54.324       -65.053      2.39e-02     -2.39e-02          2.50e-01      49.330   56


=== Fluence/Peak Flux Summary ===

              Model    Band1     Band2     Band3     Band4     Band5     Total
                       15-25     25-50    50-100    100-350    15-150    15-350    keV
Fluence         PL   2.45e-07  3.07e-07  2.79e-07  4.42e-07  9.83e-07  1.27e-06   erg/cm2
      90%_error_low -3.72e-08 -3.41e-08 -5.38e-08 -1.48e-07 -1.25e-07 -2.17e-07   erg/cm2
      90%_error_hi   3.82e-08  3.41e-08  5.50e-08  1.89e-07  1.27e-07  2.46e-07   erg/cm2
Peak flux       PL   7.63e-01  6.34e-01  3.57e-01  2.98e-01  1.89e+00  2.05e+00   ph/cm2/s
      90%_error_low -2.58e-01 -1.49e-01 -1.20e-01 -1.57e-01 -4.45e-01 -4.79e-01   ph/cm2/s
      90%_error_hi   2.77e-01  1.49e-01  1.18e-01  2.27e-01  4.46e-01  4.80e-01   ph/cm2/s

Fluence        CPL    N/A      N/A      N/A      N/A      N/A      N/A      erg/cm2
      90%_error_low -3.72e-08 -3.41e-08 -5.38e-08 -1.48e-07 -1.25e-07 -2.17e-07   erg/cm2
      90%_error_hi   3.82e-08  3.41e-08  5.50e-08  1.89e-07  1.27e-07  2.46e-07   erg/cm2
Peak flux      CPL   7.18e-01  6.70e-01  3.70e-01  1.78e-01  1.86e+00  1.94e+00   ph/cm2/s
      90%_error_low -2.99e-01 -3.52e-01 -1.31e-01 -1.78e-01 -4.52e-01 -4.99e-01   ph/cm2/s
      90%_error_hi   3.07e-01  1.97e-01  1.36e-01  1.54e-01  4.51e-01  5.31e-01   ph/cm2/s

======================================================================
Image
Pre-slew 15.0-350.0 keV image (Event data)
#   RAcent    DECcent   POSerr    Theta     Phi              Peak Cts       SNR   Name
   57.1850    45.0796   0.0135    43.2889   -43.9085         1.7572994     14.223 TRIG_01046014

Foreground time interval of the image:
 -2.720  14.596 (delta_t =  17.316 [sec])
Background time interval of the image:
-239.800  -2.720 (delta_t = 237.080 [sec])
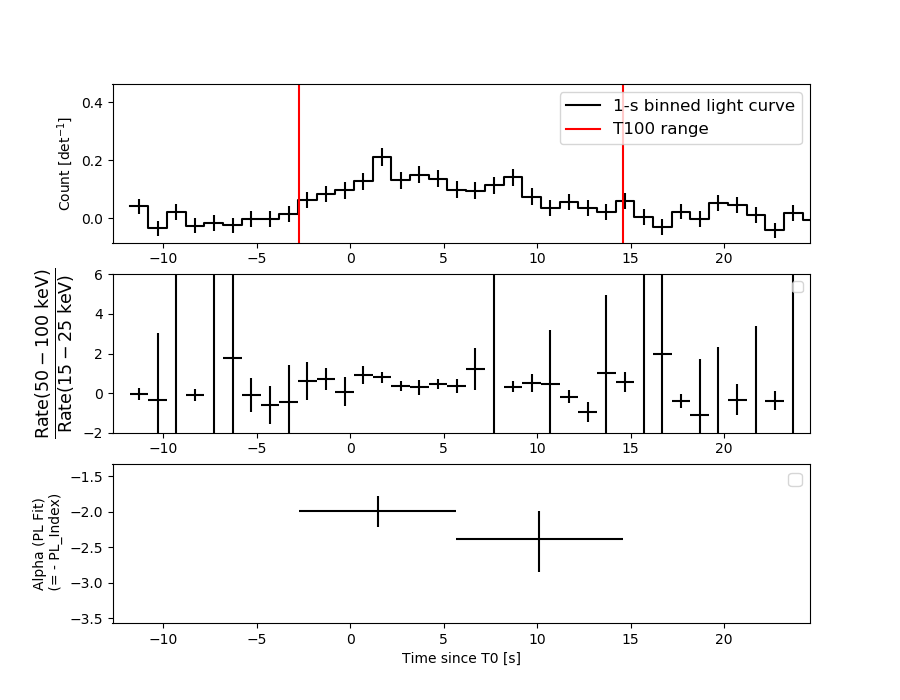
Light Curves
Note: The mask-weighted lightcurves have units of either count/det or counts/sec/det, where a det is 0.4 x 0.4 = 0.16 sq cm.
Full-time range; 1 s binning
Other quick-look light curves:
- 64 ms binning (zoomed)
- 16 ms binning (zoomed)
- 8 ms binning (zoomed)
- 2 ms binning (zoomed)
- SN=5 or 10 s binning (full-time range)
- Raw light curve
Spectra
- 64 ms binning (zoomed)
- 16 ms binning (zoomed)
- 8 ms binning (zoomed)
- 2 ms binning (zoomed)
- SN=5 or 10 s binning (full-time range)
- Raw light curve
Spectra
Notes:
- 1) The fitting includes the systematic errors.
- 2) When the burst includes telescope slew time periods, the fitting uses an average response file made from multiple 5-s response files through out the slew time plus single time preiod for the non-slew times, and weighted by the total counts in the corresponding time period using addrmf. An average response file is needed becuase a spectral fit using the pre-slew DRM will introduce some errors in both a spectral shape and a normalization if the PHA file contains a lot of the slew/post-slew time interval.
- 3) For fits to more complicated models (e.g. a power-law over a cutoff power-law), the BAT team has decided to require a chi-square improvement of more than 6 for each extra dof.
Time averaged spectrum fit using the average DRM
Power-law model
Time interval is from   -2.720 sec. to   14.596 sec.

Spectral model in power-law:
------------------------------------------------------------
Parameters  : value       lower 90%   higher 90%
Photon index: -2.13577     ( -0.216718   0.202319 )
Norm@50keV  : 6.08207E-03    ( -0.000877248   0.000855618 )
------------------------------------------------------------
#Fit statistic  : Chi-Squared                   75.86     using 59 bins.
 Reduced chi-squared = 1.33088
# Null hypothesis probability of 4.82e-02 with 57 degrees of freedom

Photon flux (15-150 keV)    in 17.32 sec: 0.974201 ( -0.107926  0.107999 ) ph/cm2/s
Energy fluence (15-150 keV)             : 9.82602e-07 ( -1.25311e-07  1.27462e-07 ) ergs/cm2
Cutoff power-law model
Time interval is from   -2.720 sec. to   14.596 sec.
Spectral model in the cutoff power-law:
------------------------------------------------------------
Parameters  : value       lower 90%   higher 90%
Photon index: -1.23766     ( -0.7147   1.29545 )
Epeak [keV] : 34.6986      ( -30.2825 13.673 )
Norm@50keV  : 2.03189E-02    ( -0.0203321   0.099852 )
------------------------------------------------------------
#Fit statistic  : Chi-Squared                   73.36     using 59 bins.
 Reduced chi-squared = 1.31
# Null hypothesis probability of 5.97e-02 with 56 degrees of freedom

Photon flux (15-150 keV)    in 17.32 sec: 0.943504 ( -0.113412  0.112946 ) ph/cm2/s
Energy fluence (15-150 keV)             : 0 ( 0  0 ) ergs/cm2
1-s peak spectrum fit
Power-law model
Time interval is from    1.140 sec. to    2.140 sec.

Spectral model in power-law:
------------------------------------------------------------
Parameters  : value       lower 90%   higher 90%
Photon index: -1.82624     ( -0.424705   0.387163 )
Norm@50keV  : 1.35457E-02    ( -0.00361252   0.00347684 )
------------------------------------------------------------
#Fit statistic  : Chi-Squared                   49.64     using 59 bins.
 Reduced chi-squared = 0.870877
# Null hypothesis probability of 7.45e-01 with 57 degrees of freedom

Photon flux (15-150 keV)    in 1 sec: 1.88600 ( -0.44534  0.44601 ) ph/cm2/s
Energy fluence (15-150 keV)             : 1.24626e-07 ( -3.26171e-08  3.32187e-08 ) ergs/cm2
Cutoff power-law model
Time interval is from    1.140 sec. to    2.140 sec.
Spectral model in the cutoff power-law:
------------------------------------------------------------
Parameters  : value       lower 90%   higher 90%
Photon index: -1.3669     ( -0.858121   1.95229 )
Epeak [keV] : 65.0526      ( -54.3238 -65.0527 )
Norm@50keV  : 2.39278E-02    ( -0.0239279   0.249586 )
------------------------------------------------------------
#Fit statistic  : Chi-Squared                   49.33     using 59 bins.
 Reduced chi-squared = 0.880893
# Null hypothesis probability of 7.24e-01 with 56 degrees of freedom

Photon flux (15-150 keV)    in 1 sec: 1.86449 ( -0.45187  0.45111 ) ph/cm2/s
Energy fluence (15-150 keV)             : 0 ( 0  0 ) ergs/cm2
Time-resolved spectra
Distribution
T90 vs. Hardness ratio plot
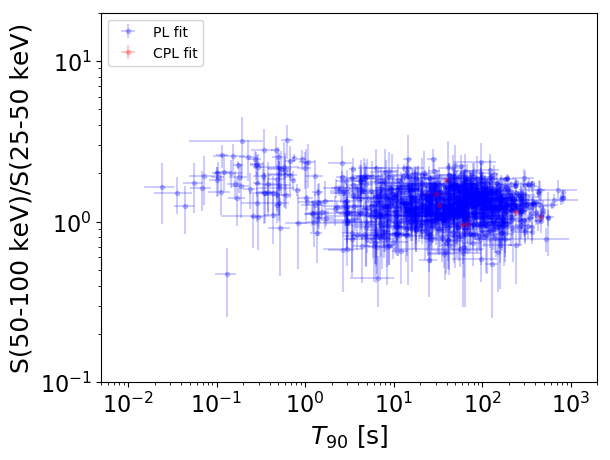
T90                                   = N/A sec.
Hardness ratio (energy fluence ratio) = N/A
S(15-50 keV) vs. S(50-150 keV) plot
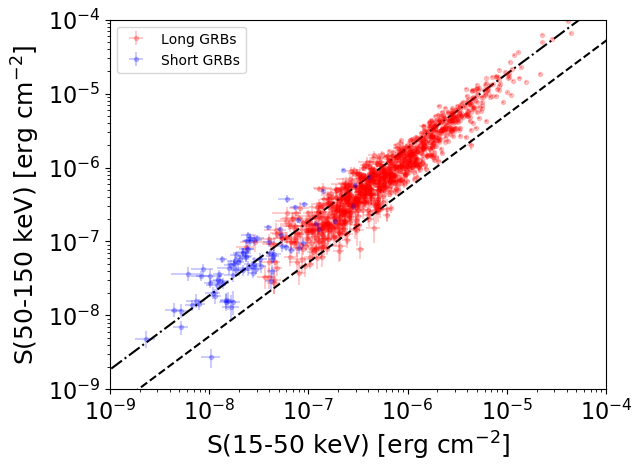
S(15-50 keV)  = N/A
S(50-150 keV) = N/A
The dash-dotted line and the dashed line traces the fluences calculated from the Band function with Epeak = 15 and 150 keV, respectively. Both lines assume a canonical values of alpha = -1 and beta = -2.5.
Mask shadow pattern
IMX = 6.786525965272134E-01, IMY = 6.532748814989496E-01
Spacecraft aspect plot
Bright source in the pre-burst/pre-slew/post-slew images
Pre-burst image of 15-350 keV band
Time interval of the image:
-239.800000 -2.720000

# RAcent  DECcent POSerr Theta    Phi  PeakCts   SNR AngSep     Name
#  [deg]    [deg]    ['] [deg]  [deg]                   [']
 83.6310  22.0200    0.4  20.1  -88.5   9.4840  29.9    0.4	Crab
136.4962  64.5692    3.1  44.2   24.8   2.1012   3.7 ------	UNKNOWN
117.3044 -30.4425    2.7  56.8  173.9   7.3733   4.3 ------	UNKNOWN
 99.7653  50.4001    3.4  25.5   -2.1   1.0129   3.4 ------	UNKNOWN
 54.7986  51.2614    2.3  46.2  -35.8   3.3148   5.1 ------	UNKNOWN
Pre-slew background subtracted image of 15-350 keV band
Time interval of the image:
-2.720000 14.596000

# RAcent  DECcent POSerr Theta    Phi  PeakCts   SNR AngSep     Name
#  [deg]    [deg]    ['] [deg]  [deg]                   [']
 83.5161  21.8394    0.0  20.3  -88.9  -0.0728  -1.1   12.4	Crab
 83.8631  -2.6838    2.7  34.8 -134.0   0.3405   4.2 ------	UNKNOWN
 57.1850  45.0797    0.8  43.3  -43.9   1.7577  14.2 ------	UNKNOWN
Post-slew image of 15-350 keV band
Time interval of the image:
255.100600 650.387900
660.200000 710.857600
720.200000 776.160000
780.200000 962.221600

# RAcent  DECcent POSerr Theta    Phi  PeakCts   SNR AngSep     Name
#  [deg]    [deg]    ['] [deg]  [deg]                   [']
180.0139   7.5062    2.6  40.7   96.4   8.7519   4.4 ------	UNKNOWN
215.2017  44.4250    2.9  52.2   29.9  10.0752   4.0 ------	UNKNOWN
250.8866  83.8877    2.7  57.3  -20.2   9.4792   4.3 ------	UNKNOWN
122.2258  76.3084    2.2  43.4  -35.5   5.1234   5.2 ------	UNKNOWN
 98.1458  14.6170    2.4  47.9 -129.2  11.3471   4.8 ------	UNKNOWN