Analysis Summary
Notes:
- 1) No attempt has been made to eliminate the non-significant decimal places.
- 2) This batgrbproduct analysis is done using the HEASARC data.
- 3) This batgrbproduct analysis is using the flight position for the mask-weighting calculation.
======================================================================
                  BAT GRB EVENT DATA PROCESSING REPORT
    Process Script Ver: batgrbproduct v2.48
    Process Start Time: Fri Jul 29 23:22:13 EDT 2022
             Host Name: batproc1
   Current Working Dir: /local/data/bat1/alien/Swift_3rdBATcatalog/event/batevent_reproc/trigger1046782
======================================================================

  Trigger: 01046782      Segment: 000

  BAT Trigger Time: 641829320   [s; MET]
      Trigger Stop: 641829384   [s; MET]
               UTC: 2021-05-04T13:54:53.041040    [includes UTCF correction]
       Where From?: TDRSS position message

  BAT
    RA: 222.376049651147   Dec: -30.5412476439381  [deg; J2000]

     Catalogged Source?: NO
     Point Source?:      YES
     GRB Indicated?:     YES    [ by BAT flight software ]
     Image S/N Ratio:    8.45
     Image Trigger?:     YES
     Rate S/N Ratio:     0  [ if not an image trigger ]
     Image S/N Ratio:    8.45

  Analysis Position:   [ source = BAT ]
    RA: 222.376049651147   Dec: -30.5412476439381  [deg; J2000]

  Refined Position:   [ source = BAT pre-slew burst ]
    RA: 222.380218907227   Dec: -30.5566372634199  [deg; J2000]
        { 14h 49m 31.3s , -30d 33' 23.9" }
         +/- 2.07561322345956 [arcmin] (estimated 90% radius based on SNR)
         +/- 1.10311421513985 [arcmin] (formal 1-sigma fit error)
    SNR: 10.7164774153803

  Angular difference between the analysis and refined position is 0.948175 arcmin

  Partial Coding Fraction: 0.53125    [ including projection effects ]

  Duration
     T90: 142.983999967575 +/- 9.32908560628313
        Measured from: -14.1959999799728
                   to: 128.787999987602     [s; relative to TRIGTIME]
     T50: 66.62399995327 +/- 18.2639536124136
        Measured from: 28.7039999961853
                   to: 95.3279999494553     [s; relative to TRIGTIME]


  Fluence
     Peak Flux  (peak 1 second)
        Measured from: 87.6840000152588
                   to: 88.6840000152588     [s; relative to TRIGTIME]
     Total Fluence
        Measured from: -22.5720000267029
                   to: 134.756000041962     [s; relative to TRIGTIME]

             Band 1     Band 2     Band 3     Band 4
              15-25      25-50     50-100    100-350     keV
 Total     1.437511   1.672824   1.280894   0.179709
           0.112079   0.110843   0.097835   0.086969 [error]
 Peak      0.030737   0.042601   0.027673   0.004077
           0.009221   0.009380   0.008290   0.007446 [error]

     [ fluence units of on-axis counts / fully illuminated detector ]

======================================================================


====== Table of the duration information =============================

        Value   tstart    tstop
T100  157.328  -22.572  134.756
T90   142.984  -14.196  128.788
T50    66.624   28.704   95.328
Peak    1.000   87.684   88.684


====== Spectral Analysis Summary =====================================

Model      : spectral model: simple power-law (PL) and cutoff power-law (CPL)
Ph_index   : photon index: E^{Ph_index}
Ph_90err   : 90% error of the photon index
Epeak      : Epeak in keV
Epeak_90err: 90% error of Epeak
Norm       : normalization at 50 keV in both the PL model and CPL model
Nomr_90err : 90% error of the normalization
chi2       : Chi-Squared
dof        : degree of freedo

=== Time-averaged spectral analysis ===
(Best model with acceptable fit: N/A)

Model Ph_index Ph_90err_low Ph_90err_hi  Epeak  Epeak_90err_low  Epeak_90err_hi  Norm       Nomr_90err_low    Norm_90err_hi    chi2    dof
PL      -1.626    -0.129      0.127       -           -               -         1.87e-03     -1.43e-04          1.42e-04      61.750   57
CPL     -0.991    -0.503      0.568       75.620     -17.077        96.529      4.02e-03     -1.79e-03          3.82e-03      56.940   56


=== 1-s peak spectral analysis ===
(Best model with acceptable fit: N/A)

Model Ph_index Ph_90err_low Ph_90err_hi  Epeak  Epeak_90err_low  Epeak_90err_hi  Norm       Nomr_90err_low    Norm_90err_hi    chi2    dof
PL      -1.633     -0.502     0.469       -           -               -         6.83e-03     -1.94e-03          1.83e-03      43.800   57
CPL     -1.643     -1.476     1.019     9999.350      N/A           N/A         6.79e-03        N/A               N/A         43.810   56


=== Fluence/Peak Flux Summary ===

              Model    Band1     Band2     Band3     Band4     Band5     Total
                       15-25     25-50    50-100    100-350    15-150    15-350    keV
Fluence         PL   4.23e-07  7.20e-07  9.32e-07  2.44e-06  2.74e-06  4.52e-06   erg/cm2
      90%_error_low -4.85e-08 -5.24e-08 -9.52e-08 -4.85e-07 -2.24e-07 -5.74e-07   erg/cm2
      90%_error_hi   5.01e-08  5.23e-08  9.53e-08  5.61e-07  2.27e-07  6.35e-07   erg/cm2
Peak flux       PL   3.19e-01  2.97e-01  1.92e-01  1.91e-01  8.87e-01  9.99e-01   ph/cm2/s
      90%_error_low -1.24e-01 -7.48e-02 -7.03e-02 -1.11e-01 -2.18e-01 -2.50e-01   ph/cm2/s
      90%_error_hi   1.35e-01  7.38e-02  6.92e-02  1.80e-01  2.18e-01  2.55e-01   ph/cm2/s

Fluence        CPL   3.84e-07  7.68e-07  9.50e-07  9.73e-07  2.59e-06  3.08e-06   erg/cm2
      90%_error_low -5.73e-08 -6.49e-08 -1.04e-07 -4.66e-07 -2.50e-07 -5.31e-07   erg/cm2
      90%_error_hi   5.82e-08  6.66e-08  1.05e-07  9.96e-07  2.54e-07  1.01e-06   erg/cm2
Peak flux      CPL   3.25e-01  2.96e-01  1.89e-01  2.12e-01  8.89e-01  1.00e+00   ph/cm2/s
      90%_error_low     N/A   -7.41e-02 -1.45e-01     N/A   -2.19e-01 -2.88e-01   ph/cm2/s
      90%_error_hi      N/A    7.52e-02  -4.19e-02     N/A    2.17e-01  2.48e-01   ph/cm2/s

======================================================================
Image
Pre-slew 15.0-350.0 keV image (Event data)
#   RAcent    DECcent   POSerr    Theta     Phi              Peak Cts       SNR   Name
  222.3802   -30.5566   0.0179    24.3092   102.3842         2.1389541     10.716 TRIG_01046782

Foreground time interval of the image:
-13.899  72.701 (delta_t =  86.600 [sec])
Background time interval of the image:
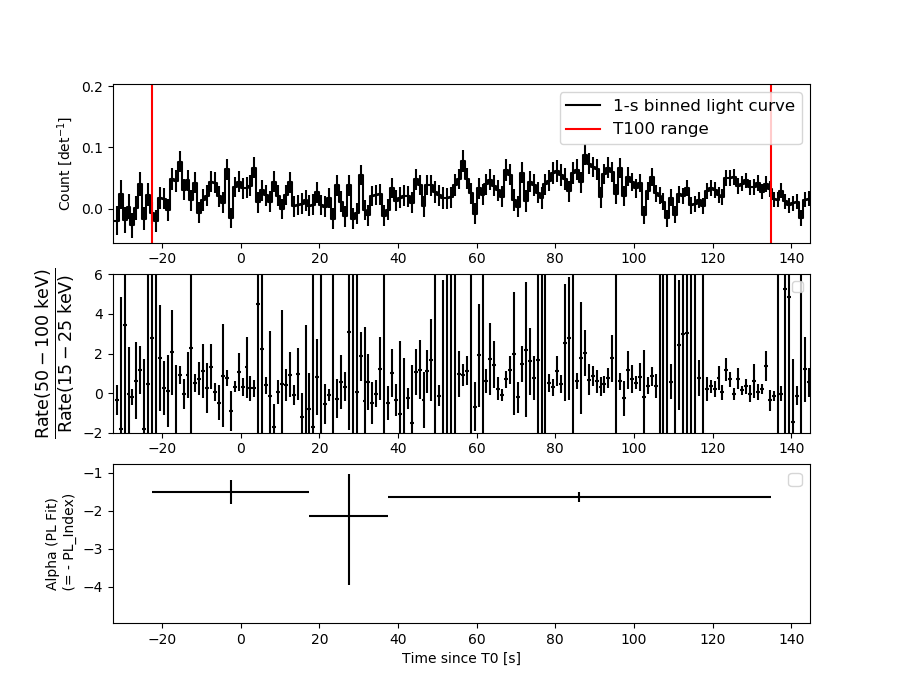
Light Curves
Note: The mask-weighted lightcurves have units of either count/det or counts/sec/det, where a det is 0.4 x 0.4 = 0.16 sq cm.
Full-time range; 1 s binning
Other quick-look light curves:
- 64 ms binning (zoomed)
- 16 ms binning (zoomed)
- 8 ms binning (zoomed)
- 2 ms binning (zoomed)
- SN=5 or 10 s binning (full-time range)
- Raw light curve
Spectra
- 64 ms binning (zoomed)
- 16 ms binning (zoomed)
- 8 ms binning (zoomed)
- 2 ms binning (zoomed)
- SN=5 or 10 s binning (full-time range)
- Raw light curve
Spectra
Notes:
- 1) The fitting includes the systematic errors.
- 2) When the burst includes telescope slew time periods, the fitting uses an average response file made from multiple 5-s response files through out the slew time plus single time preiod for the non-slew times, and weighted by the total counts in the corresponding time period using addrmf. An average response file is needed becuase a spectral fit using the pre-slew DRM will introduce some errors in both a spectral shape and a normalization if the PHA file contains a lot of the slew/post-slew time interval.
- 3) For fits to more complicated models (e.g. a power-law over a cutoff power-law), the BAT team has decided to require a chi-square improvement of more than 6 for each extra dof.
Time averaged spectrum fit using the average DRM
Power-law model

Time interval is from  -22.572 sec. to  134.756 sec.

Spectral model in power-law:
------------------------------------------------------------
Parameters  : value       lower 90%   higher 90%
Photon index: -1.62618     ( -0.128779   0.126829 )
Norm@50keV  : 1.87043E-03    ( -0.00014321   0.000142139 )
------------------------------------------------------------
#Fit statistic  : Chi-Squared                   61.75     using 59 bins.
 Reduced chi-squared = 1.08333
# Null hypothesis probability of 3.10e-01 with 57 degrees of freedom

Photon flux (15-150 keV)    in 157.3 sec: 0.242357 ( -0.01755  0.017568 ) ph/cm2/s
Energy fluence (15-150 keV)             : 2.74358e-06 ( -2.24461e-07  2.27052e-07 ) ergs/cm2
Cutoff power-law model

Time interval is from  -22.572 sec. to  134.756 sec.
Spectral model in the cutoff power-law:
------------------------------------------------------------
Parameters  : value       lower 90%   higher 90%
Photon index: -0.990511     ( -0.503197   0.567745 )
Epeak [keV] : 75.6203      ( -17.0768 96.5284 )
Norm@50keV  : 4.01660E-03    ( -0.0017876   0.00382148 )
------------------------------------------------------------
#Fit statistic  : Chi-Squared                   56.94     using 59 bins.
 Reduced chi-squared = 1.01679
# Null hypothesis probability of 4.40e-01 with 56 degrees of freedom

Photon flux (15-150 keV)    in 157.3 sec: 0.234829 ( -0.018476  0.018485 ) ph/cm2/s
Energy fluence (15-150 keV)             : 2.59285e-06 ( -2.49766e-07  2.54088e-07 ) ergs/cm2
1-s peak spectrum fit
Power-law model

Time interval is from   87.684 sec. to   88.684 sec.

Spectral model in power-law:
------------------------------------------------------------
Parameters  : value       lower 90%   higher 90%
Photon index: -1.63282     ( -0.502184   0.468722 )
Norm@50keV  : 6.83250E-03    ( -0.00194132   0.00182936 )
------------------------------------------------------------
#Fit statistic  : Chi-Squared                   43.80     using 59 bins.
 Reduced chi-squared = 0.768421
# Null hypothesis probability of 9.00e-01 with 57 degrees of freedom

Photon flux (15-150 keV)    in 1 sec: 0.887201 ( -0.217696  0.217999 ) ph/cm2/s
Energy fluence (15-150 keV)             : 6.36664e-08 ( -1.86314e-08  1.92881e-08 ) ergs/cm2
Cutoff power-law model
Time interval is from   87.684 sec. to   88.684 sec.
Spectral model in the cutoff power-law:
------------------------------------------------------------
Parameters  : value       lower 90%   higher 90%
Photon index: -2.19086     ( -0.928019   1.56728 )
Epeak [keV] : 71.7917      (   )
Norm@50keV  : 3.37232E-03    (     )
------------------------------------------------------------
#Fit statistic  : Chi-Squared                   43.10     using 59 bins.
 Reduced chi-squared = 0.769643
# Null hypothesis probability of 8.97e-01 with 56 degrees of freedom

Photon flux (15-150 keV)    in 1 sec: 0.888996 ( -0.219059  0.217194 ) ph/cm2/s
Energy fluence (15-150 keV)             : 4.38874e-08 ( -2.29371e-08  1.38637e-08 ) ergs/cm2
Time-resolved spectra
Distribution
T90 vs. Hardness ratio plot

T90                                   = N/A sec.
Hardness ratio (energy fluence ratio) = N/A
S(15-50 keV) vs. S(50-150 keV) plot

S(15-50 keV)  = N/A
S(50-150 keV) = N/A
The dash-dotted line and the dashed line traces the fluences calculated from the Band function with Epeak = 15 and 150 keV, respectively. Both lines assume a canonical values of alpha = -1 and beta = -2.5.
Mask shadow pattern
IMX = -9.687597821372994E-02, IMY = -4.411990679406040E-01
Spacecraft aspect plot

Bright source in the pre-burst/pre-slew/post-slew images
Pre-burst image of 15-350 keV band
Time interval of the image:
Pre-slew background subtracted image of 15-350 keV band
Time interval of the image:
-13.899400 72.700600

# RAcent  DECcent POSerr Theta    Phi  PeakCts   SNR AngSep     Name
#  [deg]    [deg]    ['] [deg]  [deg]                   [']
244.9582 -15.6448    1.2  35.3   54.4   2.8668   9.7    1.3	Sco X-1
253.0300  -5.2136    3.6  43.6   38.3   1.1251   3.2 ------	UNKNOWN
222.3802 -30.5567    1.1  24.3  102.4   2.1399  10.7 ------	UNKNOWN
257.6188  21.9645    2.5  56.9    6.5   3.8812   4.5 ------	UNKNOWN
162.5345 -24.6872    3.0  46.9 -164.3   1.1075   3.9 ------	UNKNOWN
242.3738  41.0968    2.3  59.1  -20.6   4.1613   5.0 ------	UNKNOWN
214.2233  40.8022    2.2  50.6  -44.4   3.5224   5.1 ------	UNKNOWN
Post-slew image of 15-350 keV band
Time interval of the image:
194.900600 963.098900

# RAcent  DECcent POSerr Theta    Phi  PeakCts   SNR AngSep     Name
#  [deg]    [deg]    ['] [deg]  [deg]                   [']
170.2716 -60.4916    5.2  45.3  -54.8   7.3155   2.2    8.0	Cen X-3
186.8199 -62.8923    2.8  39.5  -63.3   8.0717   4.1    8.6	GX 301-2
244.9752 -15.6469    0.5  25.5  151.6  26.2393  24.5    0.5	Sco X-1
256.0001 -37.8499    1.4  28.7 -154.0   9.3332   8.3    0.7	4U 1700-377
256.3214 -36.6117    0.0  28.8 -156.6   1.7086   1.5   12.6	GX 349+2
262.9695 -24.7320    4.0  36.3 -176.9   3.3497   2.9    2.3	GX 1+4
264.9558 -44.4479    6.7  36.1 -143.1   2.0974   1.7    9.1	4U 1735-44
268.3650  -1.4328    5.2  52.4  157.4   8.3670   2.2    1.2	SW J1753.5-0127
270.0949 -25.0439    8.7  42.3 -173.2   1.9856   1.3   10.5	GX 5-1
270.3903 -25.6800    8.9  42.4 -172.2   1.9772   1.3    6.1	GRS 1758-258
274.0146 -14.0043   13.2  50.2  174.8   2.1236   0.9    2.0	GX 17+2
275.7301 -30.3577    0.0  45.6 -163.8  -0.4280  -0.3   10.1	H1820-303
284.9116 -24.9633    5.7  55.0 -167.2   5.6379   2.0    7.2	HT1900.1-2455
262.8318 -33.8809   55.9  34.3 -161.4  -0.2100  -0.2    8.3	GX 354-0
178.2650 -10.9374    4.1  45.2   18.1   5.0374   2.8 ------	UNKNOWN
173.3984 -13.6557    3.1  47.9   11.5   6.5303   3.8 ------	UNKNOWN
269.1511 -31.2926    2.6  39.9 -164.3   5.2101   4.4 ------	UNKNOWN
158.5170 -53.6977    3.6  50.6  -44.5  11.9416   3.2 ------	UNKNOWN