Analysis Summary
Notes:
- 1) No attempt has been made to eliminate the non-significant decimal places.
- 2) This batgrbproduct analysis is done using the HEASARC data.
- 3) This batgrbproduct analysis is using the flight position for the mask-weighting calculation.
======================================================================
                  BAT GRB EVENT DATA PROCESSING REPORT
    Process Script Ver: batgrbproduct v2.48
    Process Start Time: Fri Jul 29 23:17:48 EDT 2022
             Host Name: batproc1
   Current Working Dir: /local/data/bat1/alien/Swift_3rdBATcatalog/event/batevent_reproc/trigger1047531
======================================================================

  Trigger: 01047531      Segment: 000

  BAT Trigger Time: 642263567.424   [s; MET]
      Trigger Stop: 642263568.448   [s; MET]
               UTC: 2021-05-09T14:32:20.436060    [includes UTCF correction]
       Where From?: TDRSS position message

  BAT
    RA: 350.352300001742   Dec: 6.67546089388726  [deg; J2000]

     Catalogged Source?: NO
     Point Source?:      YES
     GRB Indicated?:     YES    [ by BAT flight software ]
     Image S/N Ratio:    8.09
     Image Trigger?:     NO
     Rate S/N Ratio:     10.5356537528527  [ if not an image trigger ]
     Image S/N Ratio:    8.09

  Analysis Position:   [ source = BAT ]
    RA: 350.352300001742   Dec: 6.67546089388726  [deg; J2000]

  Refined Position:   [ source = BAT pre-slew burst ]
    RA: 350.367813701445   Dec: 6.6467696170631  [deg; J2000]
        { 23h 21m 28.3s , +06d 38' 48.4" }
         +/- 1.40323404027547 [arcmin] (estimated 90% radius based on SNR)
         +/- 0.512558511716336 [arcmin] (formal 1-sigma fit error)
    SNR: 18.7470313858947

  Angular difference between the analysis and refined position is 1.954035 arcmin

  Partial Coding Fraction: 0.953125    [ including projection effects ]

  Duration
     T90: 10.8159999847412 +/- 1.4402000719477
        Measured from: -3.71200001239777
                   to: 7.10399997234344     [s; relative to TRIGTIME]
     T50: 4.67200005054474 +/- 1.12785818358311
        Measured from: -0.25600004196167
                   to: 4.41600000858307     [s; relative to TRIGTIME]


  Fluence
     Peak Flux  (peak 1 second)
        Measured from: 3.25199997425079
                   to: 4.25199997425079     [s; relative to TRIGTIME]
     Total Fluence
        Measured from: -4.68800008296967
                   to: 7.66400003433228     [s; relative to TRIGTIME]

             Band 1     Band 2     Band 3     Band 4
              15-25      25-50     50-100    100-350     keV
 Total     0.330601   0.330923   0.138797   0.017729
           0.024555   0.025261   0.021610   0.018335 [error]
 Peak      0.048972   0.056051   0.041816  -0.002667
           0.007459   0.007676   0.006681   0.005040 [error]

     [ fluence units of on-axis counts / fully illuminated detector ]

======================================================================


====== Table of the duration information =============================

        Value   tstart    tstop
T100   12.352   -4.688    7.664
T90    10.816   -3.712    7.104
T50     4.672   -0.256    4.416
Peak    1.000    3.252    4.252


====== Spectral Analysis Summary =====================================

Model      : spectral model: simple power-law (PL) and cutoff power-law (CPL)
Ph_index   : photon index: E^{Ph_index}
Ph_90err   : 90% error of the photon index
Epeak      : Epeak in keV
Epeak_90err: 90% error of Epeak
Norm       : normalization at 50 keV in both the PL model and CPL model
Nomr_90err : 90% error of the normalization
chi2       : Chi-Squared
dof        : degree of freedo

=== Time-averaged spectral analysis ===
(Best model with acceptable fit: N/A)

Model Ph_index Ph_90err_low Ph_90err_hi  Epeak  Epeak_90err_low  Epeak_90err_hi  Norm       Nomr_90err_low    Norm_90err_hi    chi2    dof
PL      -2.120    -0.174      0.166       -           -               -         3.61e-03     -4.37e-04          4.30e-04      57.720   57
CPL     -0.806    -0.824      0.993       35.285      -9.479         7.058      2.22e-02     -2.22e-02          6.75e-02      49.590   56


=== 1-s peak spectral analysis ===
(Best model with acceptable fit: N/A)

Model Ph_index Ph_90err_low Ph_90err_hi  Epeak  Epeak_90err_low  Epeak_90err_hi  Norm       Nomr_90err_low    Norm_90err_hi    chi2    dof
PL      -1.825     -0.256     0.239       -           -               -         8.40e-03     -1.51e-03          1.48e-03      57.620   57
CPL      0.207     -1.190     1.525       48.270      -8.348        12.687      1.11e-01     -1.11e-01          6.25e-01      47.980   56


=== Fluence/Peak Flux Summary ===

              Model    Band1     Band2     Band3     Band4     Band5     Total
                       15-25     25-50    50-100    100-350    15-150    15-350    keV
Fluence         PL   1.02e-07  1.29e-07  1.19e-07  1.91e-07  4.16e-07  5.42e-07   erg/cm2
      90%_error_low -1.21e-08 -1.18e-08 -1.92e-08 -5.40e-08 -4.46e-08 -7.92e-08   erg/cm2
      90%_error_hi   1.24e-08  1.18e-08  1.98e-08  6.68e-08  4.56e-08  8.87e-08   erg/cm2
Peak flux       PL   4.73e-01  3.93e-01  2.22e-01  1.85e-01  1.17e+00  1.27e+00   ph/cm2/s
      90%_error_low -9.73e-02 -5.99e-02 -4.99e-02 -6.82e-02 -1.78e-01 -1.97e-01   ph/cm2/s
      90%_error_hi   1.01e-01  5.99e-02  5.07e-02  8.73e-02  1.78e-01  1.99e-01   ph/cm2/s

Fluence        CPL   9.37e-08  1.49e-07  1.04e-07  2.65e-08  3.68e-07  3.73e-07   erg/cm2
      90%_error_low -1.38e-08 -1.67e-08 -2.60e-08 -1.87e-08 -4.52e-08 -4.92e-08   erg/cm2
      90%_error_hi   1.38e-08  1.71e-08  2.50e-08  5.50e-08  5.02e-08  7.19e-08   erg/cm2
Peak flux      CPL   3.70e-01  4.90e-01  2.35e-01  3.01e-02  1.12e+00  1.12e+00   ph/cm2/s
      90%_error_low -1.18e-01 -8.12e-02 -6.42e-02 -3.01e-02 -1.78e-01 -1.80e-01   ph/cm2/s
      90%_error_hi   1.20e-01  8.40e-02  6.40e-02  5.30e-02  1.79e-01  1.82e-01   ph/cm2/s

======================================================================
Image
Pre-slew 15.0-350.0 keV image (Event data)
#   RAcent    DECcent   POSerr    Theta     Phi              Peak Cts       SNR   Name
  350.3678     6.6468   0.0102    23.0035  -167.3340         0.8672042     18.747 TRIG_01047531

Foreground time interval of the image:
 -4.688   7.664 (delta_t =  12.352 [sec])
Background time interval of the image:
-239.424  -4.688 (delta_t = 234.736 [sec])
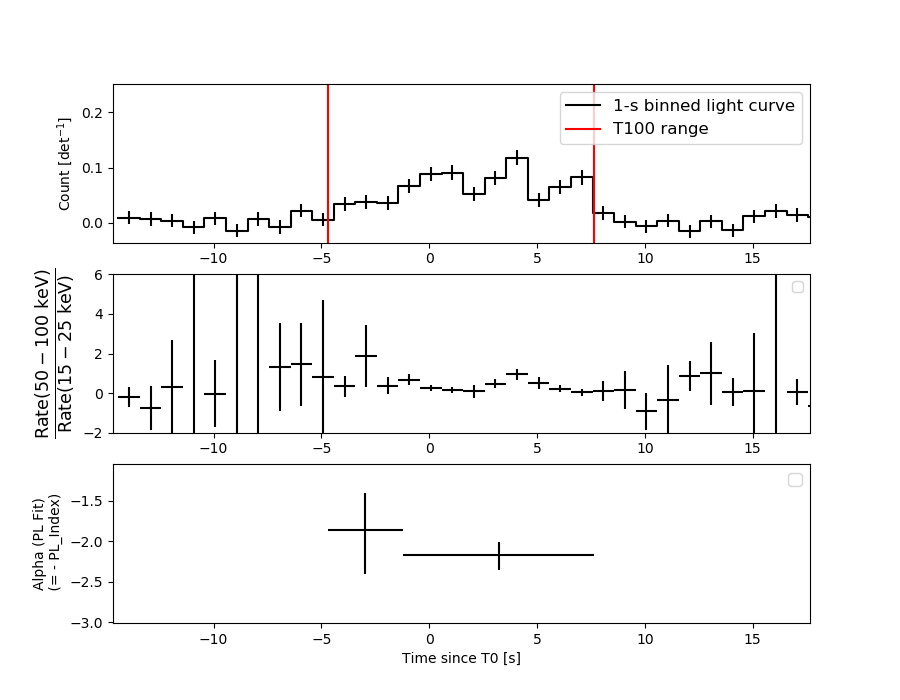
Light Curves
Note: The mask-weighted lightcurves have units of either count/det or counts/sec/det, where a det is 0.4 x 0.4 = 0.16 sq cm.
Full-time range; 1 s binning
Other quick-look light curves:
- 64 ms binning (zoomed)
- 16 ms binning (zoomed)
- 8 ms binning (zoomed)
- 2 ms binning (zoomed)
- SN=5 or 10 s binning (full-time range)
- Raw light curve
Spectra
- 64 ms binning (zoomed)
- 16 ms binning (zoomed)
- 8 ms binning (zoomed)
- 2 ms binning (zoomed)
- SN=5 or 10 s binning (full-time range)
- Raw light curve
Spectra
Notes:
- 1) The fitting includes the systematic errors.
- 2) When the burst includes telescope slew time periods, the fitting uses an average response file made from multiple 5-s response files through out the slew time plus single time preiod for the non-slew times, and weighted by the total counts in the corresponding time period using addrmf. An average response file is needed becuase a spectral fit using the pre-slew DRM will introduce some errors in both a spectral shape and a normalization if the PHA file contains a lot of the slew/post-slew time interval.
- 3) For fits to more complicated models (e.g. a power-law over a cutoff power-law), the BAT team has decided to require a chi-square improvement of more than 6 for each extra dof.
Time averaged spectrum fit using the average DRM
Power-law model
Time interval is from   -4.688 sec. to    7.664 sec.

Spectral model in power-law:
------------------------------------------------------------
Parameters  : value       lower 90%   higher 90%
Photon index: -2.12031     ( -0.174419   0.16559 )
Norm@50keV  : 3.61394E-03    ( -0.000436793   0.000429941 )
------------------------------------------------------------
#Fit statistic  : Chi-Squared                   57.72     using 59 bins.
 Reduced chi-squared = 1.01263
# Null hypothesis probability of 4.48e-01 with 57 degrees of freedom

Photon flux (15-150 keV)    in 12.35 sec: 0.574385 ( -0.051001  0.051006 ) ph/cm2/s
Energy fluence (15-150 keV)             : 4.15611e-07 ( -4.45826e-08  4.56079e-08 ) ergs/cm2
Cutoff power-law model
Time interval is from   -4.688 sec. to    7.664 sec.
Spectral model in the cutoff power-law:
------------------------------------------------------------
Parameters  : value       lower 90%   higher 90%
Photon index: -0.806357     ( -0.824142   0.992605 )
Epeak [keV] : 35.2855      ( -9.4787 7.05829 )
Norm@50keV  : 2.22484E-02    ( -0.0222484   0.0674802 )
------------------------------------------------------------
#Fit statistic  : Chi-Squared                   49.59     using 59 bins.
 Reduced chi-squared = 0.885536
# Null hypothesis probability of 7.15e-01 with 56 degrees of freedom

Photon flux (15-150 keV)    in 12.35 sec: 0.549856 ( -0.052245  0.05255 ) ph/cm2/s
Energy fluence (15-150 keV)             : 3.67508e-07 ( -4.51507e-08  5.01756e-08 ) ergs/cm2
1-s peak spectrum fit
Power-law model
Time interval is from    3.252 sec. to    4.252 sec.

Spectral model in power-law:
------------------------------------------------------------
Parameters  : value       lower 90%   higher 90%
Photon index: -1.82517     ( -0.256173   0.239395 )
Norm@50keV  : 8.39898E-03    ( -0.00151116   0.00148262 )
------------------------------------------------------------
#Fit statistic  : Chi-Squared                   57.62     using 59 bins.
 Reduced chi-squared = 1.01088
# Null hypothesis probability of 4.52e-01 with 57 degrees of freedom

Photon flux (15-150 keV)    in 1 sec: 1.16892 ( -0.178257  0.17828 ) ph/cm2/s
Energy fluence (15-150 keV)             : 7.72681e-08 ( -1.3811e-08  1.41432e-08 ) ergs/cm2
Cutoff power-law model
Time interval is from    3.252 sec. to    4.252 sec.
Spectral model in the cutoff power-law:
------------------------------------------------------------
Parameters  : value       lower 90%   higher 90%
Photon index: 0.20696     ( -1.19473   1.52084 )
Epeak [keV] : 48.2699      ( -8.32959 12.7054 )
Norm@50keV  : 0.111190    ( -0.111818   0.623876 )
------------------------------------------------------------
#Fit statistic  : Chi-Squared                   47.98     using 59 bins.
 Reduced chi-squared = 0.856786
# Null hypothesis probability of 7.68e-01 with 56 degrees of freedom

Photon flux (15-150 keV)    in 1 sec: 1.12059 ( -0.177783  0.17874 ) ph/cm2/s
Energy fluence (15-150 keV)             : 6.95537e-08 ( -1.2595e-08  1.36955e-08 ) ergs/cm2
Time-resolved spectra
Distribution
T90 vs. Hardness ratio plot
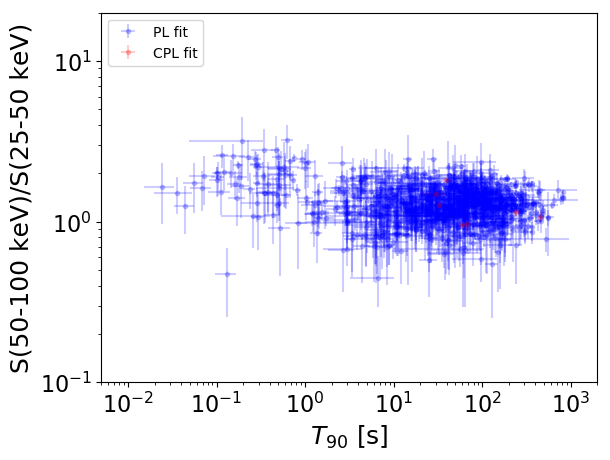
T90                                   = N/A sec.
Hardness ratio (energy fluence ratio) = N/A
S(15-50 keV) vs. S(50-150 keV) plot
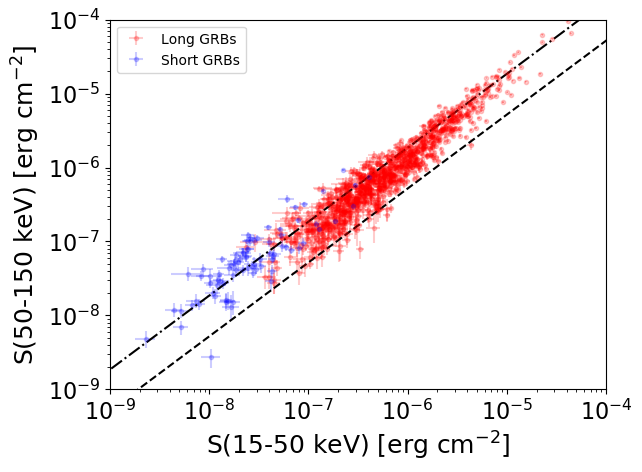
S(15-50 keV)  = N/A
S(50-150 keV) = N/A
The dash-dotted line and the dashed line traces the fluences calculated from the Band function with Epeak = 15 and 150 keV, respectively. Both lines assume a canonical values of alpha = -1 and beta = -2.5.
Mask shadow pattern
IMX = -4.142163713626277E-01, IMY = 9.308937244723164E-02
Spacecraft aspect plot
Bright source in the pre-burst/pre-slew/post-slew images
Pre-burst image of 15-350 keV band
Time interval of the image:
-239.424000 -4.688000

# RAcent  DECcent POSerr Theta    Phi  PeakCts   SNR AngSep     Name
#  [deg]    [deg]    ['] [deg]  [deg]                   [']
315.3025   0.1834    2.6  47.9  145.2   4.3176   4.4 ------	UNKNOWN
 25.3640 -40.6478    2.6  34.2    9.6   1.3894   4.5 ------	UNKNOWN
 54.0112 -40.8601    4.2  53.0   -6.1   1.6753   2.8 ------	UNKNOWN
 57.5569 -39.7481    3.2  55.4   -8.2   2.8788   3.6 ------	UNKNOWN
 59.1265 -34.2457    3.3  55.7  -15.0   3.3844   3.5 ------	UNKNOWN
 23.2752   1.8202    3.5  26.3  -81.3   1.0607   3.3 ------	UNKNOWN
Pre-slew background subtracted image of 15-350 keV band
Time interval of the image:
-4.688000 7.664000

# RAcent  DECcent POSerr Theta    Phi  PeakCts   SNR AngSep     Name
#  [deg]    [deg]    ['] [deg]  [deg]                   [']
333.0582 -42.6233    2.2  38.2   77.2   0.8037   5.2 ------	UNKNOWN
336.8321   3.2410    2.2  29.7  164.9   0.2881   5.2 ------	UNKNOWN
350.3678   6.6468    0.6  23.0 -167.3   0.8671  18.7 ------	UNKNOWN
Post-slew image of 15-350 keV band
Time interval of the image:
200.876600 308.476600

# RAcent  DECcent POSerr Theta    Phi  PeakCts   SNR AngSep     Name
#  [deg]    [deg]    ['] [deg]  [deg]                   [']
135.6561 -40.5827    6.3  42.3  156.5   0.5901   1.8    6.1	Vela X-1
167.7489   6.8593    3.2  35.0   59.8   1.1012   3.6 ------	UNKNOWN