Analysis Summary
Notes:
- 1) No attempt has been made to eliminate the non-significant decimal places.
- 2) This batgrbproduct analysis is done using the HEASARC data.
- 3) This batgrbproduct analysis is using the flight position for the mask-weighting calculation.
======================================================================
                  BAT GRB EVENT DATA PROCESSING REPORT
    Process Script Ver: batgrbproduct v2.48
    Process Start Time: Fri Nov 11 21:37:30 EST 2022
             Host Name: batproc1
   Current Working Dir: /local/data/bat1/alien/Swift_3rdBATcatalog/event/batevent_reproc/trigger1048372
======================================================================

  Trigger: 01048372      Segment: 000

  BAT Trigger Time: 642709453.824   [s; MET]
      Trigger Stop: 642709454.848   [s; MET]
               UTC: 2021-05-14T18:23:46.806320    [includes UTCF correction]
       Where From?: TDRSS position message

  BAT
    RA: 2.94222114163308   Dec: -21.8920543361152  [deg; J2000]

     Catalogged Source?: NO
     Point Source?:      YES
     GRB Indicated?:     YES    [ by BAT flight software ]
     Image S/N Ratio:    22.43
     Image Trigger?:     NO
     Rate S/N Ratio:     128.61959415268  [ if not an image trigger ]
     Image S/N Ratio:    22.43

  Analysis Position:   [ source = BAT ]
    RA: 2.94222114163308   Dec: -21.8920543361152  [deg; J2000]

  Refined Position:   [ source = BAT pre-slew burst ]
    RA: 2.94588278545436   Dec: -21.8971230227294  [deg; J2000]
        { 00h 11m 47.0s , -21d 53' 49.6" }
         +/- 0.654102462409235 [arcmin] (estimated 90% radius based on SNR)
         +/- 0.181302730326634 [arcmin] (formal 1-sigma fit error)
    SNR: 55.7803898986487

  Angular difference between the analysis and refined position is 0.366122 arcmin

  Partial Coding Fraction: 0.796875    [ including projection effects ]

  Duration
     T90: 70.2079999446869 +/- 0.74051872877279
        Measured from: -0.25600004196167
                   to: 69.9519999027252     [s; relative to TRIGTIME]
     T50: 34.6959998607635 +/- 4.32132795543541
        Measured from: 8.0440000295639
                   to: 42.7399998903275     [s; relative to TRIGTIME]


  Fluence
     Peak Flux  (peak 1 second)
        Measured from: -0.519999980926514
                   to: 0.480000019073486     [s; relative to TRIGTIME]
     Total Fluence
        Measured from: -1.08399999141693
                   to: 75.1280000209808     [s; relative to TRIGTIME]

             Band 1     Band 2     Band 3     Band 4
              15-25      25-50     50-100    100-350     keV
 Total     3.853861   4.870782   3.243300   0.733942
           0.068750   0.072753   0.063717   0.051830 [error]
 Peak      0.236611   0.409192   0.384827   0.096096
           0.011858   0.014471   0.014388   0.010239 [error]

     [ fluence units of on-axis counts / fully illuminated detector ]

======================================================================


====== Table of the duration information =============================

        Value   tstart    tstop
T100   76.212   -1.084   75.128
T90    70.208   -0.256   69.952
T50    34.696    8.044   42.740
Peak    1.000   -0.520    0.480


====== Spectral Analysis Summary =====================================

Model      : spectral model: simple power-law (PL) and cutoff power-law (CPL)
Ph_index   : photon index: E^{Ph_index}
Ph_90err   : 90% error of the photon index
Epeak      : Epeak in keV
Epeak_90err: 90% error of Epeak
Norm       : normalization at 50 keV in both the PL model and CPL model
Nomr_90err : 90% error of the normalization
chi2       : Chi-Squared
dof        : degree of freedo

=== Time-averaged spectral analysis ===
(Best model with acceptable fit: N/A)

Model Ph_index Ph_90err_low Ph_90err_hi  Epeak  Epeak_90err_low  Epeak_90err_hi  Norm       Nomr_90err_low    Norm_90err_hi    chi2    dof
PL      -1.655    -0.043      0.043       -           -               -         1.04e-02     -2.26e-04          2.26e-04      39.960   57
CPL     -1.451    -0.171      0.178      145.039     -43.310       393.341      1.29e-02     -2.10e-03          2.62e-03      35.800   56


=== 1-s peak spectral analysis ===
(Best model with acceptable fit: N/A)

Model Ph_index Ph_90err_low Ph_90err_hi  Epeak  Epeak_90err_low  Epeak_90err_hi  Norm       Nomr_90err_low    Norm_90err_hi    chi2    dof
PL      -1.178     -0.070     0.070       -           -               -         7.48e-02     -2.99e-03          2.99e-03      58.400   57
CPL     -0.594     -0.297     0.318      132.808     -28.579        78.051      1.39e-01     -3.69e-02          5.42e-02      46.480   56


=== Fluence/Peak Flux Summary ===

              Model    Band1     Band2     Band3     Band4     Band5     Total
                       15-25     25-50    50-100    100-350    15-150    15-350    keV
Fluence         PL   1.17e-06  1.96e-06  2.49e-06  6.33e-06  7.37e-06  1.19e-05   erg/cm2
      90%_error_low -5.14e-08 -4.90e-08 -6.90e-08 -3.97e-07 -1.66e-07 -4.33e-07   erg/cm2
      90%_error_hi   5.24e-08  4.89e-08  6.88e-08  4.16e-07  1.66e-07  4.47e-07   erg/cm2
Peak flux       PL   5.99e-04  1.02e-02  1.15e-01  1.04e+01  3.22e-01  1.05e+01   ph/cm2/s
      90%_error_low     N/A       N/A       N/A       N/A       N/A       N/A     ph/cm2/s
      90%_error_hi      N/A       N/A       N/A       N/A       N/A       N/A     ph/cm2/s

Fluence        CPL   1.11e-06  1.98e-06  2.52e-06  4.81e-06  7.26e-06  1.04e-05   erg/cm2
      90%_error_low -6.80e-08 -5.23e-08 -7.50e-08 -9.52e-07 -1.92e-07 -9.74e-07   erg/cm2
      90%_error_hi   6.93e-08  5.26e-08  7.55e-08  1.24e-06  1.92e-07  1.25e-06   erg/cm2
Peak flux      CPL   1.97e+00  2.86e+00  2.59e+00  2.12e+00  8.53e+00  9.54e+00   ph/cm2/s
      90%_error_low -2.16e-01 -1.43e-01 -1.40e-01 -4.90e-01 -3.74e-01 -6.30e-01   ph/cm2/s
      90%_error_hi   2.22e-01  1.44e-01  1.42e-01  6.71e-01  3.73e-01  7.58e-01   ph/cm2/s

======================================================================
Image
Pre-slew 15.0-350.0 keV image (Event data)
#   RAcent    DECcent   POSerr    Theta     Phi              Peak Cts       SNR   Name
    2.9459   -21.8971   0.0035    16.0270    67.1769         5.3512328     55.780 TRIG_01048372

Foreground time interval of the image:
 -1.084  17.077 (delta_t =  18.161 [sec])
Background time interval of the image:
-172.723  -1.084 (delta_t = 171.639 [sec])
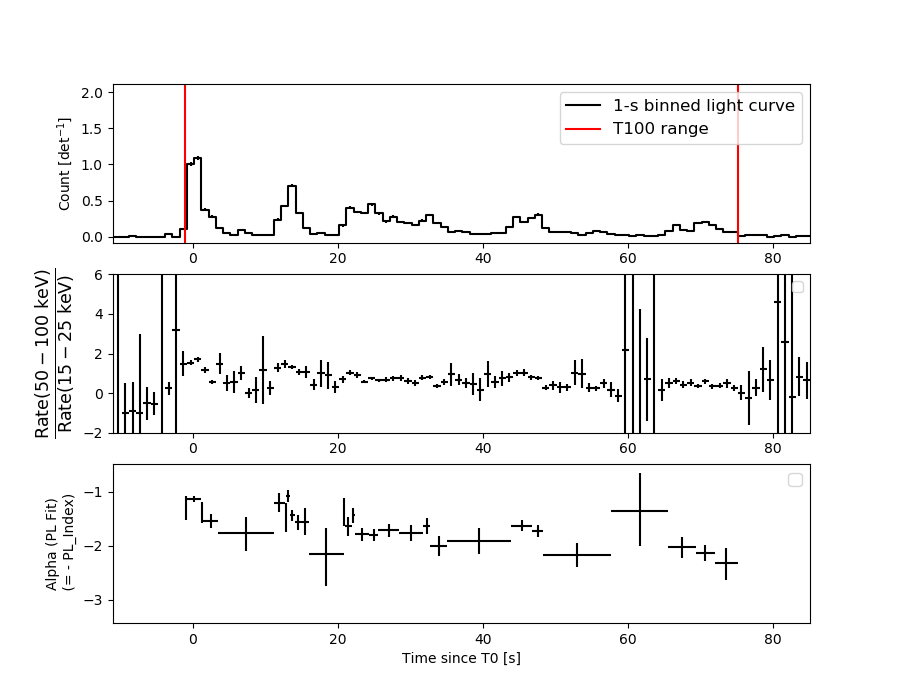
Light Curves
Note: The mask-weighted lightcurves have units of either count/det or counts/sec/det, where a det is 0.4 x 0.4 = 0.16 sq cm.
Full-time range; 1 s binning
Other quick-look light curves:
- 64 ms binning (zoomed)
- 16 ms binning (zoomed)
- 8 ms binning (zoomed)
- 2 ms binning (zoomed)
- SN=5 or 10 s binning (full-time range)
- Raw light curve
Spectra
- 64 ms binning (zoomed)
- 16 ms binning (zoomed)
- 8 ms binning (zoomed)
- 2 ms binning (zoomed)
- SN=5 or 10 s binning (full-time range)
- Raw light curve
Spectra
Notes:
- 1) The fitting includes the systematic errors.
- 2) When the burst includes telescope slew time periods, the fitting uses an average response file made from multiple 5-s response files through out the slew time plus single time preiod for the non-slew times, and weighted by the total counts in the corresponding time period using addrmf. An average response file is needed becuase a spectral fit using the pre-slew DRM will introduce some errors in both a spectral shape and a normalization if the PHA file contains a lot of the slew/post-slew time interval.
- 3) For fits to more complicated models (e.g. a power-law over a cutoff power-law), the BAT team has decided to require a chi-square improvement of more than 6 for each extra dof.
Time averaged spectrum fit using the average DRM
Power-law model
Time interval is from   -1.084 sec. to   75.128 sec.

Spectral model in power-law:
------------------------------------------------------------
Parameters  : value       lower 90%   higher 90%
Photon index: -1.65473     ( -0.0430464   0.0429695 )
Norm@50keV  : 1.04085E-02    ( -0.000225937   0.0002259 )
------------------------------------------------------------
#Fit statistic  : Chi-Squared                   39.96     using 59 bins.
 Reduced chi-squared = 0.701053
# Null hypothesis probability of 9.58e-01 with 57 degrees of freedom

Photon flux (15-150 keV)    in 76.21 sec: 1.36127 ( -0.03391  0.03405 ) ph/cm2/s
Energy fluence (15-150 keV)             : 7.375e-06 ( -1.65555e-07  1.6553e-07 ) ergs/cm2
Cutoff power-law model
Time interval is from   -1.084 sec. to   75.128 sec.
Spectral model in the cutoff power-law:
------------------------------------------------------------
Parameters  : value       lower 90%   higher 90%
Photon index: -1.45056     ( -0.171268   0.178123 )
Epeak [keV] : 145.039      ( -43.3096 393.341 )
Norm@50keV  : 1.29301E-02    ( -0.00209988   0.00262286 )
------------------------------------------------------------
#Fit statistic  : Chi-Squared                   35.80     using 59 bins.
 Reduced chi-squared = 0.639286
# Null hypothesis probability of 9.84e-01 with 56 degrees of freedom

Photon flux (15-150 keV)    in 76.21 sec: 1.33671 ( -0.03907  0.03931 ) ph/cm2/s
Energy fluence (15-150 keV)             : 7.25691e-06 ( -1.92406e-07  1.91811e-07 ) ergs/cm2
1-s peak spectrum fit
Power-law model
Time interval is from   -0.520 sec. to    0.480 sec.

Spectral model in power-law:
------------------------------------------------------------
Parameters  : value       lower 90%   higher 90%
Photon index: -1.17758     ( -0.0697294   0.0697086 )
Norm@50keV  : 7.48113E-02    ( -0.0029893   0.0029892 )
------------------------------------------------------------
#Fit statistic  : Chi-Squared                   58.40     using 59 bins.
 Reduced chi-squared = 1.02456
# Null hypothesis probability of 4.24e-01 with 57 degrees of freedom

Photon flux (15-150 keV)    in 1 sec: 0.321756 (    ) ph/cm2/s
Energy fluence (15-150 keV)             : 7.63959e-07 ( -3.45183e-08  3.46607e-08 ) ergs/cm2
Cutoff power-law model
Time interval is from   -0.520 sec. to    0.480 sec.
Spectral model in the cutoff power-law:
------------------------------------------------------------
Parameters  : value       lower 90%   higher 90%
Photon index: -0.593977     ( -0.297214   0.318422 )
Epeak [keV] : 132.808      ( -28.5789 78.0508 )
Norm@50keV  : 0.139210    ( -0.0369165   0.0542434 )
------------------------------------------------------------
#Fit statistic  : Chi-Squared                   46.48     using 59 bins.
 Reduced chi-squared = 0.83
# Null hypothesis probability of 8.14e-01 with 56 degrees of freedom

Photon flux (15-150 keV)    in 1 sec: 8.52865 ( -0.37357  0.37344 ) ph/cm2/s
Energy fluence (15-150 keV)             : 7.39009e-07 ( -3.74729e-08  3.73632e-08 ) ergs/cm2
Time-resolved spectra
Distribution
T90 vs. Hardness ratio plot
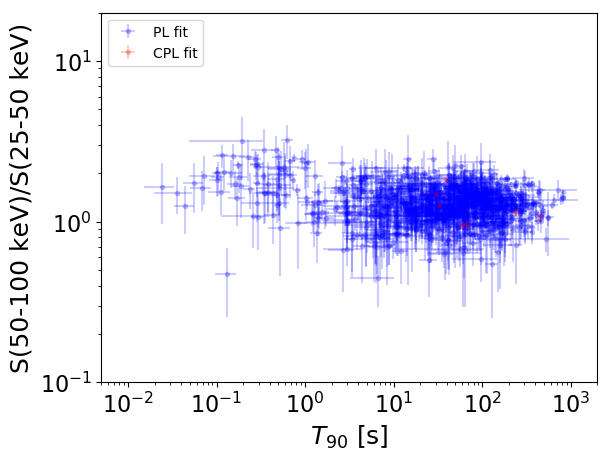
T90                                   = N/A sec.
Hardness ratio (energy fluence ratio) = N/A
S(15-50 keV) vs. S(50-150 keV) plot
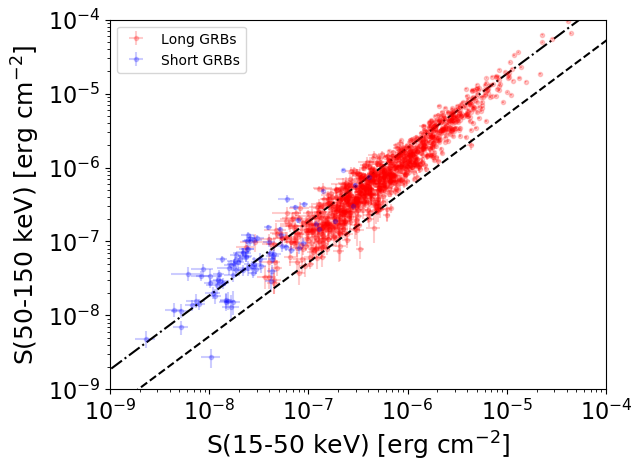
S(15-50 keV)  = N/A
S(50-150 keV) = N/A
The dash-dotted line and the dashed line traces the fluences calculated from the Band function with Epeak = 15 and 150 keV, respectively. Both lines assume a canonical values of alpha = -1 and beta = -2.5.
Mask shadow pattern
IMX = 1.114222770807317E-01, IMY = -2.647645744731804E-01
Spacecraft aspect plot
Bright source in the pre-burst/pre-slew/post-slew images
Pre-burst image of 15-350 keV band
Time interval of the image:
-172.723410 -1.084000

# RAcent  DECcent POSerr Theta    Phi  PeakCts   SNR AngSep     Name
#  [deg]    [deg]    ['] [deg]  [deg]                   [']
330.5718   1.5041    2.3  44.6  129.6   4.1614   5.1 ------	UNKNOWN
Pre-slew background subtracted image of 15-350 keV band
Time interval of the image:
-1.084000 17.076620

# RAcent  DECcent POSerr Theta    Phi  PeakCts   SNR AngSep     Name
#  [deg]    [deg]    ['] [deg]  [deg]                   [']
330.4120  23.5693    2.2  54.1  156.1   2.5175   5.2 ------	UNKNOWN
  2.9459 -21.8971    0.2  16.0   67.2   5.3513  55.8 ------	UNKNOWN
 54.4112 -33.9403    2.7  44.2  -23.3   0.6891   4.3 ------	UNKNOWN
 52.6280 -31.7791    2.7  42.0  -25.3   0.6208   4.2 ------	UNKNOWN
 65.3303 -20.3327    2.9  50.5  -44.4   1.7093   4.0 ------	UNKNOWN
 46.6599  15.7724    2.8  41.3 -100.7   1.4549   4.2 ------	UNKNOWN
Post-slew image of 15-350 keV band
Time interval of the image:
58.876600 962.208900
1353.176000 1553.226000

# RAcent  DECcent POSerr Theta    Phi  PeakCts   SNR AngSep     Name
#  [deg]    [deg]    ['] [deg]  [deg]                   [']
318.7215 -36.1318    2.6  40.8   96.4   9.7638   4.5 ------	UNKNOWN
  9.5969 -70.4527    3.0  48.7   34.0  10.5619   3.8 ------	UNKNOWN
318.6596  -1.6296    2.4  47.6  145.9  12.4764   4.9 ------	UNKNOWN
351.7683 -40.9557    3.4  21.3   60.7   2.6265   3.4 ------	UNKNOWN
335.3328  11.5328    3.9  43.0  175.1   3.9876   3.0 ------	UNKNOWN
332.1798  28.2098    3.0  58.2 -175.1  15.3857   3.8 ------	UNKNOWN
 68.5810 -42.3512    2.8  57.7  -15.9  13.8911   4.1 ------	UNKNOWN
 64.2148 -39.3824    4.1  54.4  -19.5   6.6626   2.8 ------	UNKNOWN
 70.1557 -38.2264    2.9  59.1  -20.6  16.4411   3.9 ------	UNKNOWN
 57.3986 -20.0489    2.9  50.6  -44.6  14.6406   3.9 ------	UNKNOWN