Analysis Summary
Notes:
- 1) No attempt has been made to eliminate the non-significant decimal places.
- 2) This batgrbproduct analysis is done using the HEASARC data.
- 3) This batgrbproduct analysis is using the flight position for the mask-weighting calculation.
======================================================================
BAT GRB EVENT DATA PROCESSING REPORT
Process Script Ver: batgrbproduct v2.48
Process Start Time: Fri Jul 29 23:12:45 EDT 2022
Host Name: batproc1
Current Working Dir: /local/data/bat1/alien/Swift_3rdBATcatalog/event/batevent_reproc/trigger1048783
======================================================================
Trigger: 01048783 Segment: 000
BAT Trigger Time: 642922108.608 [s; MET]
Trigger Stop: 642922109.12 [s; MET]
UTC: 2021-05-17T05:28:01.576140 [includes UTCF correction]
Where From?: TDRSS position message
BAT
RA: 358.174322965366 Dec: -39.1049197741364 [deg; J2000]
Catalogged Source?: NO
Point Source?: YES
GRB Indicated?: YES [ by BAT flight software ]
Image S/N Ratio: 8.47
Image Trigger?: NO
Rate S/N Ratio: 19.5192212959431 [ if not an image trigger ]
Image S/N Ratio: 8.47
Analysis Position: [ source = BAT ]
RA: 358.174322965366 Dec: -39.1049197741364 [deg; J2000]
Refined Position: [ source = BAT pre-slew burst ]
RA: 358.189512339052 Dec: -39.1041292051999 [deg; J2000]
{ 23h 52m 45.5s , -39d 06' 14.9" }
+/- 2.04583340293305 [arcmin] (estimated 90% radius based on SNR)
+/- 0.910817769464141 [arcmin] (formal 1-sigma fit error)
SNR: 10.9400171080399
Angular difference between the analysis and refined position is 0.708803 arcmin
Partial Coding Fraction: 0.7890625 [ including projection effects ]
Duration
T90: 3.05600011348724 +/- 1.39942853899308
Measured from: -0.104000091552734
to: 2.95200002193451 [s; relative to TRIGTIME]
T50: 0.991999983787537 +/- 0.329848430388928
Measured from: 0.184000015258789
to: 1.17599999904633 [s; relative to TRIGTIME]
Fluence
Peak Flux (peak 1 second)
Measured from: -0.180000066757202
to: 0.819999933242798 [s; relative to TRIGTIME]
Total Fluence
Measured from: -0.167999982833862
to: 3.12799990177155 [s; relative to TRIGTIME]
Band 1 Band 2 Band 3 Band 4
15-25 25-50 50-100 100-350 keV
Total 0.112409 0.117755 0.060834 0.011695
0.014223 0.014726 0.011835 0.010065 [error]
Peak 0.061756 0.083627 0.035187 0.012114
0.008642 0.009105 0.007313 0.005845 [error]
[ fluence units of on-axis counts / fully illuminated detector ]
======================================================================
====== Table of the duration information =============================
Value tstart tstop
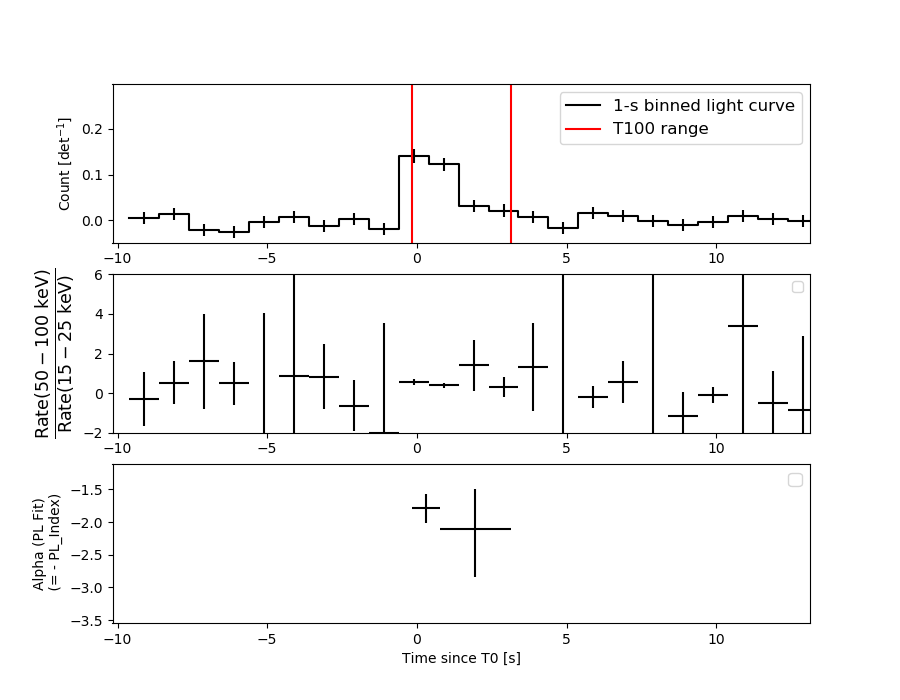
T100 3.296 -0.168 3.128
T90 3.056 -0.104 2.952
T50 0.992 0.184 1.176
Peak 1.000 -0.180 0.820
====== Spectral Analysis Summary =====================================
Model : spectral model: simple power-law (PL) and cutoff power-law (CPL)
Ph_index : photon index: E^{Ph_index}
Ph_90err : 90% error of the photon index
Epeak : Epeak in keV
Epeak_90err: 90% error of Epeak
Norm : normalization at 50 keV in both the PL model and CPL model
Nomr_90err : 90% error of the normalization
chi2 : Chi-Squared
dof : degree of freedo
=== Time-averaged spectral analysis ===
(Best model with acceptable fit: N/A)
Model Ph_index Ph_90err_low Ph_90err_hi Epeak Epeak_90err_low Epeak_90err_hi Norm Nomr_90err_low Norm_90err_hi chi2 dof
PL -1.852 -0.260 0.246 - - - 4.98e-03 -8.72e-04 8.52e-04 67.730 57
CPL -0.979 -0.977 1.409 48.382 -16.471 -48.382 1.61e-02 -1.61e-02 9.88e-02 65.500 56
=== 1-s peak spectral analysis ===
(Best model with acceptable fit: N/A)
Model Ph_index Ph_90err_low Ph_90err_hi Epeak Epeak_90err_low Epeak_90err_hi Norm Nomr_90err_low Norm_90err_hi chi2 dof
PL -1.779 -0.229 0.218 - - - 1.08e-02 -1.70e-03 1.68e-03 68.470 57
CPL 0.650 -1.409 2.005 46.252 -6.456 11.061 2.56e-01 -2.56e-01 3.18e+00 58.240 56
=== Fluence/Peak Flux Summary ===
Model Band1 Band2 Band3 Band4 Band5 Total
15-25 25-50 50-100 100-350 15-150 15-350 keV
Fluence PL 2.92e-08 4.33e-08 4.80e-08 1.00e-07 1.51e-07 2.21e-07 erg/cm2
90%_error_low -5.84e-09 -6.29e-09 -1.10e-08 -3.90e-08 -2.60e-08 -5.27e-08 erg/cm2
90%_error_hi 6.00e-09 6.28e-09 1.13e-08 5.27e-08 2.66e-08 6.34e-08 erg/cm2
Peak flux PL 5.80e-01 4.95e-01 2.88e-01 2.51e-01 1.47e+00 1.61e+00 ph/cm2/s
90%_error_low -1.12e-01 -6.86e-02 -5.72e-02 -8.31e-02 -2.04e-01 -2.27e-01 ph/cm2/s
90%_error_hi 1.16e-01 6.86e-02 5.76e-02 1.04e-01 2.04e-01 2.27e-01 ph/cm2/s
Fluence CPL 2.75e-08 4.85e-08 4.62e-08 2.49e-08 1.38e-07 1.47e-07 erg/cm2
90%_error_low -6.43e-09 -8.59e-09 -1.47e-08 N/A -2.81e-08 -3.59e-08 erg/cm2
90%_error_hi 6.46e-09 9.28e-09 1.30e-08 N/A 3.00e-08 9.55e-08 erg/cm2
Peak flux CPL 4.46e-01 6.41e-01 2.83e-01 2.46e-02 1.39e+00 1.39e+00 ph/cm2/s
90%_error_low -1.40e-01 -1.06e-01 -7.90e-02 -2.46e-02 -2.08e-01 -2.09e-01 ph/cm2/s
90%_error_hi 1.42e-01 1.10e-01 7.56e-02 6.23e-02 2.09e-01 2.12e-01 ph/cm2/s
======================================================================
Image
Pre-slew 15.0-350.0 keV image (Event data)
#   RAcent    DECcent   POSerr    Theta     Phi              Peak Cts       SNR   Name
  358.1895   -39.1041   0.0174    17.6795    59.1062         0.3035949     10.940 TRIG_01048783

Foreground time interval of the image:
 -0.168   3.128 (delta_t =   3.296 [sec])
Background time interval of the image:
-239.608  -0.168 (delta_t = 239.440 [sec])
Light Curves
Note: The mask-weighted lightcurves have units of either count/det or counts/sec/det, where a det is 0.4 x 0.4 = 0.16 sq cm.
Full-time range; 1 s binning
Other quick-look light curves:
- 64 ms binning (zoomed)
- 16 ms binning (zoomed)
- 8 ms binning (zoomed)
- 2 ms binning (zoomed)
- SN=5 or 10 s binning (full-time range)
- Raw light curve
Spectra
- 64 ms binning (zoomed)
- 16 ms binning (zoomed)
- 8 ms binning (zoomed)
- 2 ms binning (zoomed)
- SN=5 or 10 s binning (full-time range)
- Raw light curve
Spectra
Notes:
- 1) The fitting includes the systematic errors.
- 2) When the burst includes telescope slew time periods, the fitting uses an average response file made from multiple 5-s response files through out the slew time plus single time preiod for the non-slew times, and weighted by the total counts in the corresponding time period using addrmf. An average response file is needed becuase a spectral fit using the pre-slew DRM will introduce some errors in both a spectral shape and a normalization if the PHA file contains a lot of the slew/post-slew time interval.
- 3) For fits to more complicated models (e.g. a power-law over a cutoff power-law), the BAT team has decided to require a chi-square improvement of more than 6 for each extra dof.
Time averaged spectrum fit using the average DRM
Power-law model
Time interval is from   -0.168 sec. to    3.128 sec.

Spectral model in power-law:
------------------------------------------------------------
Parameters  : value       lower 90%   higher 90%
Photon index: -1.85241     ( -0.260135   0.246014 )
Norm@50keV  : 4.98189E-03    ( -0.000872253   0.000851568 )
------------------------------------------------------------
#Fit statistic  : Chi-Squared                   67.73     using 59 bins.
 Reduced chi-squared = 1.18825
# Null hypothesis probability of 1.56e-01 with 57 degrees of freedom

Photon flux (15-150 keV)    in 3.296 sec: 0.700981 ( -0.101592  0.101609 ) ph/cm2/s
Energy fluence (15-150 keV)             : 1.51004e-07 ( -2.59842e-08  2.66431e-08 ) ergs/cm2
Cutoff power-law model
Time interval is from   -0.168 sec. to    3.128 sec.
Spectral model in the cutoff power-law:
------------------------------------------------------------
Parameters  : value       lower 90%   higher 90%
Photon index: -0.9791     ( -0.976657   1.40894 )
Epeak [keV] : 48.3822      ( -16.4716 -48.3825 )
Norm@50keV  : 1.61425E-02    ( -0.016142   0.098804 )
------------------------------------------------------------
#Fit statistic  : Chi-Squared                   65.50     using 59 bins.
 Reduced chi-squared = 1.16964
# Null hypothesis probability of 1.80e-01 with 56 degrees of freedom

Photon flux (15-150 keV)    in 3.296 sec: 0.684401 ( -0.102988  0.10317 ) ph/cm2/s
Energy fluence (15-150 keV)             : 1.38385e-07 ( -2.80613e-08  2.99787e-08 ) ergs/cm2
1-s peak spectrum fit
Power-law model
Time interval is from   -0.180 sec. to    0.820 sec.

Spectral model in power-law:
------------------------------------------------------------
Parameters  : value       lower 90%   higher 90%
Photon index: -1.77938     ( -0.229124   0.218147 )
Norm@50keV  : 1.07693E-02    ( -0.0017041   0.00167544 )
------------------------------------------------------------
#Fit statistic  : Chi-Squared                   68.47     using 59 bins.
 Reduced chi-squared = 1.20123
# Null hypothesis probability of 1.42e-01 with 57 degrees of freedom

Photon flux (15-150 keV)    in 1 sec: 1.47237 ( -0.20413  0.20417 ) ph/cm2/s
Energy fluence (15-150 keV)             : 9.92385e-08 ( -1.58761e-08  1.61573e-08 ) ergs/cm2
Cutoff power-law model
Time interval is from   -0.180 sec. to    0.820 sec.
Spectral model in the cutoff power-law:
------------------------------------------------------------
Parameters  : value       lower 90%   higher 90%
Photon index: 0.650391     ( -1.43356   1.98061 )
Epeak [keV] : 46.2521      ( -6.3817 11.1353 )
Norm@50keV  : 0.256358    ( -0.270148   3.16881 )
------------------------------------------------------------
#Fit statistic  : Chi-Squared                   58.24     using 59 bins.
 Reduced chi-squared = 1.04
# Null hypothesis probability of 3.93e-01 with 56 degrees of freedom

Photon flux (15-150 keV)    in 1 sec: 1.39211 ( -0.2078  0.2086 ) ph/cm2/s
Energy fluence (15-150 keV)             : 8.4598e-08 ( -1.43183e-08  1.63319e-08 ) ergs/cm2
Time-resolved spectra
Distribution
T90 vs. Hardness ratio plot
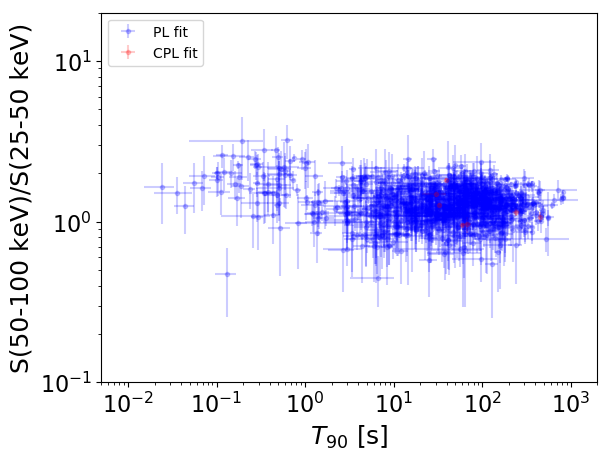
T90                                   = N/A sec.
Hardness ratio (energy fluence ratio) = N/A
S(15-50 keV) vs. S(50-150 keV) plot
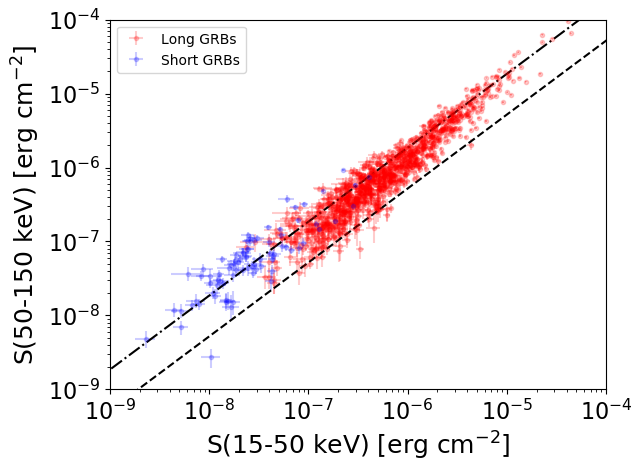
S(15-50 keV)  = N/A
S(50-150 keV) = N/A
The dash-dotted line and the dashed line traces the fluences calculated from the Band function with Epeak = 15 and 150 keV, respectively. Both lines assume a canonical values of alpha = -1 and beta = -2.5.
Mask shadow pattern
IMX = 1.636593379262233E-01, IMY = -2.735224024754572E-01
Spacecraft aspect plot
Bright source in the pre-burst/pre-slew/post-slew images
Pre-burst image of 15-350 keV band
Time interval of the image:
-239.608000 -0.168000

# RAcent  DECcent POSerr Theta    Phi  PeakCts   SNR AngSep     Name
#  [deg]    [deg]    ['] [deg]  [deg]                   [']
 42.3231 -65.0125    3.5  50.1   26.4   3.5501   3.3 ------	UNKNOWN
318.6359  -4.6968    2.8  46.2  152.1   2.7202   4.1 ------	UNKNOWN
 28.3906  -6.4829    2.7  29.0  -71.4   1.5877   4.3 ------	UNKNOWN
Pre-slew background subtracted image of 15-350 keV band
Time interval of the image:
-0.168000 3.128000

# RAcent  DECcent POSerr Theta    Phi  PeakCts   SNR AngSep     Name
#  [deg]    [deg]    ['] [deg]  [deg]                   [']
358.1895 -39.1041    1.0  17.7   59.1   0.3036  10.9 ------	UNKNOWN
341.9549  31.7016    2.2  57.2 -154.4   0.5603   5.3 ------	UNKNOWN
Post-slew image of 15-350 keV band
Time interval of the image:
50.892590 962.452000

# RAcent  DECcent POSerr Theta    Phi  PeakCts   SNR AngSep     Name
#  [deg]    [deg]    ['] [deg]  [deg]                   [']
322.8268   6.9284    2.7  56.5  173.6  15.7234   4.3 ------	UNKNOWN
 80.2454 -47.0264    3.1  57.7  -15.8  11.7771   3.7 ------	UNKNOWN
341.8970  15.9558    3.0  57.1 -161.5  13.1687   3.9 ------	UNKNOWN
359.0919  11.1470    3.7  50.3 -141.7   7.2871   3.1 ------	UNKNOWN
 10.6898   6.1884    3.1  46.7 -125.6  11.2863   3.7 ------	UNKNOWN