Analysis Summary
Notes:
- 1) No attempt has been made to eliminate the non-significant decimal places.
- 2) This batgrbproduct analysis is done using the HEASARC data.
- 3) This batgrbproduct analysis is using the flight position for the mask-weighting calculation.
======================================================================
                  BAT GRB EVENT DATA PROCESSING REPORT
    Process Script Ver: batgrbproduct v2.48
    Process Start Time: Fri Jul 29 23:08:20 EDT 2022
             Host Name: batproc1
   Current Working Dir: /local/data/bat1/alien/Swift_3rdBATcatalog/event/batevent_reproc/trigger1051453
======================================================================

  Trigger: 01051453      Segment: 000

  BAT Trigger Time: 643792096   [s; MET]
      Trigger Stop: 643792192   [s; MET]
               UTC: 2021-05-27T07:07:48.910100    [includes UTCF correction]
       Where From?: TDRSS position message

  BAT
    RA: 172.354664489761   Dec: 31.618254634337  [deg; J2000]

     Catalogged Source?: NO
     Point Source?:      YES
     GRB Indicated?:     YES    [ by BAT flight software ]
     Image S/N Ratio:    10.78
     Image Trigger?:     YES
     Rate S/N Ratio:     0  [ if not an image trigger ]
     Image S/N Ratio:    10.78

  Analysis Position:   [ source = BAT ]
    RA: 172.354664489761   Dec: 31.618254634337  [deg; J2000]

  Refined Position:   [ source = BAT pre-slew burst ]
    RA: 172.347546324808   Dec: 31.6280234850647  [deg; J2000]
        { 11h 29m 23.4s , +31d 37' 40.9" }
         +/- 1.81750004971886 [arcmin] (estimated 90% radius based on SNR)
         +/- 0.631952065766921 [arcmin] (formal 1-sigma fit error)
    SNR: 12.955095560891

  Angular difference between the analysis and refined position is 0.689788 arcmin

  Partial Coding Fraction: 0.90625    [ including projection effects ]

  Duration
     T90: 64.4639999866486 +/- 10.6299790530767
        Measured from: -11.9359999895096
                   to: 52.527999997139     [s; relative to TRIGTIME]
     T50: 40.4199999570847 +/- 10.6617319617024
        Measured from: 1.46399998664856
                   to: 41.8839999437332     [s; relative to TRIGTIME]


  Fluence
     Peak Flux  (peak 1 second)
        Measured from: 17.8639999628067
                   to: 18.8639999628067     [s; relative to TRIGTIME]
     Total Fluence
        Measured from: -18.3200000524521
                   to: 65.7120000123978     [s; relative to TRIGTIME]

             Band 1     Band 2     Band 3     Band 4
              15-25      25-50     50-100    100-350     keV
 Total     0.609067   0.501267   0.271803  -0.016817
           0.055054   0.056674   0.049806   0.045736 [error]
 Peak      0.018365   0.022294   0.015860  -0.001000
           0.006121   0.006162   0.005625   0.005032 [error]

     [ fluence units of on-axis counts / fully illuminated detector ]

======================================================================


====== Table of the duration information =============================

        Value   tstart    tstop
T100   84.032  -18.320   65.712
T90    64.464  -11.936   52.528
T50    40.420    1.464   41.884
Peak    1.000   17.864   18.864


====== Spectral Analysis Summary =====================================

Model      : spectral model: simple power-law (PL) and cutoff power-law (CPL)
Ph_index   : photon index: E^{Ph_index}
Ph_90err   : 90% error of the photon index
Epeak      : Epeak in keV
Epeak_90err: 90% error of Epeak
Norm       : normalization at 50 keV in both the PL model and CPL model
Nomr_90err : 90% error of the normalization
chi2       : Chi-Squared
dof        : degree of freedo

=== Time-averaged spectral analysis ===
(Best model with acceptable fit: N/A)

Model Ph_index Ph_90err_low Ph_90err_hi  Epeak  Epeak_90err_low  Epeak_90err_hi  Norm       Nomr_90err_low    Norm_90err_hi    chi2    dof
PL      -2.268    -0.258      0.235       -           -               -         8.65e-04     -1.55e-04          1.51e-04      48.740   57
CPL     -1.868    -0.142      1.055       12.706     -12.010        34.651      1.52e-03     -5.11e-04          5.19e-03      48.160   56


=== 1-s peak spectral analysis ===
(Best model with acceptable fit: N/A)

Model Ph_index Ph_90err_low Ph_90err_hi  Epeak  Epeak_90err_low  Epeak_90err_hi  Norm       Nomr_90err_low    Norm_90err_hi    chi2    dof
PL      -1.654     -0.649     0.593       -           -               -         3.39e-03     -1.29e-03          1.22e-03      43.570   57
CPL     -1.332     -1.003     2.636       93.583     -93.583       -93.583      5.11e-03     -5.11e-03          2.32e-01      43.580   56


=== Fluence/Peak Flux Summary ===

              Model    Band1     Band2     Band3     Band4     Band5     Total
                       15-25     25-50    50-100    100-350    15-150    15-350    keV
Fluence         PL   1.92e-07  2.22e-07  1.84e-07  2.57e-07  6.91e-07  8.55e-07   erg/cm2
      90%_error_low -2.86e-08 -2.77e-08 -4.38e-08 -1.02e-07 -9.99e-08 -1.63e-07   erg/cm2
      90%_error_hi   2.91e-08  2.72e-08  4.62e-08  1.39e-07  1.04e-07  1.92e-07   erg/cm2
Peak flux       PL   1.62e-01  1.49e-01  9.45e-02  9.21e-02  4.44e-01  4.97e-01   ph/cm2/s
      90%_error_low -7.82e-02 -4.98e-02 -4.47e-02 -6.37e-02 -1.46e-01 -1.67e-01   ph/cm2/s
      90%_error_hi   8.73e-02  4.93e-02  4.51e-02  1.17e-01  1.46e-01  1.71e-01   ph/cm2/s

Fluence        CPL   1.88e-07  2.32e-07  1.76e-07  1.19e-07  6.61e-07  7.14e-07   erg/cm2
      90%_error_low -3.11e-08 -2.93e-08 -5.37e-08 -9.61e-08 -1.11e-07 -1.57e-07   erg/cm2
      90%_error_hi   2.90e-08  3.66e-08  4.88e-08  2.19e-07  1.16e-07  2.62e-07   erg/cm2
Peak flux      CPL   1.59e-01  1.51e-01  9.51e-02  7.52e-02  4.41e-01  4.81e-01   ph/cm2/s
      90%_error_low -8.69e-02 -5.17e-02 -9.51e-02 -7.52e-02 -1.49e-01 -1.82e-01   ph/cm2/s
      90%_error_hi   9.02e-02  6.35e-02  4.87e-02  1.30e-01  1.46e-01  1.83e-01   ph/cm2/s

======================================================================
Image
Pre-slew 15.0-350.0 keV image (Event data)
#   RAcent    DECcent   POSerr    Theta     Phi              Peak Cts       SNR   Name
  172.3475    31.6280   0.0150    25.8945  -168.5320         1.4837795     12.955 TRIG_01051453

Foreground time interval of the image:
-18.320  65.712 (delta_t =  84.032 [sec])
Background time interval of the image:
-239.000 -18.320 (delta_t = 220.680 [sec])
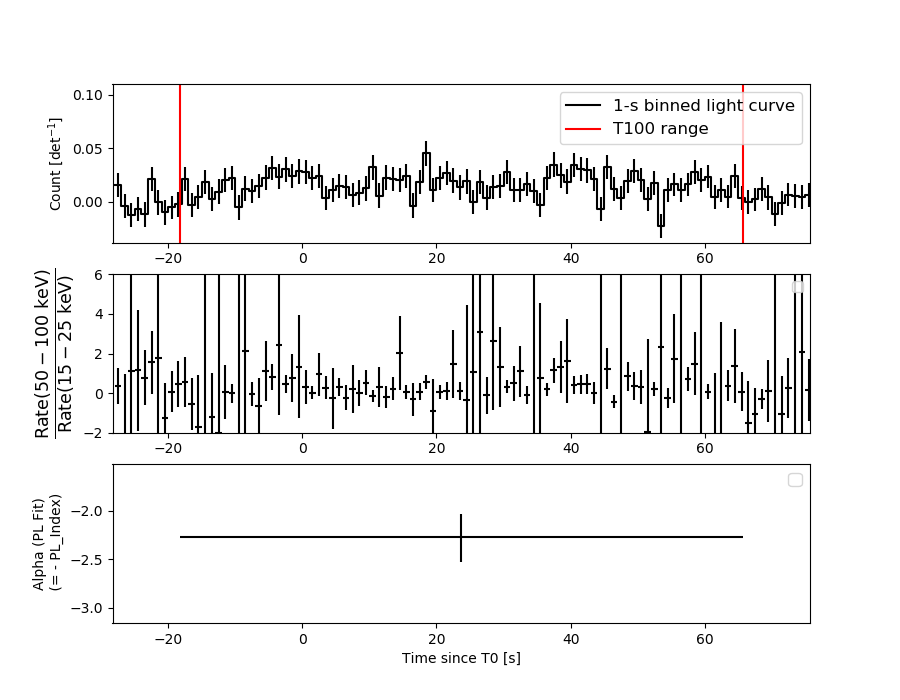
Light Curves
Note: The mask-weighted lightcurves have units of either count/det or counts/sec/det, where a det is 0.4 x 0.4 = 0.16 sq cm.
Full-time range; 1 s binning
Other quick-look light curves:
- 64 ms binning (zoomed)
- 16 ms binning (zoomed)
- 8 ms binning (zoomed)
- 2 ms binning (zoomed)
- SN=5 or 10 s binning (full-time range)
- Raw light curve
Spectra
- 64 ms binning (zoomed)
- 16 ms binning (zoomed)
- 8 ms binning (zoomed)
- 2 ms binning (zoomed)
- SN=5 or 10 s binning (full-time range)
- Raw light curve
Spectra
Notes:
- 1) The fitting includes the systematic errors.
- 2) When the burst includes telescope slew time periods, the fitting uses an average response file made from multiple 5-s response files through out the slew time plus single time preiod for the non-slew times, and weighted by the total counts in the corresponding time period using addrmf. An average response file is needed becuase a spectral fit using the pre-slew DRM will introduce some errors in both a spectral shape and a normalization if the PHA file contains a lot of the slew/post-slew time interval.
- 3) For fits to more complicated models (e.g. a power-law over a cutoff power-law), the BAT team has decided to require a chi-square improvement of more than 6 for each extra dof.
Time averaged spectrum fit using the average DRM
Power-law model
Time interval is from  -18.320 sec. to   65.712 sec.

Spectral model in power-law:
------------------------------------------------------------
Parameters  : value       lower 90%   higher 90%
Photon index: -2.26796     ( -0.25761   0.235494 )
Norm@50keV  : 8.65069E-04    ( -0.000154536   0.000151016 )
------------------------------------------------------------
#Fit statistic  : Chi-Squared                   48.74     using 59 bins.
 Reduced chi-squared = 0.855088
# Null hypothesis probability of 7.74e-01 with 57 degrees of freedom

Photon flux (15-150 keV)    in 84.03 sec: 0.148546 ( -0.016927  0.016928 ) ph/cm2/s
Energy fluence (15-150 keV)             : 6.90867e-07 ( -9.99117e-08  1.03506e-07 ) ergs/cm2
Cutoff power-law model
Time interval is from  -18.320 sec. to   65.712 sec.
Spectral model in the cutoff power-law:
------------------------------------------------------------
Parameters  : value       lower 90%   higher 90%
Photon index: -1.86787     ( -0.141548   1.05511 )
Epeak [keV] : 12.7057      ( -12.0102 34.651 )
Norm@50keV  : 1.51514E-03    ( -0.000511266   0.00519152 )
------------------------------------------------------------
#Fit statistic  : Chi-Squared                   48.16     using 59 bins.
 Reduced chi-squared = 0.86
# Null hypothesis probability of 7.63e-01 with 56 degrees of freedom

Photon flux (15-150 keV)    in 84.03 sec: 0.148346 ( -0.016755  0.017212 ) ph/cm2/s
Energy fluence (15-150 keV)             : 6.61096e-07 ( -1.10828e-07  1.15964e-07 ) ergs/cm2
1-s peak spectrum fit
Power-law model
Time interval is from   17.864 sec. to   18.864 sec.

Spectral model in power-law:
------------------------------------------------------------
Parameters  : value       lower 90%   higher 90%
Photon index: -1.65442     ( -0.648794   0.592877 )
Norm@50keV  : 3.39196E-03    ( -0.00129424   0.00122175 )
------------------------------------------------------------
#Fit statistic  : Chi-Squared                   43.57     using 59 bins.
 Reduced chi-squared = 0.764386
# Null hypothesis probability of 9.05e-01 with 57 degrees of freedom

Photon flux (15-150 keV)    in 1 sec: 0.443572 ( -0.146045  0.146188 ) ph/cm2/s
Energy fluence (15-150 keV)             : 3.1537e-08 ( -1.20798e-08  1.27575e-08 ) ergs/cm2
Cutoff power-law model
Time interval is from   17.864 sec. to   18.864 sec.
Spectral model in the cutoff power-law:
------------------------------------------------------------
Parameters  : value       lower 90%   higher 90%
Photon index: -1.60175     ( -0.982396   2.65643 )
Epeak [keV] : 315.136      ( -276.653 -276.653 )
Norm@50keV  : 3.62663E-03    ( -0.00372858   0.233527 )
------------------------------------------------------------
#Fit statistic  : Chi-Squared                   43.56     using 59 bins.
 Reduced chi-squared = 0.777857
# Null hypothesis probability of 8.87e-01 with 56 degrees of freedom

Photon flux (15-150 keV)    in 1 sec: 0.441298 ( -0.148682  0.145739 ) ph/cm2/s
Energy fluence (15-150 keV)             : 3.10857e-08 ( -1.35275e-08  1.30897e-08 ) ergs/cm2
Time-resolved spectra
Distribution
T90 vs. Hardness ratio plot
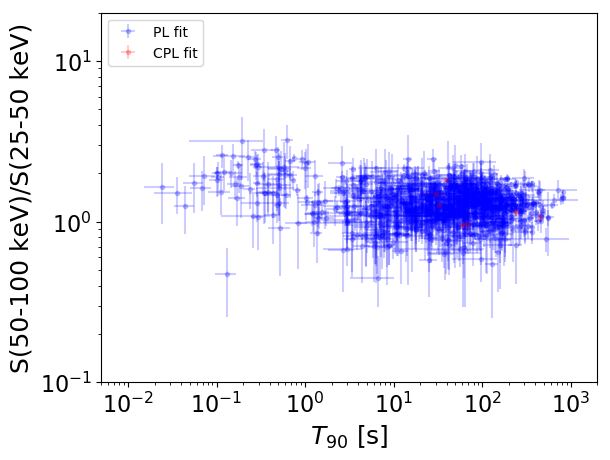
T90                                   = N/A sec.
Hardness ratio (energy fluence ratio) = N/A
S(15-50 keV) vs. S(50-150 keV) plot
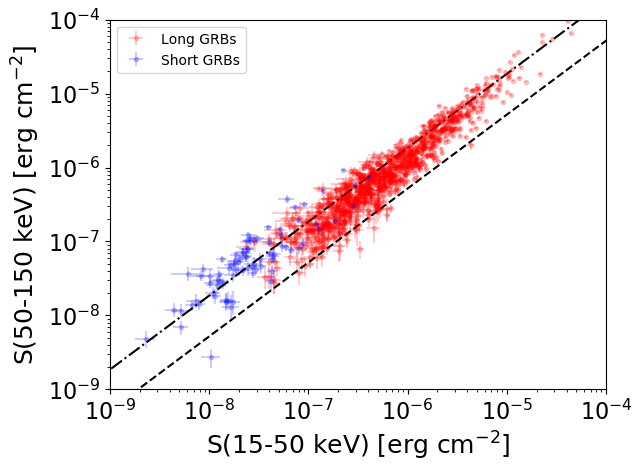
S(15-50 keV)  = N/A
S(50-150 keV) = N/A
The dash-dotted line and the dashed line traces the fluences calculated from the Band function with Epeak = 15 and 150 keV, respectively. Both lines assume a canonical values of alpha = -1 and beta = -2.5.
Mask shadow pattern
IMX = -4.757645259286623E-01, IMY = 9.651829944906765E-02
Spacecraft aspect plot
Bright source in the pre-burst/pre-slew/post-slew images
Pre-burst image of 15-350 keV band
Time interval of the image:
-239.000000 -18.320000

# RAcent  DECcent POSerr Theta    Phi  PeakCts   SNR AngSep     Name
#  [deg]    [deg]    ['] [deg]  [deg]                   [']
189.6189   4.0047    2.9  48.4  151.5   3.5344   4.0 ------	UNKNOWN
260.0341  58.3873    2.9  36.6   19.5   1.4271   4.0 ------	UNKNOWN
181.9985  57.1557    2.4   8.4  -83.8   1.0469   4.7 ------	UNKNOWN
150.0746  40.3320    3.3  31.9 -128.4   1.2560   3.5 ------	UNKNOWN
339.6598  68.3360    2.9  56.8  -19.7   4.0209   4.0 ------	UNKNOWN
125.5039  50.0180    3.9  41.3  -98.9   3.6815   3.0 ------	UNKNOWN
Pre-slew background subtracted image of 15-350 keV band
Time interval of the image:
-18.320000 65.712000

# RAcent  DECcent POSerr Theta    Phi  PeakCts   SNR AngSep     Name
#  [deg]    [deg]    ['] [deg]  [deg]                   [']
202.5974  33.3391    1.9  20.0  124.0   0.8022   6.2 ------	UNKNOWN
172.3476  31.6280    0.9  25.9 -168.5   1.4836  13.0 ------	UNKNOWN
Post-slew image of 15-350 keV band
Time interval of the image:
161.900590 704.200610

# RAcent  DECcent POSerr Theta    Phi  PeakCts   SNR AngSep     Name
#  [deg]    [deg]    ['] [deg]  [deg]                   [']
254.4207  35.3138   18.6  15.4   57.2  -0.2836  -0.6    2.5	Her X-1
299.5303  35.2056    2.3  44.0    3.9   3.8328   4.9    3.0	Cyg X-1
308.2336  41.0082    9.1  46.6   -8.2   0.9466   1.3    6.5	Cyg X-3
290.7060  34.4497    2.6  38.5   11.1   2.8805   4.4 ------	UNKNOWN
189.0844  24.4087    3.7  47.3  179.7   2.8394   3.1 ------	UNKNOWN