Analysis Summary
Notes:
- 1) No attempt has been made to eliminate the non-significant decimal places.
- 2) This batgrbproduct analysis is done using the HEASARC data.
- 3) This batgrbproduct analysis is using the flight position for the mask-weighting calculation.
======================================================================
BAT GRB EVENT DATA PROCESSING REPORT
Process Script Ver: batgrbproduct v2.48
Process Start Time: Fri Jul 29 23:06:24 EDT 2022
Host Name: batproc1
Current Working Dir: /local/data/bat1/alien/Swift_3rdBATcatalog/event/batevent_reproc/trigger1054627
======================================================================
Trigger: 01054627 Segment: 000
BAT Trigger Time: 645030250.56 [s; MET]
Trigger Stop: 645030251.584 [s; MET]
UTC: 2021-06-10T15:03:43.387320 [includes UTCF correction]
Where From?: TDRSS position message
BAT
RA: 204.285446740885 Dec: 14.4803131180607 [deg; J2000]
Catalogged Source?: NO
Point Source?: YES
GRB Indicated?: YES [ by BAT flight software ]
Image S/N Ratio: 7.79
Image Trigger?: NO
Rate S/N Ratio: 18.8148877222268 [ if not an image trigger ]
Image S/N Ratio: 7.79
Analysis Position: [ source = BAT ]
RA: 204.285446740885 Dec: 14.4803131180607 [deg; J2000]
Refined Position: [ source = BAT pre-slew burst ]
RA: 204.284016860347 Dec: 14.4756955581358 [deg; J2000]
{ 13h 37m 08.2s , +14d 28' 32.5" }
+/- 1.70591992025749 [arcmin] (estimated 90% radius based on SNR)
+/- 0.647891043698896 [arcmin] (formal 1-sigma fit error)
SNR: 14.1823726816602
Angular difference between the analysis and refined position is 0.289239 arcmin
Partial Coding Fraction: 0.265625 [ including projection effects ]
Duration
T90: 13.6160000562668 +/- 3.15130957354563
Measured from: -4.69599997997284
to: 8.92000007629395 [s; relative to TRIGTIME]
T50: 4.25599992275238 +/- 1.25628024155385
Measured from: -1.76799988746643
to: 2.48800003528595 [s; relative to TRIGTIME]
Fluence
Peak Flux (peak 1 second)
Measured from: -0.291999936103821
to: 0.708000063896179 [s; relative to TRIGTIME]
Total Fluence
Measured from: -5.97599995136261
to: 11.3519999980927 [s; relative to TRIGTIME]
Band 1 Band 2 Band 3 Band 4
15-25 25-50 50-100 100-350 keV
Total 0.432041 0.490455 0.475982 0.151034
0.052513 0.055938 0.048528 0.040521 [error]
Peak 0.083854 0.103429 0.094521 0.018671
0.014870 0.016417 0.013957 0.010971 [error]
[ fluence units of on-axis counts / fully illuminated detector ]
======================================================================
====== Table of the duration information =============================
Value tstart tstop
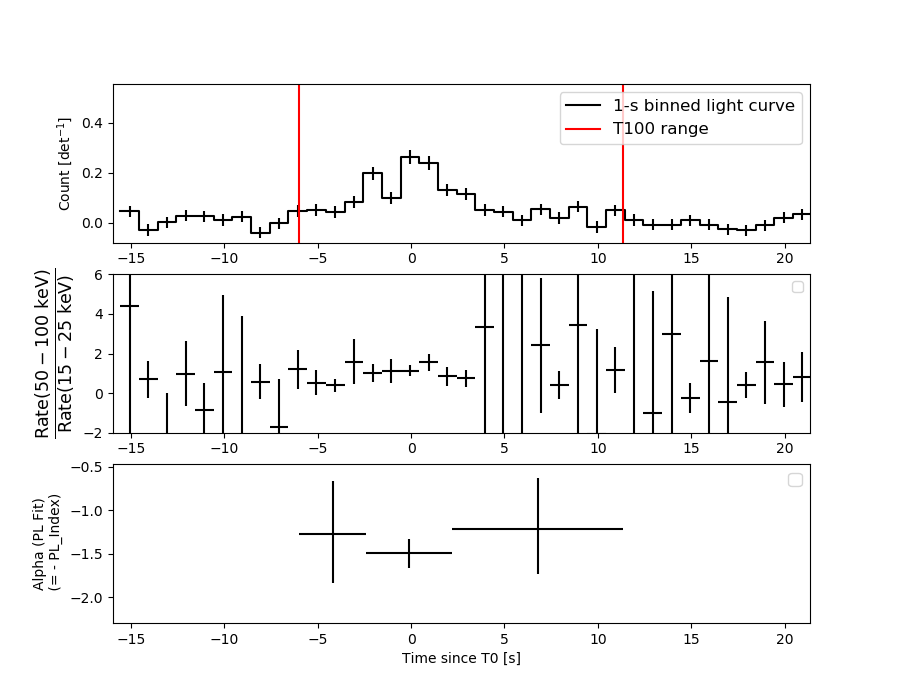
T100 17.328 -5.976 11.352
T90 13.616 -4.696 8.920
T50 4.256 -1.768 2.488
Peak 1.000 -0.292 0.708
====== Spectral Analysis Summary =====================================
Model : spectral model: simple power-law (PL) and cutoff power-law (CPL)
Ph_index : photon index: E^{Ph_index}
Ph_90err : 90% error of the photon index
Epeak : Epeak in keV
Epeak_90err: 90% error of Epeak
Norm : normalization at 50 keV in both the PL model and CPL model
Nomr_90err : 90% error of the normalization
chi2 : Chi-Squared
dof : degree of freedo
=== Time-averaged spectral analysis ===
(Best model with acceptable fit: N/A)
Model Ph_index Ph_90err_low Ph_90err_hi Epeak Epeak_90err_low Epeak_90err_hi Norm Nomr_90err_low Norm_90err_hi chi2 dof
PL -1.413 -0.186 0.187 - - - 6.23e-03 -6.45e-04 6.43e-04 66.110 57
CPL -1.408 -0.189 0.185 9999.090 -9999.090 -9999.090 6.25e-03 -6.25e-03 3.31e-03 66.130 56
=== 1-s peak spectral analysis ===
(Best model with acceptable fit: N/A)
Model Ph_index Ph_90err_low Ph_90err_hi Epeak Epeak_90err_low Epeak_90err_hi Norm Nomr_90err_low Norm_90err_hi chi2 dof
PL -1.507 -0.259 0.255 - - - 2.01e-02 -3.18e-03 3.16e-03 47.960 57
CPL -1.196 -0.553 1.117 131.899 -131.899 -131.899 2.90e-02 -2.90e-02 7.30e-02 47.650 56
=== Fluence/Peak Flux Summary ===
Model Band1 Band2 Band3 Band4 Band5 Total
15-25 25-50 50-100 100-350 15-150 15-350 keV
Fluence PL 1.27e-07 2.46e-07 3.70e-07 1.20e-06 1.04e-06 1.95e-06 erg/cm2
90%_error_low -2.37e-08 -2.82e-08 -4.85e-08 -3.15e-07 -1.18e-07 -3.52e-07 erg/cm2
90%_error_hi 2.49e-08 2.77e-08 4.78e-08 3.84e-07 1.18e-07 4.08e-07 erg/cm2
Peak flux PL 8.35e-01 8.37e-01 5.89e-01 6.57e-01 2.52e+00 2.92e+00 ph/cm2/s
90%_error_low -2.09e-01 -1.39e-01 -1.14e-01 -2.25e-01 -3.96e-01 -4.53e-01 ph/cm2/s
90%_error_hi 2.22e-01 1.37e-01 1.12e-01 2.83e-01 3.96e-01 4.55e-01 ph/cm2/s
Fluence CPL 1.27e-07 2.43e-07 3.70e-07 1.31e-06 1.05e-06 1.94e-06 erg/cm2
90%_error_low N/A -3.50e-08 N/A -6.73e-07 -1.63e-07 -5.52e-07 erg/cm2
90%_error_hi N/A 4.11e-08 N/A 2.37e-07 1.53e-07 3.89e-07 erg/cm2
Peak flux CPL 7.91e-01 8.65e-01 6.09e-01 4.67e-01 2.50e+00 2.73e+00 ph/cm2/s
90%_error_low -2.48e-01 -1.58e-01 -1.26e-01 -4.67e-01 -4.03e-01 -5.28e-01 ph/cm2/s
90%_error_hi 2.52e-01 1.68e-01 1.34e-01 2.66e-01 4.02e-01 6.00e-01 ph/cm2/s
======================================================================
Image
Pre-slew 15.0-350.0 keV image (Event data)
#   RAcent    DECcent   POSerr    Theta     Phi              Peak Cts       SNR   Name
  204.2840    14.4757   0.0136    35.7802    49.3752         1.5435991     14.182 TRIG_01054627

Foreground time interval of the image:
 -5.976  11.352 (delta_t =  17.328 [sec])
Background time interval of the image:
-239.560  -5.976 (delta_t = 233.584 [sec])
Light Curves
Note: The mask-weighted lightcurves have units of either count/det or counts/sec/det, where a det is 0.4 x 0.4 = 0.16 sq cm.
Full-time range; 1 s binning
Other quick-look light curves:
- 64 ms binning (zoomed)
- 16 ms binning (zoomed)
- 8 ms binning (zoomed)
- 2 ms binning (zoomed)
- SN=5 or 10 s binning (full-time range)
- Raw light curve
Spectra
- 64 ms binning (zoomed)
- 16 ms binning (zoomed)
- 8 ms binning (zoomed)
- 2 ms binning (zoomed)
- SN=5 or 10 s binning (full-time range)
- Raw light curve
Spectra
Notes:
- 1) The fitting includes the systematic errors.
- 2) When the burst includes telescope slew time periods, the fitting uses an average response file made from multiple 5-s response files through out the slew time plus single time preiod for the non-slew times, and weighted by the total counts in the corresponding time period using addrmf. An average response file is needed becuase a spectral fit using the pre-slew DRM will introduce some errors in both a spectral shape and a normalization if the PHA file contains a lot of the slew/post-slew time interval.
- 3) For fits to more complicated models (e.g. a power-law over a cutoff power-law), the BAT team has decided to require a chi-square improvement of more than 6 for each extra dof.
Time averaged spectrum fit using the average DRM
Power-law model
Time interval is from   -5.976 sec. to   11.352 sec.

Spectral model in power-law:
------------------------------------------------------------
Parameters  : value       lower 90%   higher 90%
Photon index: -1.41325     ( -0.185768   0.186704 )
Norm@50keV  : 6.23186E-03    ( -0.000645462   0.00064323 )
------------------------------------------------------------
#Fit statistic  : Chi-Squared                   66.11     using 59 bins.
 Reduced chi-squared = 1.15982
# Null hypothesis probability of 1.91e-01 with 57 degrees of freedom

Photon flux (15-150 keV)    in 17.33 sec: 0.761253 ( -0.081518  0.081815 ) ph/cm2/s
Energy fluence (15-150 keV)             : 1.0409e-06 ( -1.17799e-07  1.18435e-07 ) ergs/cm2
Cutoff power-law model

Time interval is from   -5.976 sec. to   11.352 sec.
Spectral model in the cutoff power-law:
------------------------------------------------------------
Parameters  : value       lower 90%   higher 90%
Photon index: -1.40773     ( -0.189003   0.185664 )
Epeak [keV] : 9999.09      ( -9999.36 -9999.36 )
Norm@50keV  : 6.25468E-03    ( -0.00625435   0.00330818 )
------------------------------------------------------------
#Fit statistic  : Chi-Squared                   66.13     using 59 bins.
 Reduced chi-squared = 1.18089
# Null hypothesis probability of 1.67e-01 with 56 degrees of freedom

Photon flux (15-150 keV)    in 17.33 sec: 0.766006 ( -0.116122  0.106623 ) ph/cm2/s
Energy fluence (15-150 keV)             : 1.04623e-06 ( -1.62688e-07  1.52655e-07 ) ergs/cm2
1-s peak spectrum fit
Power-law model
Time interval is from   -0.292 sec. to    0.708 sec.

Spectral model in power-law:
------------------------------------------------------------
Parameters  : value       lower 90%   higher 90%
Photon index: -1.50681     ( -0.258534   0.25477 )
Norm@50keV  : 2.01453E-02    ( -0.00317887   0.00315567 )
------------------------------------------------------------
#Fit statistic  : Chi-Squared                   47.96     using 59 bins.
 Reduced chi-squared = 0.841404
# Null hypothesis probability of 7.98e-01 with 57 degrees of freedom

Photon flux (15-150 keV)    in 1 sec: 2.51962 ( -0.39594  0.3965 ) ph/cm2/s
Energy fluence (15-150 keV)             : 1.90924e-07 ( -3.24128e-08  3.26596e-08 ) ergs/cm2
Cutoff power-law model
Time interval is from   -0.292 sec. to    0.708 sec.
Spectral model in the cutoff power-law:
------------------------------------------------------------
Parameters  : value       lower 90%   higher 90%
Photon index: -1.1956     ( -0.552802   1.11673 )
Epeak [keV] : 131.899      ( -131.899 -131.899 )
Norm@50keV  : 2.89601E-02    ( -0.0289601   0.0730205 )
------------------------------------------------------------
#Fit statistic  : Chi-Squared                   47.65     using 59 bins.
 Reduced chi-squared = 0.850893
# Null hypothesis probability of 7.79e-01 with 56 degrees of freedom

Photon flux (15-150 keV)    in 1 sec: 2.49858 ( -0.40289  0.4018 ) ph/cm2/s
Energy fluence (15-150 keV)             : 1.88005e-07 ( -3.39733e-08  3.38402e-08 ) ergs/cm2
Time-resolved spectra
Distribution
T90 vs. Hardness ratio plot
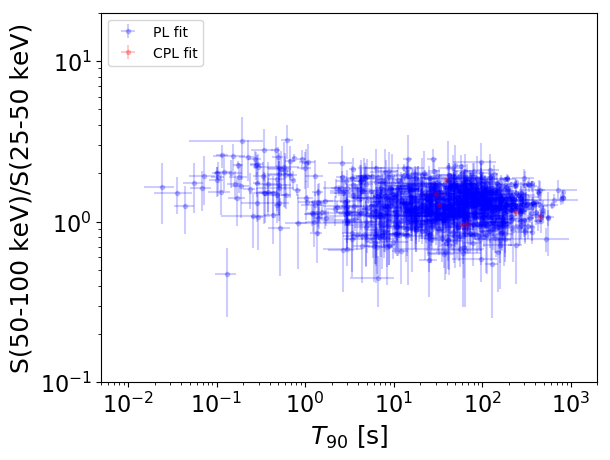
T90                                   = N/A sec.
Hardness ratio (energy fluence ratio) = N/A
S(15-50 keV) vs. S(50-150 keV) plot
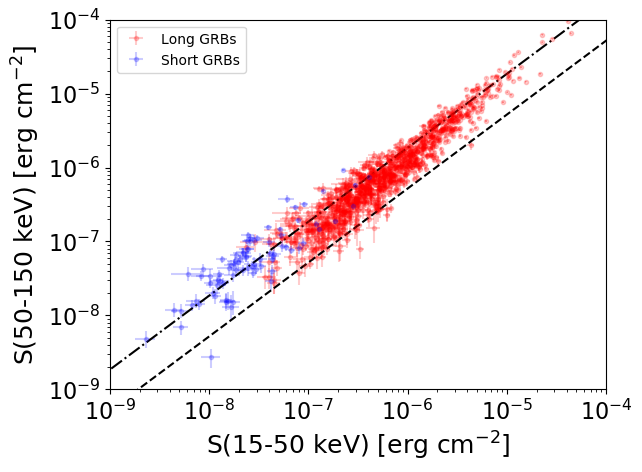
S(15-50 keV)  = N/A
S(50-150 keV) = N/A
The dash-dotted line and the dashed line traces the fluences calculated from the Band function with Epeak = 15 and 150 keV, respectively. Both lines assume a canonical values of alpha = -1 and beta = -2.5.
Mask shadow pattern
IMX = 4.692482888128566E-01, IMY = -5.470022311397643E-01
Spacecraft aspect plot
Bright source in the pre-burst/pre-slew/post-slew images
Pre-burst image of 15-350 keV band
Time interval of the image:
-239.560000 -5.976000

# RAcent  DECcent POSerr Theta    Phi  PeakCts   SNR AngSep     Name
#  [deg]    [deg]    ['] [deg]  [deg]                   [']
135.4859 -40.5616    4.8  52.3 -162.7   1.5077   2.4    2.0	Vela X-1
165.2079  37.3644    4.7  37.0  -23.9   0.7658   2.5 ------	UNKNOWN
162.5793  32.1826    2.8  32.4  -29.6   1.1541   4.2 ------	UNKNOWN
140.6376  43.5508    2.9  50.6  -44.6   4.0582   4.0 ------	UNKNOWN
123.1315 -25.1463    2.5  52.9 -139.3   5.4244   4.6 ------	UNKNOWN
Pre-slew background subtracted image of 15-350 keV band
Time interval of the image:
-5.976000 11.352000

# RAcent  DECcent POSerr Theta    Phi  PeakCts   SNR AngSep     Name
#  [deg]    [deg]    ['] [deg]  [deg]                   [']
135.5831 -40.5569   34.9  52.3 -162.7  -0.0420  -0.3    2.5	Vela X-1
204.2840  14.4757    0.8  35.8   49.4   1.5432  14.2 ------	UNKNOWN
166.9932 -46.2050    2.3  47.1  167.2   0.6484   5.0 ------	UNKNOWN
182.6464  35.0359    2.4  36.0    0.1   0.3179   4.8 ------	UNKNOWN
161.3248 -29.0210    2.3  31.1  179.8   0.2847   4.9 ------	UNKNOWN
133.2568  21.2531    2.2  42.0  -74.6   0.9500   5.4 ------	UNKNOWN
Post-slew image of 15-350 keV band
Time interval of the image:
73.740590 890.840600

# RAcent  DECcent POSerr Theta    Phi  PeakCts   SNR AngSep     Name
#  [deg]    [deg]    ['] [deg]  [deg]                   [']
254.4399  35.3219   51.1  49.4   21.6  -0.4750  -0.2    1.5	Her X-1
254.8792  30.0931    2.9  48.9   28.5   9.3534   4.0 ------	UNKNOWN
179.3968 -26.1972    3.2  47.3  176.8   5.6758   3.6 ------	UNKNOWN
197.2968  31.8101    2.9  18.4  -53.1   2.6305   4.0 ------	UNKNOWN
156.2117   5.9855    2.3  48.0 -129.1  13.9383   5.0 ------	UNKNOWN
157.6578  12.1746    2.7  45.3 -121.1  10.9511   4.3 ------	UNKNOWN