Analysis Summary
Notes:
- 1) No attempt has been made to eliminate the non-significant decimal places.
- 2) This batgrbproduct analysis is done using the HEASARC data.
- 3) This batgrbproduct analysis is using the flight position for the mask-weighting calculation.
======================================================================
                  BAT GRB EVENT DATA PROCESSING REPORT
    Process Script Ver: batgrbproduct v2.48
    Process Start Time: Fri Jul 29 23:04:38 EDT 2022
             Host Name: batproc1
   Current Working Dir: /local/data/bat1/alien/Swift_3rdBATcatalog/event/batevent_reproc/trigger1054681
======================================================================

  Trigger: 01054681      Segment: 000

  BAT Trigger Time: 645047514.688   [s; MET]
      Trigger Stop: 645047515.712   [s; MET]
               UTC: 2021-06-10T19:51:27.514180    [includes UTCF correction]
       Where From?: TDRSS position message

  BAT
    RA: 243.938816073423   Dec: 14.3913470955268  [deg; J2000]

     Catalogged Source?: NO
     Point Source?:      YES
     GRB Indicated?:     YES    [ by BAT flight software ]
     Image S/N Ratio:    10.54
     Image Trigger?:     NO
     Rate S/N Ratio:     46.5295604965274  [ if not an image trigger ]
     Image S/N Ratio:    10.54

  Analysis Position:   [ source = BAT ]
    RA: 243.938816073423   Dec: 14.3913470955268  [deg; J2000]

  Refined Position:   [ source = BAT pre-slew burst ]
    RA: 243.928518473746   Dec: 14.3984723907893  [deg; J2000]
        { 16h 15m 42.8s , +14d 23' 54.5" }
         +/- 0.814370488769121 [arcmin] (estimated 90% radius based on SNR)
         +/- 0.397282721599225 [arcmin] (formal 1-sigma fit error)
    SNR: 40.7864103070031

  Angular difference between the analysis and refined position is 0.735475 arcmin

  Partial Coding Fraction: 0.2460938    [ including projection effects ]

  Duration
     T90: 69.3839999437332 +/- 2.53414757519244
        Measured from: -0.663999915122986
                   to: 68.7200000286102     [s; relative to TRIGTIME]
     T50: 25.4399999380112 +/- 0.622009678277772
        Measured from: 8.50400006771088
                   to: 33.944000005722     [s; relative to TRIGTIME]


  Fluence
     Peak Flux  (peak 1 second)
        Measured from: 7.94800007343292
                   to: 8.94800007343292     [s; relative to TRIGTIME]
     Total Fluence
        Measured from: -12.039999961853
                   to: 142.472000002861     [s; relative to TRIGTIME]

             Band 1     Band 2     Band 3     Band 4
              15-25      25-50     50-100    100-350     keV
 Total     9.296134  16.739654  17.316489   5.827818
           0.134215   0.158668   0.162283   0.124557 [error]
 Peak      0.237698   0.495221   0.701118   0.350177
           0.020299   0.027480   0.032357   0.026318 [error]

     [ fluence units of on-axis counts / fully illuminated detector ]

======================================================================


====== Table of the duration information =============================

        Value   tstart    tstop
T100  154.512  -12.040  142.472
T90    69.384   -0.664   68.720
T50    25.440    8.504   33.944
Peak    1.000    7.948    8.948


====== Spectral Analysis Summary =====================================

Model      : spectral model: simple power-law (PL) and cutoff power-law (CPL)
Ph_index   : photon index: E^{Ph_index}
Ph_90err   : 90% error of the photon index
Epeak      : Epeak in keV
Epeak_90err: 90% error of Epeak
Norm       : normalization at 50 keV in both the PL model and CPL model
Nomr_90err : 90% error of the normalization
chi2       : Chi-Squared
dof        : degree of freedo

=== Time-averaged spectral analysis ===
(Best model with acceptable fit: N/A)

Model Ph_index Ph_90err_low Ph_90err_hi  Epeak  Epeak_90err_low  Epeak_90err_hi  Norm       Nomr_90err_low    Norm_90err_hi    chi2    dof
PL      -1.131    -0.027      0.027       -           -               -         2.26e-02     -3.51e-04          3.50e-04      32.220   57
CPL     -0.977    -0.106      0.112      428.312    -151.282       901.738      2.60e-02     -1.28e-03          2.69e-03      26.490   56


=== 1-s peak spectral analysis ===
(Best model with acceptable fit: N/A)

Model Ph_index Ph_90err_low Ph_90err_hi  Epeak  Epeak_90err_low  Epeak_90err_hi  Norm       Nomr_90err_low    Norm_90err_hi    chi2    dof
PL      -0.665     -0.094     0.096       -           -               -         1.16e-01     -6.55e-03          6.50e-03      70.060   57
CPL     -0.658     -0.093     0.098     9999.360    -9999.360      -9999.360      1.17e-01     -6.19e-03          4.10e-02      70.070   56


=== Fluence/Peak Flux Summary ===

              Model    Band1     Band2     Band3     Band4     Band5     Total
                       15-25     25-50    50-100    100-350    15-150    15-350    keV
Fluence         PL   3.16e-06  7.29e-06  1.33e-05  5.80e-05  3.62e-05  8.17e-05   erg/cm2
      90%_error_low -1.07e-07 -1.48e-07 -2.00e-07 -2.05e-06 -5.26e-07 -2.09e-06   erg/cm2
      90%_error_hi   1.09e-07  1.48e-07  1.99e-07  2.10e-06  5.25e-07  2.13e-06   erg/cm2
Peak flux       PL   1.08e-03  1.34e-02  1.52e-01  1.65e+01  6.92e-01  1.69e+01   ph/cm2/s
      90%_error_low -2.20e-05 -3.07e-04 -3.96e-03 -3.57e+00 -1.92e-02 -3.88e+00   ph/cm2/s
      90%_error_hi   1.07e-03  1.13e-02  1.05e-01  2.98e+00  4.30e-01  2.81e+00   ph/cm2/s

Fluence        CPL   3.00e-06  7.30e-06  1.36e-05  4.92e-05  3.61e-05  7.31e-05   erg/cm2
      90%_error_low -1.51e-07 -1.50e-07 -2.65e-07 -5.35e-06 -5.37e-07 -5.31e-06   erg/cm2
      90%_error_hi   1.54e-07  1.50e-07  2.66e-07  5.97e-06  5.37e-07  5.93e-06   erg/cm2
Peak flux      CPL   1.26e-04  3.10e-03  7.13e-02  1.85e+01  1.35e+01  1.85e+01   ph/cm2/s
      90%_error_low     N/A       N/A       N/A   -6.07e+00 -8.25e-01     N/A     ph/cm2/s
      90%_error_hi      N/A       N/A       N/A    1.30e+01  7.96e-01     N/A     ph/cm2/s

======================================================================
Image
Pre-slew 15.0-350.0 keV image (Event data)
#   RAcent    DECcent   POSerr    Theta     Phi              Peak Cts       SNR   Name
  243.9285    14.3985   0.0047    38.3319    43.0422        19.8607083     40.786 TRIG_01054681

Foreground time interval of the image:
-12.040  13.613 (delta_t =  25.653 [sec])
Background time interval of the image:
-239.688 -12.040 (delta_t = 227.648 [sec])
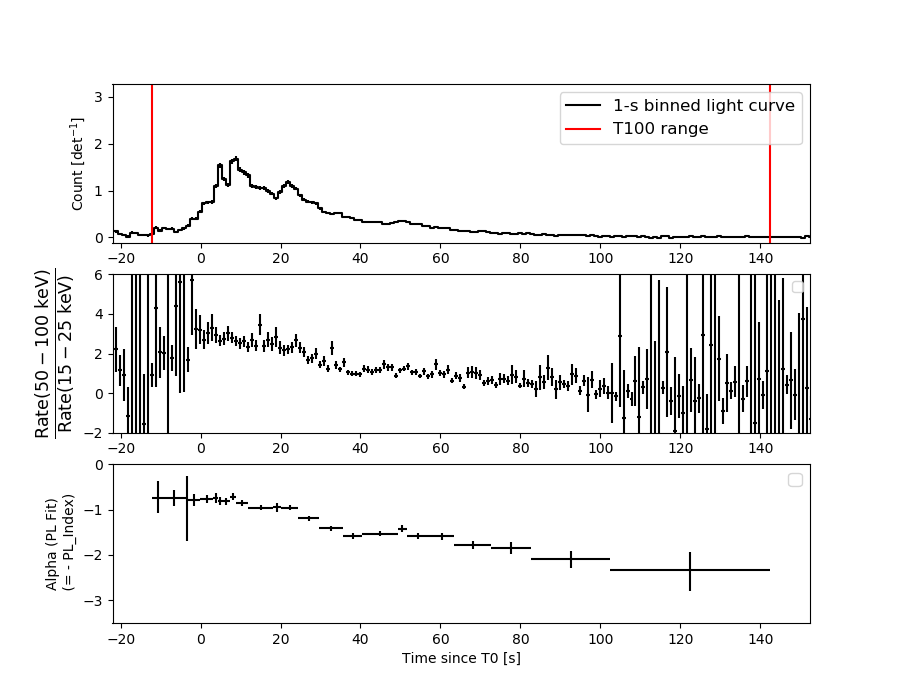
Light Curves
Note: The mask-weighted lightcurves have units of either count/det or counts/sec/det, where a det is 0.4 x 0.4 = 0.16 sq cm.
Full-time range; 1 s binning
Other quick-look light curves:
- 64 ms binning (zoomed)
- 16 ms binning (zoomed)
- 8 ms binning (zoomed)
- 2 ms binning (zoomed)
- SN=5 or 10 s binning (full-time range)
- Raw light curve
Spectra
- 64 ms binning (zoomed)
- 16 ms binning (zoomed)
- 8 ms binning (zoomed)
- 2 ms binning (zoomed)
- SN=5 or 10 s binning (full-time range)
- Raw light curve
Spectra
Notes:
- 1) The fitting includes the systematic errors.
- 2) When the burst includes telescope slew time periods, the fitting uses an average response file made from multiple 5-s response files through out the slew time plus single time preiod for the non-slew times, and weighted by the total counts in the corresponding time period using addrmf. An average response file is needed becuase a spectral fit using the pre-slew DRM will introduce some errors in both a spectral shape and a normalization if the PHA file contains a lot of the slew/post-slew time interval.
- 3) For fits to more complicated models (e.g. a power-law over a cutoff power-law), the BAT team has decided to require a chi-square improvement of more than 6 for each extra dof.
Time averaged spectrum fit using the average DRM
Power-law model
Time interval is from  -12.040 sec. to  142.472 sec.

Spectral model in power-law:
------------------------------------------------------------
Parameters  : value       lower 90%   higher 90%
Photon index: -1.13132     ( -0.0269844   0.0270876 )
Norm@50keV  : 2.26312E-02    ( -0.000350687   0.000349993 )
------------------------------------------------------------
#Fit statistic  : Chi-Squared                   32.22     using 59 bins.
 Reduced chi-squared = 0.565263
# Null hypothesis probability of 9.97e-01 with 57 degrees of freedom

Photon flux (15-150 keV)    in 154.5 sec: 2.63362 ( -0.04432  0.04442 ) ph/cm2/s
Energy fluence (15-150 keV)             : 3.62041e-05 ( -5.25484e-07  5.24809e-07 ) ergs/cm2
Cutoff power-law model
Time interval is from  -12.040 sec. to  142.472 sec.
Spectral model in the cutoff power-law:
------------------------------------------------------------
Parameters  : value       lower 90%   higher 90%
Photon index: -0.977445     ( -0.105688   0.11223 )
Epeak [keV] : 428.312      ( -151.283 901.742 )
Norm@50keV  : 2.59879E-02    ( -0.00127949   0.00268712 )
------------------------------------------------------------
#Fit statistic  : Chi-Squared                   26.49     using 59 bins.
 Reduced chi-squared = 0.473036
# Null hypothesis probability of 1.00e+00 with 56 degrees of freedom

Photon flux (15-150 keV)    in 154.5 sec: 2.60512 ( -0.04813  0.04836 ) ph/cm2/s
Energy fluence (15-150 keV)             : 3.60594e-05 ( -5.36467e-07  5.37037e-07 ) ergs/cm2
1-s peak spectrum fit
Power-law model
Time interval is from    7.948 sec. to    8.948 sec.

Spectral model in power-law:
------------------------------------------------------------
Parameters  : value       lower 90%   higher 90%
Photon index: -0.665326     ( -0.0936348   0.0955809 )
Norm@50keV  : 0.116409    ( -0.00654709   0.00649662 )
------------------------------------------------------------
#Fit statistic  : Chi-Squared                   70.06     using 59 bins.
 Reduced chi-squared = 1.22912
# Null hypothesis probability of 1.15e-01 with 57 degrees of freedom

Photon flux (15-150 keV)    in 1 sec: 0.692270 ( -0.019182  0.43008 ) ph/cm2/s
Energy fluence (15-150 keV)             : 1.44371e-06 ( -8.19518e-08  8.21335e-08 ) ergs/cm2
Cutoff power-law model

Time interval is from    7.948 sec. to    8.948 sec.
Spectral model in the cutoff power-law:
------------------------------------------------------------
Parameters  : value       lower 90%   higher 90%
Photon index: -0.658243     ( -0.0933276   0.097362 )
Epeak [keV] : 9999.36      ( -9999.36 -9999.36 )
Norm@50keV  : 0.117346    ( -0.00621124   0.0409666 )
------------------------------------------------------------
#Fit statistic  : Chi-Squared                   70.07     using 59 bins.
 Reduced chi-squared = 1.25125
# Null hypothesis probability of 9.78e-02 with 56 degrees of freedom

Photon flux (15-150 keV)    in 1 sec: 13.5069 ( -0.8248  0.7958 ) ph/cm2/s
Energy fluence (15-150 keV)             : 1.44451e-06 ( -9.54539e-08  6.21318e-08 ) ergs/cm2
Time-resolved spectra
Distribution
T90 vs. Hardness ratio plot
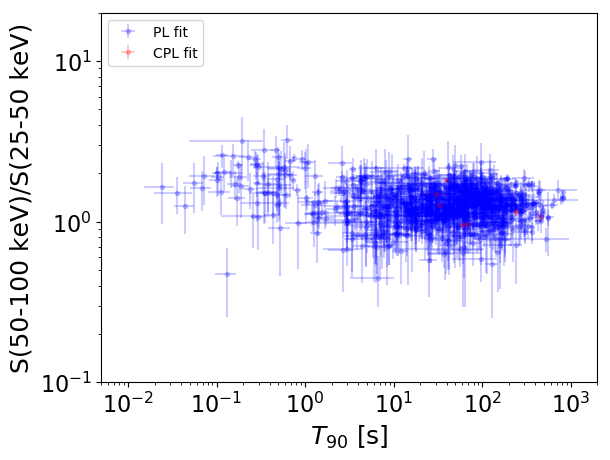
T90                                   = N/A sec.
Hardness ratio (energy fluence ratio) = N/A
S(15-50 keV) vs. S(50-150 keV) plot
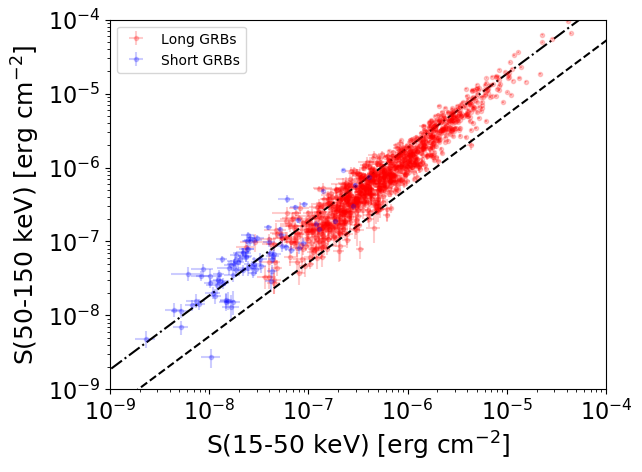
S(15-50 keV)  = N/A
S(50-150 keV) = N/A
The dash-dotted line and the dashed line traces the fluences calculated from the Band function with Epeak = 15 and 150 keV, respectively. Both lines assume a canonical values of alpha = -1 and beta = -2.5.
Mask shadow pattern
IMX = 5.778535244441950E-01, IMY = -5.396527728179455E-01
Spacecraft aspect plot
Bright source in the pre-burst/pre-slew/post-slew images
Pre-burst image of 15-350 keV band
Time interval of the image:
-239.688000 -12.040000

# RAcent  DECcent POSerr Theta    Phi  PeakCts   SNR AngSep     Name
#  [deg]    [deg]    ['] [deg]  [deg]                   [']
254.5696  35.5188    0.0  49.5   13.4   0.3378   0.6   11.9	Her X-1
230.5493  19.3091    2.3  25.6   33.5   1.3517   5.0 ------	UNKNOWN
251.7571  43.1883    2.8  49.6    2.9   2.0056   4.2 ------	UNKNOWN
Pre-slew background subtracted image of 15-350 keV band
Time interval of the image:
-12.040000 13.612600

# RAcent  DECcent POSerr Theta    Phi  PeakCts   SNR AngSep     Name
#  [deg]    [deg]    ['] [deg]  [deg]                   [']
254.5696  35.5188    0.0  49.5   13.4  -0.0423  -0.1   11.9	Her X-1
243.9285  14.3985    0.3  38.3   43.0  19.8619  40.8 ------	UNKNOWN
203.2302 -12.0390    3.0  26.5  140.4   0.8588   3.9 ------	UNKNOWN
178.7643  53.0800    3.5  43.5  -64.0   1.7285   3.4 ------	UNKNOWN
158.1695  20.0544    2.5  44.3 -117.9   2.2277   4.6 ------	UNKNOWN
Post-slew image of 15-350 keV band
Time interval of the image:
73.012600 720.022000
720.312000 962.370100

# RAcent  DECcent POSerr Theta    Phi  PeakCts   SNR AngSep     Name
#  [deg]    [deg]    ['] [deg]  [deg]                   [']
244.9959 -15.6382    0.6  30.1  110.2  25.0915  20.1    1.0	Sco X-1
254.3252  35.2185    8.4  22.8  -45.4  -1.1856  -1.4    9.9	Her X-1
268.5353  -1.5375    0.0  29.1   53.4  -1.8837  -1.5   11.3	SW J1753.5-0127
274.1072 -13.9388    3.9  41.2   64.4   7.5718   3.0    8.3	GX 17+2
288.7695  10.8892   12.6  43.8   21.4   1.2665   0.9    3.8	GRS 1915+105
299.6203  35.2066    1.6  53.9  -11.1  15.0327   7.1    1.5	Cyg X-1
281.8400  44.5264    3.0  44.0  -28.7   5.4389   3.8 ------	UNKNOWN
217.5038  37.0600    5.4  32.6 -108.9   3.0868   2.1 ------	UNKNOWN
194.6708  30.7475    3.1  47.9 -129.1  13.7120   3.8 ------	UNKNOWN