Analysis Summary
Notes:
- 1) No attempt has been made to eliminate the non-significant decimal places.
- 2) This batgrbproduct analysis is done using the HEASARC data.
- 3) This batgrbproduct analysis is using the flight position for the mask-weighting calculation.
======================================================================
BAT GRB EVENT DATA PROCESSING REPORT
Process Script Ver: batgrbproduct v2.48
Process Start Time: Fri Jul 29 23:03:09 EDT 2022
Host Name: batproc1
Current Working Dir: /local/data/bat1/alien/Swift_3rdBATcatalog/event/batevent_reproc/trigger1056426
======================================================================
Trigger: 01056426 Segment: 000
BAT Trigger Time: 645673444.224 [s; MET]
Trigger Stop: 645673444.736 [s; MET]
UTC: 2021-06-18T01:43:37.008340 [includes UTCF correction]
Where From?: TDRSS position message
BAT
RA: 235.820334978217 Dec: 46.0433632334042 [deg; J2000]
Catalogged Source?: NO
Point Source?: YES
GRB Indicated?: YES [ by BAT flight software ]
Image S/N Ratio: 7.01
Image Trigger?: NO
Rate S/N Ratio: 12.369316876853 [ if not an image trigger ]
Image S/N Ratio: 7.01
Analysis Position: [ source = BAT ]
RA: 235.820334978217 Dec: 46.0433632334042 [deg; J2000]
Refined Position: [ source = BAT pre-slew burst ]
RA: 235.76357055125 Dec: 46.0686421956418 [deg; J2000]
{ 15h 43m 03.3s , +46d 04' 07.1" }
+/- 2.01107368901802 [arcmin] (estimated 90% radius based on SNR)
+/- 0.936196155566632 [arcmin] (formal 1-sigma fit error)
SNR: 11.2111414279785
Angular difference between the analysis and refined position is 2.808328 arcmin
Partial Coding Fraction: 1.015625 [ including projection effects ]
Duration
T90: 2.13199996948242 +/- 0.438488315161259
Measured from: -1.3639999628067
to: 0.76800000667572 [s; relative to TRIGTIME]
T50: 1.25599992275238 +/- 0.515503641776127
Measured from: -0.916000008583069
to: 0.339999914169312 [s; relative to TRIGTIME]
Fluence
Peak Flux (peak 1 second)
Measured from: -0.495999932289124
to: 0.504000067710876 [s; relative to TRIGTIME]
Total Fluence
Measured from: -1.41999995708466
to: 0.927999973297119 [s; relative to TRIGTIME]
Band 1 Band 2 Band 3 Band 4
15-25 25-50 50-100 100-350 keV
Total 0.059160 0.100822 0.072310 0.034526
0.011647 0.012911 0.013016 0.014175 [error]
Peak 0.035203 0.055008 0.045402 0.014324
0.007656 0.008703 0.008684 0.009359 [error]
[ fluence units of on-axis counts / fully illuminated detector ]
======================================================================
====== Table of the duration information =============================
Value tstart tstop
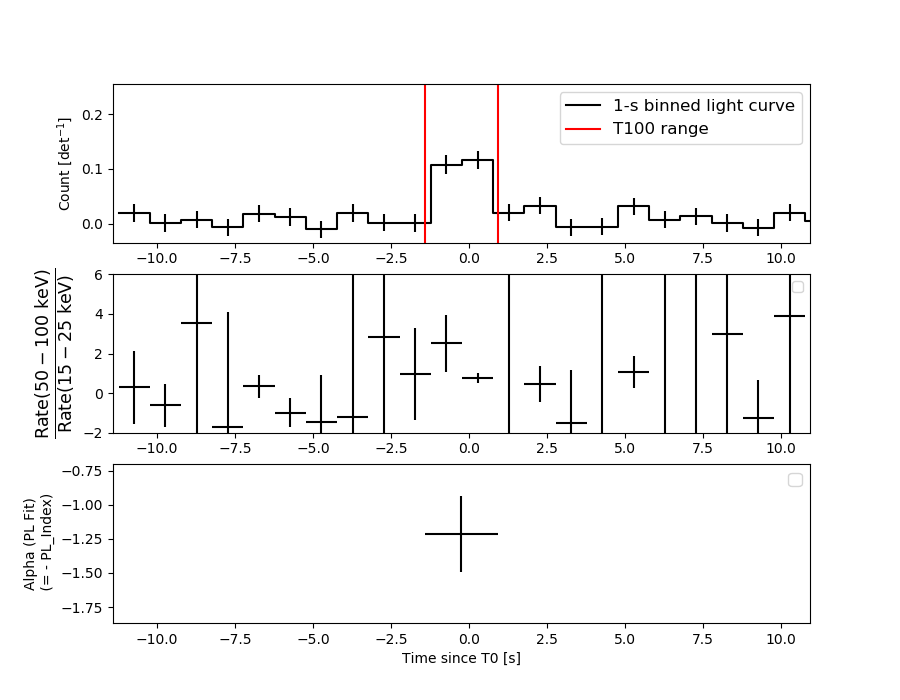
T100 2.348 -1.420 0.928
T90 2.132 -1.364 0.768
T50 1.256 -0.916 0.340
Peak 1.000 -0.496 0.504
====== Spectral Analysis Summary =====================================
Model : spectral model: simple power-law (PL) and cutoff power-law (CPL)
Ph_index : photon index: E^{Ph_index}
Ph_90err : 90% error of the photon index
Epeak : Epeak in keV
Epeak_90err: 90% error of Epeak
Norm : normalization at 50 keV in both the PL model and CPL model
Nomr_90err : 90% error of the normalization
chi2 : Chi-Squared
dof : degree of freedo
=== Time-averaged spectral analysis ===
(Best model with acceptable fit: N/A)
Model Ph_index Ph_90err_low Ph_90err_hi Epeak Epeak_90err_low Epeak_90err_hi Norm Nomr_90err_low Norm_90err_hi chi2 dof
PL -1.216 -0.277 0.278 - - - 7.27e-03 -1.11e-03 1.10e-03 58.670 57
CPL -1.193 -2.586 0.890 9980.860 -9980.860 -9980.860 7.49e-03 -1.30e-03 1.37e-02 58.750 56
=== 1-s peak spectral analysis ===
(Best model with acceptable fit: N/A)
Model Ph_index Ph_90err_low Ph_90err_hi Epeak Epeak_90err_low Epeak_90err_hi Norm Nomr_90err_low Norm_90err_hi chi2 dof
PL -1.136 -0.327 0.334 - - - 9.66e-03 -1.72e-03 1.71e-03 89.460 57
CPL -1.140 -0.321 0.344 9999.360 -9999.360 -9999.360 9.68e-03 -1.67e-03 1.55e-02 89.470 56
=== Fluence/Peak Flux Summary ===
Model Band1 Band2 Band3 Band4 Band5 Total
15-25 25-50 50-100 100-350 15-150 15-350 keV
Fluence PL 1.67e-08 3.66e-08 6.30e-08 2.51e-07 1.72e-07 3.67e-07 erg/cm2
90%_error_low -4.27e-09 -5.73e-09 -1.28e-08 -9.60e-08 -3.14e-08 -1.07e-07 erg/cm2
90%_error_hi 4.53e-09 5.65e-09 1.27e-08 1.34e-07 3.24e-08 1.41e-07 erg/cm2
Peak flux PL 2.81e-01 3.51e-01 3.20e-01 5.06e-01 1.13e+00 1.46e+00 ph/cm2/s
90%_error_low -8.83e-02 -6.92e-02 -7.22e-02 -2.07e-01 -1.96e-01 -2.91e-01 ph/cm2/s
90%_error_hi 9.56e-02 6.73e-02 7.09e-02 2.94e-01 1.96e-01 3.20e-01 ph/cm2/s
Fluence CPL 1.67e-08 3.62e-08 6.27e-08 2.66e-07 1.76e-07 3.70e-07 erg/cm2
90%_error_low N/A -5.76e-09 N/A -2.11e-07 -4.00e-08 -2.02e-07 erg/cm2
90%_error_hi N/A 6.70e-09 N/A 4.96e-08 1.76e-08 6.04e-08 erg/cm2
Peak flux CPL 2.87e-01 3.51e-01 3.18e-01 5.10e-01 1.13e+00 1.46e+00 ph/cm2/s
90%_error_low -9.66e-02 -6.91e-02 -7.08e-02 N/A -2.26e-01 -4.02e-01 ph/cm2/s
90%_error_hi 9.05e-02 6.79e-02 7.37e-02 N/A 2.09e-01 2.90e-01 ph/cm2/s
======================================================================
Image
Pre-slew 15.0-350.0 keV image (Event data)
#   RAcent    DECcent   POSerr    Theta     Phi              Peak Cts       SNR   Name
  235.7636    46.0686   0.0172    13.1367  -156.5186         0.3045533     11.211 TRIG_01056426

Foreground time interval of the image:
 -1.420   0.928 (delta_t =   2.348 [sec])
Background time interval of the image:
-119.224  -1.420 (delta_t = 117.804 [sec])
Light Curves
Note: The mask-weighted lightcurves have units of either count/det or counts/sec/det, where a det is 0.4 x 0.4 = 0.16 sq cm.
Full-time range; 1 s binning
Other quick-look light curves:
- 64 ms binning (zoomed)
- 16 ms binning (zoomed)
- 8 ms binning (zoomed)
- 2 ms binning (zoomed)
- SN=5 or 10 s binning (full-time range)
- Raw light curve
Spectra
- 64 ms binning (zoomed)
- 16 ms binning (zoomed)
- 8 ms binning (zoomed)
- 2 ms binning (zoomed)
- SN=5 or 10 s binning (full-time range)
- Raw light curve
Spectra
Notes:
- 1) The fitting includes the systematic errors.
- 2) When the burst includes telescope slew time periods, the fitting uses an average response file made from multiple 5-s response files through out the slew time plus single time preiod for the non-slew times, and weighted by the total counts in the corresponding time period using addrmf. An average response file is needed becuase a spectral fit using the pre-slew DRM will introduce some errors in both a spectral shape and a normalization if the PHA file contains a lot of the slew/post-slew time interval.
- 3) For fits to more complicated models (e.g. a power-law over a cutoff power-law), the BAT team has decided to require a chi-square improvement of more than 6 for each extra dof.
Time averaged spectrum fit using the average DRM
Power-law model
Time interval is from   -1.420 sec. to    0.928 sec.

Spectral model in power-law:
------------------------------------------------------------
Parameters  : value       lower 90%   higher 90%
Photon index: -1.21642     ( -0.277341   0.277633 )
Norm@50keV  : 7.27312E-03    ( -0.0011086   0.00109778 )
------------------------------------------------------------
#Fit statistic  : Chi-Squared                   58.67     using 59 bins.
 Reduced chi-squared = 1.0293
# Null hypothesis probability of 4.14e-01 with 57 degrees of freedom

Photon flux (15-150 keV)    in 2.348 sec: 0.855746 ( -0.125859  0.125866 ) ph/cm2/s
Energy fluence (15-150 keV)             : 1.72484e-07 ( -3.13639e-08  3.23533e-08 ) ergs/cm2
Cutoff power-law model
Time interval is from   -1.420 sec. to    0.928 sec.
Spectral model in the cutoff power-law:
------------------------------------------------------------
Parameters  : value       lower 90%   higher 90%
Photon index: -1.19306     ( -2.57022   0.905237 )
Epeak [keV] : 9980.86      ( -9999.34 -9999.34 )
Norm@50keV  : 7.48632E-03    ( -0.00111629   0.0138709 )
------------------------------------------------------------
#Fit statistic  : Chi-Squared                   58.75     using 59 bins.
 Reduced chi-squared = 1.04911
# Null hypothesis probability of 3.75e-01 with 56 degrees of freedom

Photon flux (15-150 keV)    in 2.348 sec: 0.862351 ( -0.160819  0.146439 ) ph/cm2/s
Energy fluence (15-150 keV)             : 1.75723e-07 ( -3.99857e-08  1.75801e-08 ) ergs/cm2
1-s peak spectrum fit
Power-law model

Time interval is from   -0.496 sec. to    0.504 sec.

Spectral model in power-law:
------------------------------------------------------------
Parameters  : value       lower 90%   higher 90%
Photon index: -1.13629     ( -0.327105   0.334275 )
Norm@50keV  : 9.66315E-03    ( -0.00171649   0.00170542 )
------------------------------------------------------------
#Fit statistic  : Chi-Squared                   89.46     using 59 bins.
 Reduced chi-squared = 1.56947
# Null hypothesis probability of 3.89e-03 with 57 degrees of freedom

Photon flux (15-150 keV)    in 1 sec: 1.12513 ( -0.196245  0.19627 ) ph/cm2/s
Energy fluence (15-150 keV)             : 9.9901e-08 ( -2.12942e-08  2.20092e-08 ) ergs/cm2
Cutoff power-law model
Time interval is from   -0.496 sec. to    0.504 sec.
Spectral model in the cutoff power-law:
------------------------------------------------------------
Parameters  : value       lower 90%   higher 90%
Photon index: -1.13986     ( -0.321894   0.343868 )
Epeak [keV] : 9999.36      ( -9999.36 -9999.36 )
Norm@50keV  : 9.67663E-03    ( -0.00170019   0.0154577 )
------------------------------------------------------------
#Fit statistic  : Chi-Squared                   89.47     using 59 bins.
 Reduced chi-squared = 1.59768
# Null hypothesis probability of 2.98e-03 with 56 degrees of freedom

Photon flux (15-150 keV)    in 1 sec: 1.13193 ( -0.22569  0.20852 ) ph/cm2/s
Energy fluence (15-150 keV)             : 2.43596e-08 ( -1.76194e-08  8.47109e-09 ) ergs/cm2
Time-resolved spectra
Distribution
T90 vs. Hardness ratio plot
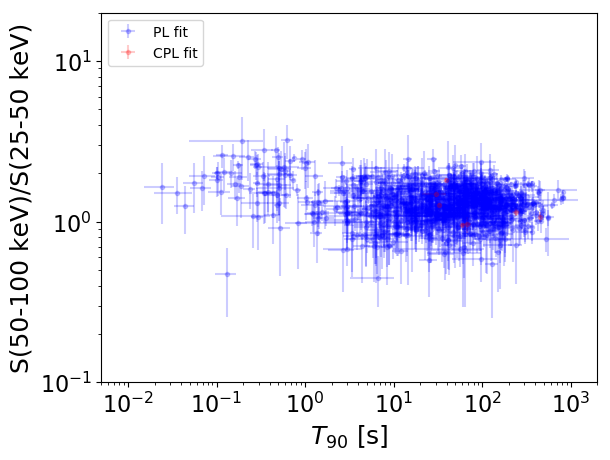
T90                                   = N/A sec.
Hardness ratio (energy fluence ratio) = N/A
S(15-50 keV) vs. S(50-150 keV) plot
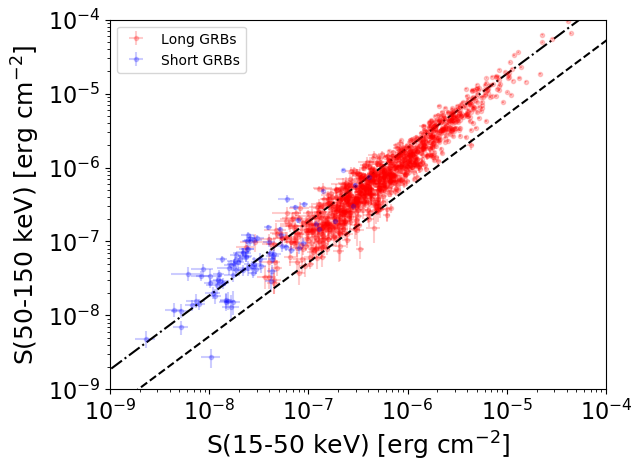
S(15-50 keV)  = N/A
S(50-150 keV) = N/A
The dash-dotted line and the dashed line traces the fluences calculated from the Band function with Epeak = 15 and 150 keV, respectively. Both lines assume a canonical values of alpha = -1 and beta = -2.5.
Mask shadow pattern
IMX = -2.140563135164859E-01, IMY = 9.299182024394913E-02
Spacecraft aspect plot
Bright source in the pre-burst/pre-slew/post-slew images
Pre-burst image of 15-350 keV band
Time interval of the image:
-119.224000 -1.420000

# RAcent  DECcent POSerr Theta    Phi  PeakCts   SNR AngSep     Name
#  [deg]    [deg]    ['] [deg]  [deg]                   [']
254.4493  35.3399   77.7   9.7  102.4   0.0461   0.1    0.4	Her X-1
288.6581  10.8009   40.3  45.0   50.9  -0.2916  -0.3   12.0	GRS 1915+105
299.5846  35.1188    1.7  35.4   12.3   2.9838   6.7    5.0	Cyg X-1
308.3552  40.9913    0.0  38.9   -1.6   0.6659   1.5   11.3	Cyg X-3
326.3185  38.3400   12.4  52.3   -7.5  -0.7147  -0.9    7.0	Cyg X-2
241.1548   9.0906    3.1  37.7  124.0   2.9305   3.8 ------	UNKNOWN
318.9088  23.8788    3.7  55.6   11.7   5.4290   3.1 ------	UNKNOWN
294.6457  35.7818    2.9  31.6   14.9   1.4473   4.0 ------	UNKNOWN
215.2193  28.1630    2.6  35.3  177.2   1.7232   4.4 ------	UNKNOWN
195.4721  14.3918    3.3  58.1 -179.9   7.5448   3.6 ------	UNKNOWN
187.1990  23.8385    3.1  57.6 -165.4   4.9256   3.7 ------	UNKNOWN
320.7240  57.9156    2.4  41.4  -30.5   2.3735   4.8 ------	UNKNOWN
Pre-slew background subtracted image of 15-350 keV band
Time interval of the image:
-1.420000 0.928000

# RAcent  DECcent POSerr Theta    Phi  PeakCts   SNR AngSep     Name
#  [deg]    [deg]    ['] [deg]  [deg]                   [']
254.2405  35.4579    0.0   9.5  103.4  -0.0189  -0.7   12.7	Her X-1
288.8558  10.8641    6.7  45.0   50.6   0.2047   1.7    5.9	GRS 1915+105
299.5658  35.2697    4.9  35.3   12.1   0.0922   2.3    4.3	Cyg X-1
308.0301  41.1132    4.5  38.6   -1.6  -0.1058  -2.6   10.3	Cyg X-3
326.2174  38.4165    4.0  52.2   -7.5   0.1975   2.9    6.1	Cyg X-2
235.7636  46.0686    1.0  13.1 -156.5   0.3045  11.2 ------	UNKNOWN
Post-slew image of 15-350 keV band
Time interval of the image:
49.276600 258.876610

# RAcent  DECcent POSerr Theta    Phi  PeakCts   SNR AngSep     Name
#  [deg]    [deg]    ['] [deg]  [deg]                   [']
254.5142  35.2525   12.3  17.7   60.3  -0.3420  -0.9    6.1	Her X-1
299.5765  35.1840    1.2  48.3   18.7   7.8622   9.7    1.3	Cyg X-1
308.1805  41.0355   19.5  50.8    7.4  -0.5093  -0.6    5.9	Cyg X-3
189.6407  28.9797    2.6  39.7 -159.5   2.2190   4.6 ------	UNKNOWN
178.7160  13.5939    3.6  57.6 -165.4   5.5054   3.2 ------	UNKNOWN
341.9789  61.1422    2.9  57.5  -27.2   7.4520   3.9 ------	UNKNOWN