Analysis Summary
Notes:
- 1) No attempt has been made to eliminate the non-significant decimal places.
- 2) This batgrbproduct analysis is done using the HEASARC data.
- 3) This batgrbproduct analysis is using the flight position for the mask-weighting calculation.
======================================================================
                  BAT GRB EVENT DATA PROCESSING REPORT
    Process Script Ver: batgrbproduct v2.48
    Process Start Time: Fri Jul 29 23:01:16 EDT 2022
             Host Name: batproc1
   Current Working Dir: /local/data/bat1/alien/Swift_3rdBATcatalog/event/batevent_reproc/trigger1056757
======================================================================

  Trigger: 01056757      Segment: 000

  BAT Trigger Time: 645839992.896   [s; MET]
      Trigger Stop: 645839992.96   [s; MET]
               UTC: 2021-06-19T23:59:25.669220    [includes UTCF correction]
       Where From?: (*SHORT BURST*) TDRSS scaled map message

  BAT
    RA: 319.712963521213   Dec: 33.8598882356361  [deg; J2000]

     Catalogged Source?: NO
     Point Source?:      YES
     GRB Indicated?:     YES    [ by BAT flight software ]
     Image S/N Ratio:    8.13
     Image Trigger?:     NO
     Rate S/N Ratio:     67.0223843204642  [ if not an image trigger ]
     Image S/N Ratio:    8.13

  Analysis Position:   [ source = BAT ]
    RA: 319.712963521213   Dec: 33.8598882356361  [deg; J2000]

  Refined Position:   [ source = BAT pre-slew burst ]
    RA: 319.717897042299   Dec: 33.8496948883427  [deg; J2000]
        { 21h 18m 52.3s , +33d 50' 58.9" }
         +/- 0.688200917310961 [arcmin] (estimated 90% radius based on SNR)
         +/- 0.171398549015523 [arcmin] (formal 1-sigma fit error)
    SNR: 51.8744781958997

  Angular difference between the analysis and refined position is 0.659154 arcmin

  Partial Coding Fraction: 0.3671875    [ including projection effects ]

  Duration
     T90: 60.9119999408722 +/- 0.273437333691359
        Measured from: 0.748000025749207
                   to: 61.6599999666214     [s; relative to TRIGTIME]
     T50: 44.743999838829 +/- 0.0913892746406732
        Measured from: 2.86800003051758
                   to: 47.6119998693466     [s; relative to TRIGTIME]


  Fluence
     Peak Flux  (peak 1 second)
        Measured from: 0.952000021934509
                   to: 1.95200002193451     [s; relative to TRIGTIME]
     Total Fluence
        Measured from: -0.248000025749207
                   to: 108.027999997139     [s; relative to TRIGTIME]

             Band 1     Band 2     Band 3     Band 4
              15-25      25-50     50-100    100-350     keV
 Total    32.453149  49.655606  43.359926  12.796806
           0.177534   0.211954   0.206673   0.156737 [error]
 Peak      2.220616   4.572264   5.385109   2.031736
           0.044354   0.062165   0.070497   0.054060 [error]

     [ fluence units of on-axis counts / fully illuminated detector ]

======================================================================


====== Table of the duration information =============================

        Value   tstart    tstop
T100  108.276   -0.248  108.028
T90    60.912    0.748   61.660
T50    44.744    2.868   47.612
Peak    1.000    0.952    1.952


====== Spectral Analysis Summary =====================================

Model      : spectral model: simple power-law (PL) and cutoff power-law (CPL)
Ph_index   : photon index: E^{Ph_index}
Ph_90err   : 90% error of the photon index
Epeak      : Epeak in keV
Epeak_90err: 90% error of Epeak
Norm       : normalization at 50 keV in both the PL model and CPL model
Nomr_90err : 90% error of the normalization
chi2       : Chi-Squared
dof        : degree of freedo

=== Time-averaged spectral analysis ===
(Best model with acceptable fit: N/A)

Model Ph_index Ph_90err_low Ph_90err_hi  Epeak  Epeak_90err_low  Epeak_90err_hi  Norm       Nomr_90err_low    Norm_90err_hi    chi2    dof
PL      -1.404    -0.021      0.021       -           -               -         9.07e-02     -1.15e-03          1.14e-03      48.970   57
CPL     -1.250    -0.086      0.087      327.218     -92.980       309.678      1.04e-01     -7.26e-03          7.90e-03      39.660   56


=== 1-s peak spectral analysis ===
(Best model with acceptable fit: N/A)

Model Ph_index Ph_90err_low Ph_90err_hi  Epeak  Epeak_90err_low  Epeak_90err_hi  Norm       Nomr_90err_low    Norm_90err_hi    chi2    dof
PL      -0.957     -0.032     0.032       -           -               -         1.00e+00     -1.85e-02          1.85e-02      64.150   57
CPL     -0.662     -0.132     0.135      286.165     -69.382       170.703      1.32e+00     -1.48e-01          1.71e-01      49.080   56


=== Fluence/Peak Flux Summary ===

              Model    Band1     Band2     Band3     Band4     Band5     Total
                       15-25     25-50    50-100    100-350    15-150    15-350    keV
Fluence         PL   1.15e-05  2.23e-05  3.38e-05  1.11e-04  9.49e-05  1.78e-04   erg/cm2
      90%_error_low -3.16e-07 -3.77e-07 -3.80e-07 -2.83e-06 -1.07e-06 -2.84e-06   erg/cm2
      90%_error_hi   3.21e-07  3.77e-07  3.80e-07  2.87e-06  1.07e-06  2.87e-06   erg/cm2
Peak flux       PL   2.46e+01  3.42e+01  3.53e+01  6.65e+01  1.15e+02  1.61e+02   ph/cm2/s
      90%_error_low -9.76e-01 -8.33e-01 -6.42e-01 -2.63e+00 -2.17e+00 -3.01e+00   ph/cm2/s
      90%_error_hi   9.93e-01  8.32e-01  6.41e-01  2.69e+00  2.17e+00  3.02e+00   ph/cm2/s

Fluence        CPL   1.08e-05  2.23e-05  3.45e-05  9.64e-05  9.45e-05  1.64e-04   erg/cm2
      90%_error_low -4.55e-07 -3.84e-07 -5.26e-07 -7.18e-06 -1.09e-06 -7.21e-06   erg/cm2
      90%_error_hi   4.64e-07  3.83e-07  5.27e-07  7.91e-06  1.09e-06  7.92e-06   erg/cm2
Peak flux      CPL   2.23e+01  3.43e+01  3.67e+01  5.18e+01  1.14e+02  1.45e+02   ph/cm2/s
      90%_error_low -1.33e+00 -8.59e-01 -8.77e-01 -5.28e+00 -2.26e+00 -5.88e+00   ph/cm2/s
      90%_error_hi   1.36e+00  8.58e-01  8.81e-01  6.05e+00  2.26e+00  6.54e+00   ph/cm2/s

======================================================================
Image
Pre-slew 15.0-350.0 keV image (Event data)
#   RAcent    DECcent   POSerr    Theta     Phi              Peak Cts       SNR   Name
  319.7179    33.8497   0.0037    35.8712   -58.5337        57.3937193     51.874 TRIG_01056757

Foreground time interval of the image:
 -0.248   9.005 (delta_t =   9.253 [sec])
Background time interval of the image:
-239.896  -0.248 (delta_t = 239.648 [sec])
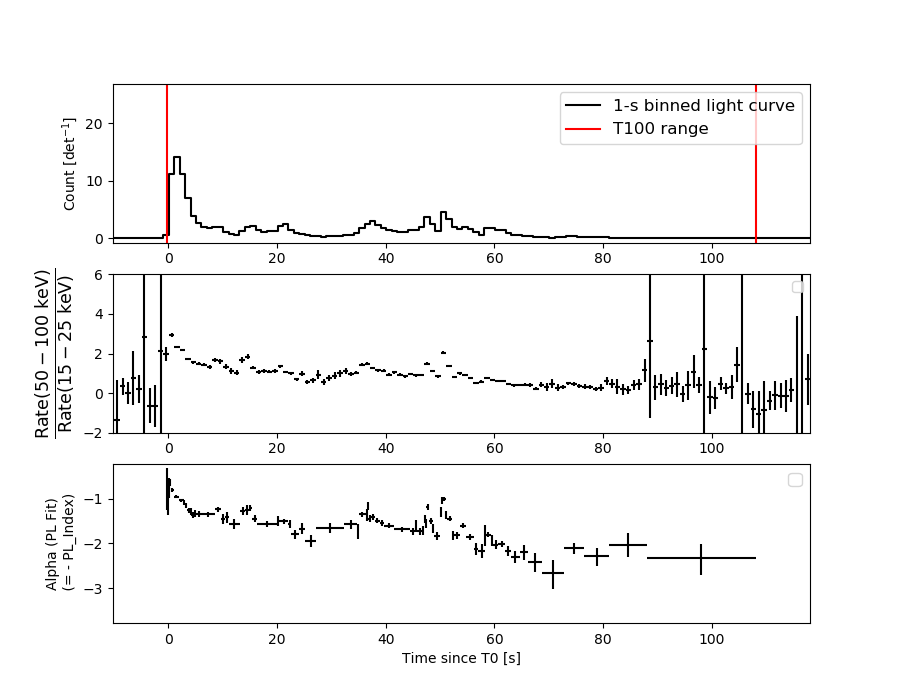
Light Curves
Note: The mask-weighted lightcurves have units of either count/det or counts/sec/det, where a det is 0.4 x 0.4 = 0.16 sq cm.
Full-time range; 1 s binning
Other quick-look light curves:
- 64 ms binning (zoomed)
- 16 ms binning (zoomed)
- 8 ms binning (zoomed)
- 2 ms binning (zoomed)
- SN=5 or 10 s binning (full-time range)
- Raw light curve
Spectra
- 64 ms binning (zoomed)
- 16 ms binning (zoomed)
- 8 ms binning (zoomed)
- 2 ms binning (zoomed)
- SN=5 or 10 s binning (full-time range)
- Raw light curve
Spectra
Notes:
- 1) The fitting includes the systematic errors.
- 2) When the burst includes telescope slew time periods, the fitting uses an average response file made from multiple 5-s response files through out the slew time plus single time preiod for the non-slew times, and weighted by the total counts in the corresponding time period using addrmf. An average response file is needed becuase a spectral fit using the pre-slew DRM will introduce some errors in both a spectral shape and a normalization if the PHA file contains a lot of the slew/post-slew time interval.
- 3) For fits to more complicated models (e.g. a power-law over a cutoff power-law), the BAT team has decided to require a chi-square improvement of more than 6 for each extra dof.
Time averaged spectrum fit using the average DRM
Power-law model
Time interval is from   -0.248 sec. to  108.028 sec.

Spectral model in power-law:
------------------------------------------------------------
Parameters  : value       lower 90%   higher 90%
Photon index: -1.40355     ( -0.0208045   0.020889 )
Norm@50keV  : 9.07475E-02    ( -0.00114518   0.00114274 )
------------------------------------------------------------
#Fit statistic  : Chi-Squared                   48.97     using 59 bins.
 Reduced chi-squared = 0.859123
# Null hypothesis probability of 7.66e-01 with 57 degrees of freedom

Photon flux (15-150 keV)    in 108.3 sec: 11.0605 ( -0.1704  0.171 ) ph/cm2/s
Energy fluence (15-150 keV)             : 9.49071e-05 ( -1.06698e-06  1.06799e-06 ) ergs/cm2
Cutoff power-law model
Time interval is from   -0.248 sec. to  108.028 sec.
Spectral model in the cutoff power-law:
------------------------------------------------------------
Parameters  : value       lower 90%   higher 90%
Photon index: -1.24995     ( -0.0860046   0.0874716 )
Epeak [keV] : 327.218      ( -92.98 309.678 )
Norm@50keV  : 0.103561    ( -0.00725648   0.00789908 )
------------------------------------------------------------
#Fit statistic  : Chi-Squared                   39.66     using 59 bins.
 Reduced chi-squared = 0.708214
# Null hypothesis probability of 9.52e-01 with 56 degrees of freedom

Photon flux (15-150 keV)    in 108.3 sec: 10.8864 ( -0.1924  0.1938 ) ph/cm2/s
Energy fluence (15-150 keV)             : 9.45167e-05 ( -1.08621e-06  1.08786e-06 ) ergs/cm2
1-s peak spectrum fit
Power-law model
Time interval is from    0.952 sec. to    1.952 sec.

Spectral model in power-law:
------------------------------------------------------------
Parameters  : value       lower 90%   higher 90%
Photon index: -0.957149     ( -0.0316382   0.031768 )
Norm@50keV  : 1.00258    ( -0.0185298   0.0184969 )
------------------------------------------------------------
#Fit statistic  : Chi-Squared                   64.15     using 59 bins.
 Reduced chi-squared = 1.12544
# Null hypothesis probability of 2.40e-01 with 57 degrees of freedom

Photon flux (15-150 keV)    in 1 sec: 115.212 ( -2.169  2.172 ) ph/cm2/s
Energy fluence (15-150 keV)             : 1.10118e-05 ( -2.02191e-07  2.02444e-07 ) ergs/cm2
Cutoff power-law model
Time interval is from    0.952 sec. to    1.952 sec.
Spectral model in the cutoff power-law:
------------------------------------------------------------
Parameters  : value       lower 90%   higher 90%
Photon index: -0.662     ( -0.131535   0.135256 )
Epeak [keV] : 286.165      ( -69.3822 170.702 )
Norm@50keV  : 1.31820    ( -0.148166   0.171107 )
------------------------------------------------------------
#Fit statistic  : Chi-Squared                   49.08     using 59 bins.
 Reduced chi-squared = 0.876429
# Null hypothesis probability of 7.32e-01 with 56 degrees of freedom

Photon flux (15-150 keV)    in 1 sec: 113.647 ( -2.256  2.261 ) ph/cm2/s
Energy fluence (15-150 keV)             : 1.08111e-06 ( -7.7876e-07  4.92324e-08 ) ergs/cm2
Time-resolved spectra
Distribution
T90 vs. Hardness ratio plot
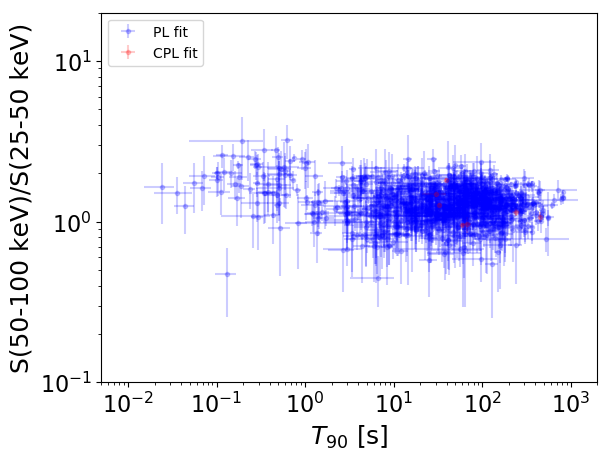
T90                                   = N/A sec.
Hardness ratio (energy fluence ratio) = N/A
S(15-50 keV) vs. S(50-150 keV) plot
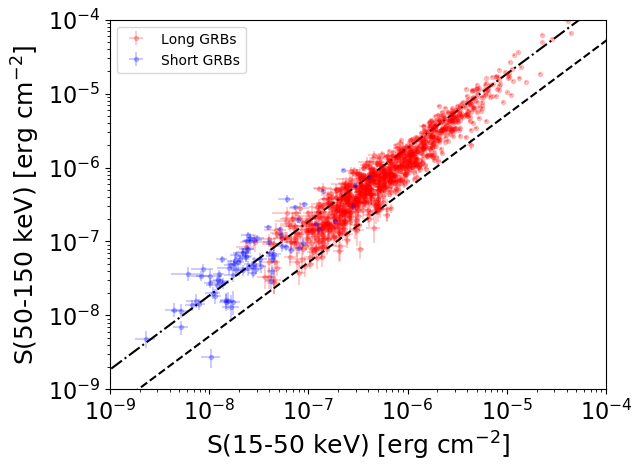
S(15-50 keV)  = N/A
S(50-150 keV) = N/A
The dash-dotted line and the dashed line traces the fluences calculated from the Band function with Epeak = 15 and 150 keV, respectively. Both lines assume a canonical values of alpha = -1 and beta = -2.5.
Mask shadow pattern
IMX = 3.774619440631801E-01, IMY = 6.167769935940357E-01
Spacecraft aspect plot
Bright source in the pre-burst/pre-slew/post-slew images
Pre-burst image of 15-350 keV band
Time interval of the image:
-239.896000 -0.248000

# RAcent  DECcent POSerr Theta    Phi  PeakCts   SNR AngSep     Name
#  [deg]    [deg]    ['] [deg]  [deg]                   [']
254.5016  35.2476    2.8  32.3 -163.1   1.7075   4.1    6.1	Her X-1
268.3966  -1.6261    6.7  24.3  108.4  -0.7659  -1.7   10.6	SW J1753.5-0127
273.9626 -13.8567    5.9  32.4   85.6   1.1229   1.9   11.1	GX 17+2
288.8126  10.7755    7.9   7.5   30.9   0.4994   1.5   10.2	GRS 1915+105
299.5959  35.2074    0.5  22.8  -80.0  10.0701  22.9    0.4	Cyg X-1
308.3555  40.9993    0.0  31.7  -77.9   0.6653   1.1   11.5	Cyg X-3
326.2260  38.2866    8.6  42.3  -62.5   1.6918   1.3    3.3	Cyg X-2
306.8806 -26.7980    3.1  48.8   39.5   5.1542   3.8 ------	UNKNOWN
316.6802  -6.7934    2.8  39.7   10.4   2.4856   4.0 ------	UNKNOWN
238.9196  25.4099    2.8  43.1  175.8   2.6062   4.2 ------	UNKNOWN
331.6898  -0.4549    4.2  49.7   -8.0   1.9890   2.8 ------	UNKNOWN
332.1191   3.8539    2.5  48.6  -13.5   3.2962   4.6 ------	UNKNOWN
258.3931  43.4065    2.6  34.5 -147.8   1.9354   4.4 ------	UNKNOWN
292.2726  58.2696    2.9  41.8 -107.3   8.9845   3.9 ------	UNKNOWN
Pre-slew background subtracted image of 15-350 keV band
Time interval of the image:
-0.248000 9.004590

# RAcent  DECcent POSerr Theta    Phi  PeakCts   SNR AngSep     Name
#  [deg]    [deg]    ['] [deg]  [deg]                   [']
254.6367  35.3166    6.0  32.3 -162.9  -1.0753  -1.9    8.9	Her X-1
268.3898  -1.6232    5.0  24.3  108.5  -1.1819  -2.3   10.3	SW J1753.5-0127
273.9283 -13.9143    8.4  32.5   85.6   0.9258   1.4    8.6	GX 17+2
288.7022  10.8372   10.6   7.4   31.4   0.5146   1.1    8.6	GRS 1915+105
299.5696  35.0370   30.8  22.6  -79.7   0.2376   0.4    9.9	Cyg X-1
308.3555  40.9993    0.0  31.7  -77.9   0.9816   1.1   11.5	Cyg X-3
326.0967  38.1692    6.4  42.2  -62.4   3.5359   1.8    9.8	Cyg X-2
305.0534 -25.4215    3.8  46.8   40.6   3.4628   3.0 ------	UNKNOWN
243.1466  -1.4976    4.3  44.6  136.2   3.6454   2.7 ------	UNKNOWN
270.0125  -4.2096    3.0  25.4  101.7   1.9960   3.9 ------	UNKNOWN
250.0497  10.8514    2.9  33.9  150.7   2.5225   4.0 ------	UNKNOWN
229.5116  34.7475    3.8  51.8 -172.3   3.6909   3.1 ------	UNKNOWN
227.2974  34.4871    3.0  53.6 -172.8   4.8685   3.8 ------	UNKNOWN
319.7179  33.8497    0.2  35.9  -58.5  57.3969  51.9 ------	UNKNOWN
Post-slew image of 15-350 keV band
Time interval of the image:
38.204590 55.804600

# RAcent  DECcent POSerr Theta    Phi  PeakCts   SNR AngSep     Name
#  [deg]    [deg]    ['] [deg]  [deg]                   [']
254.3357  35.2463    8.7  33.9 -150.5  -0.6044  -1.3    8.3	Her X-1
268.2157  -1.5721    0.0  25.1  125.6  -0.3913  -1.0   11.6	SW J1753.5-0127
274.0470 -14.1760    5.6  32.8  101.4   0.9265   2.1    8.7	GX 17+2
288.6741  10.9883   87.4   6.1   53.7   0.0380   0.1    7.8	GRS 1915+105
299.4099  35.1923    8.8  22.3  -70.2   0.4800   1.3    8.9	Cyg X-1
307.8941  40.8763    7.5  30.9  -66.9  -0.7523  -1.5   10.8	Cyg X-3
326.1685  38.2865   98.7  41.4  -50.2   0.0886   0.1    2.1	Cyg X-2
288.7415 -21.3944    3.6  37.9   75.5   2.7090   3.2 ------	UNKNOWN
315.3211 -20.4245    3.2  46.8   40.7   2.7632   3.6 ------	UNKNOWN
249.5255  -9.8007    4.4  44.6  136.2   2.7710   2.6 ------	UNKNOWN
340.0265   1.0121    2.8  55.4    0.2   4.2102   4.1 ------	UNKNOWN
276.7052  27.5197    2.5  14.0 -136.4   1.3115   4.6 ------	UNKNOWN
259.6173  30.1654    3.1  27.7 -155.9   1.0792   3.7 ------	UNKNOWN
272.6523  33.8877    3.4  21.2 -132.3   1.0314   3.4 ------	UNKNOWN
319.7067  33.8616    0.2  34.9  -46.6  29.4205  54.9 ------	UNKNOWN