Analysis Summary
Notes:
- 1) No attempt has been made to eliminate the non-significant decimal places.
- 2) This batgrbproduct analysis is done using the HEASARC data.
- 3) This batgrbproduct analysis is using the flight position for the mask-weighting calculation.
======================================================================
                  BAT GRB EVENT DATA PROCESSING REPORT
    Process Script Ver: batgrbproduct v2.48
    Process Start Time: Fri Jul 29 22:54:54 EDT 2022
             Host Name: batproc1
   Current Working Dir: /local/data/bat1/alien/Swift_3rdBATcatalog/event/batevent_reproc/trigger1059460
======================================================================

  Trigger: 01059460      Segment: 000

  BAT Trigger Time: 647403964.416   [s; MET]
      Trigger Stop: 647403965.44   [s; MET]
               UTC: 2021-07-08T02:25:37.084880    [includes UTCF correction]
       Where From?: TDRSS position message

  BAT
    RA: 173.699151561178   Dec: -49.1867314058096  [deg; J2000]

     Catalogged Source?: NO
     Point Source?:      YES
     GRB Indicated?:     YES    [ by BAT flight software ]
     Image S/N Ratio:    6.82
     Image Trigger?:     NO
     Rate S/N Ratio:     8.42614977317636  [ if not an image trigger ]
     Image S/N Ratio:    6.82

  Analysis Position:   [ source = BAT ]
    RA: 173.699151561178   Dec: -49.1867314058096  [deg; J2000]

  Refined Position:   [ source = BAT pre-slew burst ]
    RA: 173.759670081897   Dec: -49.1655101334572  [deg; J2000]
        { 11h 35m 02.3s , -49d 09' 55.8" }
         +/- 2.14186972714787 [arcmin] (estimated 90% radius based on SNR)
         +/- 1.20709619267709 [arcmin] (formal 1-sigma fit error)
    SNR: 10.2460595633761

  Angular difference between the analysis and refined position is 2.693715 arcmin

  Partial Coding Fraction: 0.9453125    [ including projection effects ]

  Duration
     T90: 2.77199995517731 +/- 0.700048576666753
        Measured from: -0.48800003528595
                   to: 2.28399991989136     [s; relative to TRIGTIME]
     T50: 1.1399998664856 +/- 0.568014068147241
        Measured from: 0.340000033378601
                   to: 1.4799998998642     [s; relative to TRIGTIME]


  Fluence
     Peak Flux  (peak 1 second)
        Measured from: -0.144000053405762
                   to: 0.855999946594238     [s; relative to TRIGTIME]
     Total Fluence
        Measured from: -0.687999963760376
                   to: 2.43999993801117     [s; relative to TRIGTIME]

             Band 1     Band 2     Band 3     Band 4
              15-25      25-50     50-100    100-350     keV
 Total     0.072801   0.113607   0.027765   0.011133
           0.012956   0.013376   0.010784   0.009311 [error]
 Peak      0.028943   0.057250   0.019812   0.006511
           0.007319   0.007720   0.006289   0.005332 [error]

     [ fluence units of on-axis counts / fully illuminated detector ]

======================================================================


====== Table of the duration information =============================

        Value   tstart    tstop
T100    3.128   -0.688    2.440
T90     2.772   -0.488    2.284
T50     1.140    0.340    1.480
Peak    1.000   -0.144    0.856


====== Spectral Analysis Summary =====================================

Model      : spectral model: simple power-law (PL) and cutoff power-law (CPL)
Ph_index   : photon index: E^{Ph_index}
Ph_90err   : 90% error of the photon index
Epeak      : Epeak in keV
Epeak_90err: 90% error of Epeak
Norm       : normalization at 50 keV in both the PL model and CPL model
Nomr_90err : 90% error of the normalization
chi2       : Chi-Squared
dof        : degree of freedo

=== Time-averaged spectral analysis ===
(Best model with acceptable fit: N/A)

Model Ph_index Ph_90err_low Ph_90err_hi  Epeak  Epeak_90err_low  Epeak_90err_hi  Norm       Nomr_90err_low    Norm_90err_hi    chi2    dof
PL      -2.050    -0.303      0.276       -           -               -         3.62e-03     -8.12e-04          7.97e-04      60.530   57
CPL      2.131    -2.228      5.274       34.566      -4.360         5.599      1.66e+00     -1.66e+00          4.46e+03      47.700   56


=== 1-s peak spectral analysis ===
(Best model with acceptable fit: N/A)

Model Ph_index Ph_90err_low Ph_90err_hi  Epeak  Epeak_90err_low  Epeak_90err_hi  Norm       Nomr_90err_low    Norm_90err_hi    chi2    dof
PL      -1.852     -0.342     0.313       -           -               -         5.91e-03     -1.43e-03          1.39e-03      81.530   57
CPL      1.669     -2.252     5.515       40.868      -6.618        10.910      7.32e-01     -7.32e-01          1.77e+03      73.060   56


=== Fluence/Peak Flux Summary ===

              Model    Band1     Band2     Band3     Band4     Band5     Total
                       15-25     25-50    50-100    100-350    15-150    15-350    keV
Fluence         PL   2.43e-08  3.20e-08  3.09e-08  5.32e-08  1.05e-07  1.40e-07   erg/cm2
      90%_error_low -5.05e-09 -5.60e-09 -8.84e-09 -2.42e-08 -2.14e-08 -3.72e-08   erg/cm2
      90%_error_hi   5.15e-09  5.56e-09  9.37e-09  3.47e-08  2.23e-08  4.55e-08   erg/cm2
Peak flux       PL   3.41e-01  2.79e-01  1.55e-01  1.26e-01  8.31e-01  9.01e-01   ph/cm2/s
      90%_error_low -9.02e-02 -5.60e-02 -4.63e-02 -5.89e-02 -1.67e-01 -1.84e-01   ph/cm2/s
      90%_error_hi   9.43e-02  5.60e-02  4.75e-02  8.24e-02  1.67e-01  1.86e-01   ph/cm2/s

Fluence        CPL   2.06e-08  4.74e-08  1.32e-08  1.30e-10  8.14e-08  8.14e-08   erg/cm2
      90%_error_low -6.14e-09 -9.36e-09 -9.26e-09 -1.30e-10 -1.58e-08 -1.58e-08   erg/cm2
      90%_error_hi   6.07e-09  9.43e-09  1.46e-08  3.38e-09  1.84e-08  1.84e-08   erg/cm2
Peak flux      CPL   2.50e-01  4.07e-01  1.19e-01  2.60e-03  7.78e-01  7.79e-01   ph/cm2/s
      90%_error_low -1.11e-01 -9.83e-02 -1.19e-01 -2.60e-03 -1.67e-01 -1.67e-01   ph/cm2/s
      90%_error_hi   1.14e-01  1.05e-01  7.44e-02  3.06e-02  1.68e-01  1.68e-01   ph/cm2/s

======================================================================
Image
Pre-slew 15.0-350.0 keV image (Event data)
#   RAcent    DECcent   POSerr    Theta     Phi              Peak Cts       SNR   Name
  173.7597   -49.1655   0.0188    12.9739   129.1905         0.2421616     10.246 TRIG_01059460

Foreground time interval of the image:
 -0.688   2.440 (delta_t =   3.128 [sec])
Background time interval of the image:
-239.416  -0.688 (delta_t = 238.728 [sec])
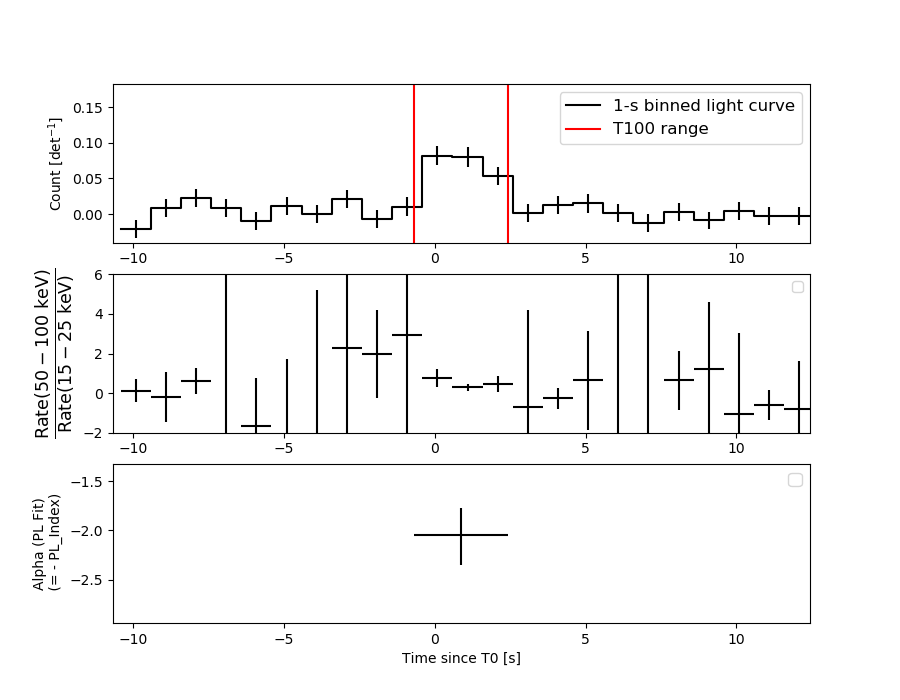
Light Curves
Note: The mask-weighted lightcurves have units of either count/det or counts/sec/det, where a det is 0.4 x 0.4 = 0.16 sq cm.
Full-time range; 1 s binning
Other quick-look light curves:
- 64 ms binning (zoomed)
- 16 ms binning (zoomed)
- 8 ms binning (zoomed)
- 2 ms binning (zoomed)
- SN=5 or 10 s binning (full-time range)
- Raw light curve
Spectra
- 64 ms binning (zoomed)
- 16 ms binning (zoomed)
- 8 ms binning (zoomed)
- 2 ms binning (zoomed)
- SN=5 or 10 s binning (full-time range)
- Raw light curve
Spectra
Notes:
- 1) The fitting includes the systematic errors.
- 2) When the burst includes telescope slew time periods, the fitting uses an average response file made from multiple 5-s response files through out the slew time plus single time preiod for the non-slew times, and weighted by the total counts in the corresponding time period using addrmf. An average response file is needed becuase a spectral fit using the pre-slew DRM will introduce some errors in both a spectral shape and a normalization if the PHA file contains a lot of the slew/post-slew time interval.
- 3) For fits to more complicated models (e.g. a power-law over a cutoff power-law), the BAT team has decided to require a chi-square improvement of more than 6 for each extra dof.
Time averaged spectrum fit using the average DRM
Power-law model
Time interval is from   -0.688 sec. to    2.440 sec.

Spectral model in power-law:
------------------------------------------------------------
Parameters  : value       lower 90%   higher 90%
Photon index: -2.05009     ( -0.301953   0.276571 )
Norm@50keV  : 3.62410E-03    ( -0.000811058   0.000798302 )
------------------------------------------------------------
#Fit statistic  : Chi-Squared                   60.53     using 59 bins.
 Reduced chi-squared = 1.06193
# Null hypothesis probability of 3.50e-01 with 57 degrees of freedom

Photon flux (15-150 keV)    in 3.128 sec: 0.556551 ( -0.093715  0.093749 ) ph/cm2/s
Energy fluence (15-150 keV)             : 1.04859e-07 ( -2.14189e-08  2.22879e-08 ) ergs/cm2
Cutoff power-law model
Time interval is from   -0.688 sec. to    2.440 sec.
Spectral model in the cutoff power-law:
------------------------------------------------------------
Parameters  : value       lower 90%   higher 90%
Photon index: 2.87834     ( -2.25735   5.24446 )
Epeak [keV] : 34.1068      ( -4.32279 5.63623 )
Norm@50keV  : 5.12786    ( -4.84372   4453.52 )
------------------------------------------------------------
#Fit statistic  : Chi-Squared                   47.62     using 59 bins.
 Reduced chi-squared = 0.850357
# Null hypothesis probability of 7.80e-01 with 56 degrees of freedom

Photon flux (15-150 keV)    in 3.128 sec: 0.524800 ( -0.091281  0.091813 ) ph/cm2/s
Energy fluence (15-150 keV)             : 8.14118e-08 ( -1.58038e-08  1.84333e-08 ) ergs/cm2
1-s peak spectrum fit
Power-law model
Time interval is from   -0.144 sec. to    0.856 sec.

Spectral model in power-law:
------------------------------------------------------------
Parameters  : value       lower 90%   higher 90%
Photon index: -1.85172     ( -0.341741   0.313894 )
Norm@50keV  : 5.91102E-03    ( -0.00142713   0.00139335 )
------------------------------------------------------------
#Fit statistic  : Chi-Squared                   81.53     using 59 bins.
 Reduced chi-squared = 1.43035
# Null hypothesis probability of 1.82e-02 with 57 degrees of freedom

Photon flux (15-150 keV)    in 1 sec: 0.831487 ( -0.166777  0.166781 ) ph/cm2/s
Energy fluence (15-150 keV)             : 5.43526e-08 ( -1.28161e-08  1.32464e-08 ) ergs/cm2
Cutoff power-law model
Time interval is from   -0.144 sec. to    0.856 sec.
Spectral model in the cutoff power-law:
------------------------------------------------------------
Parameters  : value       lower 90%   higher 90%
Photon index: 1.66898     ( -2.28661   5.48049 )
Epeak [keV] : 40.8684      ( -6.5207 11.007 )
Norm@50keV  : 0.731618    ( -0.836631   1772.26 )
------------------------------------------------------------
#Fit statistic  : Chi-Squared                   73.06     using 59 bins.
 Reduced chi-squared = 1.30464
# Null hypothesis probability of 6.25e-02 with 56 degrees of freedom

Photon flux (15-150 keV)    in 1 sec: 0.778478 ( -0.166525  0.167851 ) ph/cm2/s
Energy fluence (15-150 keV)             : 4.3443e-08 ( -1.03246e-08  1.25843e-08 ) ergs/cm2
Time-resolved spectra
Distribution
T90 vs. Hardness ratio plot
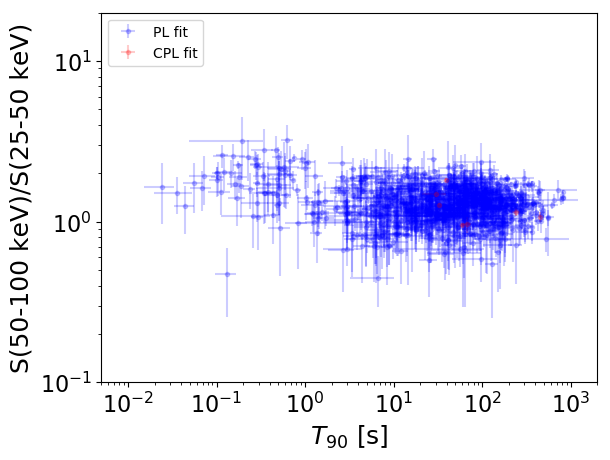
T90                                   = N/A sec.
Hardness ratio (energy fluence ratio) = N/A
S(15-50 keV) vs. S(50-150 keV) plot
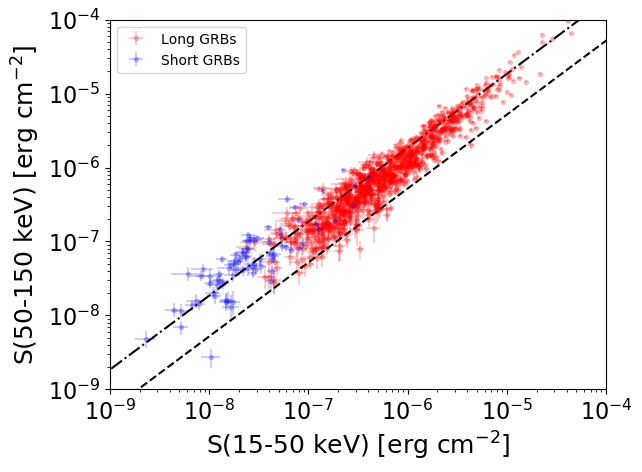
S(15-50 keV)  = N/A
S(50-150 keV) = N/A
The dash-dotted line and the dashed line traces the fluences calculated from the Band function with Epeak = 15 and 150 keV, respectively. Both lines assume a canonical values of alpha = -1 and beta = -2.5.
Mask shadow pattern
IMX = -1.455828367530893E-01, IMY = -1.785626666599883E-01
Spacecraft aspect plot
Bright source in the pre-burst/pre-slew/post-slew images
Pre-burst image of 15-350 keV band
Time interval of the image:
-239.416000 -0.688000

# RAcent  DECcent POSerr Theta    Phi  PeakCts   SNR AngSep     Name
#  [deg]    [deg]    ['] [deg]  [deg]                   [']
135.5046 -40.5633    3.1  25.9 -144.1   1.0765   3.7    1.2	Vela X-1
170.5635 -60.5271    5.1  23.8  142.1   0.7493   2.3    9.3	Cen X-3
186.6492 -62.7317    3.7  28.3  127.1   1.2770   3.1    2.3	GX 301-2
217.2284 -16.9220    2.6  47.1   43.2   4.1814   4.5 ------	UNKNOWN
Pre-slew background subtracted image of 15-350 keV band
Time interval of the image:
-0.688000 2.440000

# RAcent  DECcent POSerr Theta    Phi  PeakCts   SNR AngSep     Name
#  [deg]    [deg]    ['] [deg]  [deg]                   [']
135.7447 -40.6075   25.1  25.7 -144.2   0.0119   0.5   10.3	Vela X-1
170.2932 -60.6642    4.0  23.9  142.4   0.0821   2.9    2.6	Cen X-3
186.5495 -62.7730   10.6  28.3  127.2  -0.0369  -1.1    2.9	GX 301-2
218.2175 -65.8442    1.9  40.7  116.0   0.5468   6.2 ------	UNKNOWN
173.7597 -49.1656    1.1  13.0  129.2   0.2422  10.2 ------	UNKNOWN
192.3580   9.1146    2.3  51.0   -4.6   0.2740   5.1 ------	UNKNOWN
Post-slew image of 15-350 keV band
Time interval of the image:
44.284590 705.184630

# RAcent  DECcent POSerr Theta    Phi  PeakCts   SNR AngSep     Name
#  [deg]    [deg]    ['] [deg]  [deg]                   [']
135.5529 -40.5676    1.4  28.0 -118.8   6.5643   8.6    1.4	Vela X-1
170.3476 -60.5912    3.0  11.6  156.1   2.3901   3.8    2.1	Cen X-3
186.6957 -62.6488    3.0  15.3  124.8   2.5296   3.9    7.4	GX 301-2
218.9898 -23.7180    3.6  43.5   38.9   4.2847   3.2 ------	UNKNOWN
152.4072 -58.3189    2.4  15.5 -166.4   3.1822   4.8 ------	UNKNOWN
170.7001  -9.4388    2.7  39.8  -36.7   4.5365   4.2 ------	UNKNOWN
154.0943  -7.4968    3.9  44.8  -60.2   8.6267   3.0 ------	UNKNOWN