Analysis Summary
Notes:
- 1) No attempt has been made to eliminate the non-significant decimal places.
- 2) This batgrbproduct analysis is done using the HEASARC data.
- 3) This batgrbproduct analysis is using the flight position for the mask-weighting calculation.
======================================================================
BAT GRB EVENT DATA PROCESSING REPORT
Process Script Ver: batgrbproduct v2.48
Process Start Time: Fri Jul 29 22:50:37 EDT 2022
Host Name: batproc1
Current Working Dir: /local/data/bat1/alien/Swift_3rdBATcatalog/event/batevent_reproc/trigger1061223
======================================================================
Trigger: 01061223 Segment: 000
BAT Trigger Time: 648680109.44 [s; MET]
Trigger Stop: 648680110.464 [s; MET]
UTC: 2021-07-22T20:54:42.023740 [includes UTCF correction]
Where From?: TDRSS position message
BAT
RA: 27.0233922800566 Dec: -6.35436196120301 [deg; J2000]
Catalogged Source?: NO
Point Source?: YES
GRB Indicated?: YES [ by BAT flight software ]
Image S/N Ratio: 9.11
Image Trigger?: NO
Rate S/N Ratio: 17.1172427686237 [ if not an image trigger ]
Image S/N Ratio: 9.11
Analysis Position: [ source = BAT ]
RA: 27.0233922800566 Dec: -6.35436196120301 [deg; J2000]
Refined Position: [ source = BAT pre-slew burst ]
RA: 27.0307024613127 Dec: -6.34720816819843 [deg; J2000]
{ 01h 48m 07.4s , -06d 20' 49.9" }
+/- 1.15498673382668 [arcmin] (estimated 90% radius based on SNR)
+/- 0.441155837178855 [arcmin] (formal 1-sigma fit error)
SNR: 24.7584054902602
Angular difference between the analysis and refined position is 0.611769 arcmin
Partial Coding Fraction: 0.4335938 [ including projection effects ]
Duration
T90: 50.2039999961853 +/- 10.5383053075307
Measured from: -2.19600009918213
to: 48.0079998970032 [s; relative to TRIGTIME]
T50: 15.691999912262 +/- 4.34619642913954
Measured from: 1.07999992370605
to: 16.771999835968 [s; relative to TRIGTIME]
Fluence
Peak Flux (peak 1 second)
Measured from: 1
to: 2 [s; relative to TRIGTIME]
Total Fluence
Measured from: -4.40400004386902
to: 59.5919998884201 [s; relative to TRIGTIME]
Band 1 Band 2 Band 3 Band 4
15-25 25-50 50-100 100-350 keV
Total 0.983806 1.383867 1.153502 0.293659
0.080542 0.085029 0.076557 0.066799 [error]
Peak 0.058315 0.095743 0.088971 0.028062
0.012788 0.014390 0.013523 0.010439 [error]
[ fluence units of on-axis counts / fully illuminated detector ]
======================================================================
====== Table of the duration information =============================
Value tstart tstop
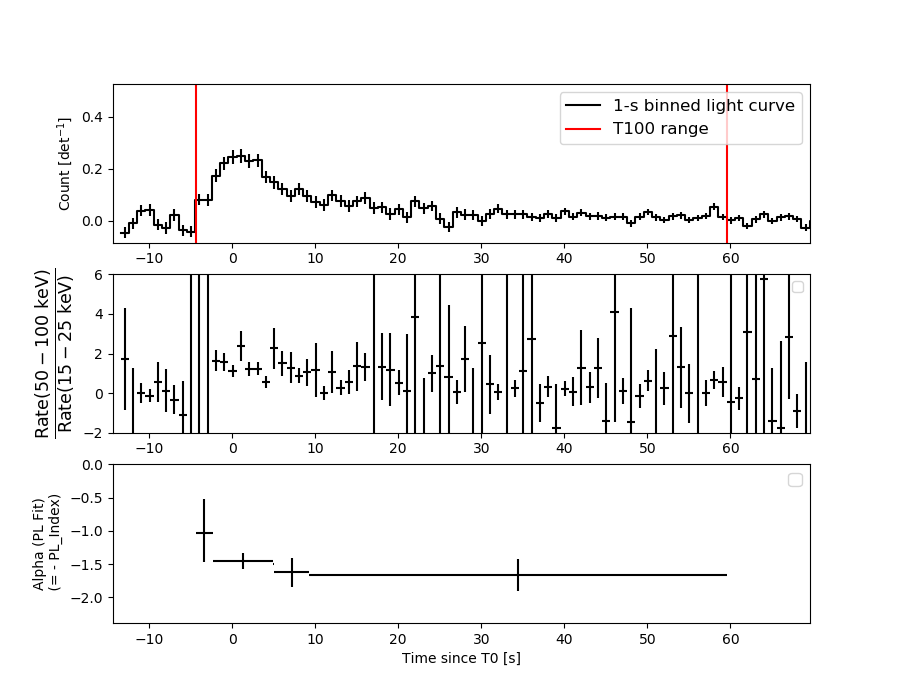
T100 63.996 -4.404 59.592
T90 50.204 -2.196 48.008
T50 15.692 1.080 16.772
Peak 1.000 1.000 2.000
====== Spectral Analysis Summary =====================================
Model : spectral model: simple power-law (PL) and cutoff power-law (CPL)
Ph_index : photon index: E^{Ph_index}
Ph_90err : 90% error of the photon index
Epeak : Epeak in keV
Epeak_90err: 90% error of Epeak
Norm : normalization at 50 keV in both the PL model and CPL model
Nomr_90err : 90% error of the normalization
chi2 : Chi-Squared
dof : degree of freedo
=== Time-averaged spectral analysis ===
(Best model with acceptable fit: N/A)
Model Ph_index Ph_90err_low Ph_90err_hi Epeak Epeak_90err_low Epeak_90err_hi Norm Nomr_90err_low Norm_90err_hi chi2 dof
PL -1.537 -0.115 0.114 - - - 4.06e-03 -2.74e-04 2.73e-04 62.790 57
CPL -0.986 -0.460 0.514 94.814 -23.973 188.343 7.58e-03 -3.02e-03 5.79e-03 58.530 56
=== 1-s peak spectral analysis ===
(Best model with acceptable fit: N/A)
Model Ph_index Ph_90err_low Ph_90err_hi Epeak Epeak_90err_low Epeak_90err_hi Norm Nomr_90err_low Norm_90err_hi chi2 dof
PL -1.572 -0.284 0.273 - - - 1.75e-02 -2.95e-03 2.90e-03 50.580 57
CPL -1.404 -1.307 1.132 182.340 -182.340 -182.340 2.12e-02 -6.62e-03 5.45e-02 50.490 56
=== Fluence/Peak Flux Summary ===
Model Band1 Band2 Band3 Band4 Band5 Total
15-25 25-50 50-100 100-350 15-150 15-350 keV
Fluence PL 3.43e-07 6.17e-07 8.51e-07 2.44e-06 2.45e-06 4.25e-06 erg/cm2
90%_error_low -3.86e-08 -4.34e-08 -7.31e-08 -4.19e-07 -1.77e-07 -4.81e-07 erg/cm2
90%_error_hi 3.99e-08 4.32e-08 7.29e-08 4.74e-07 1.78e-07 5.23e-07 erg/cm2
Peak flux PL 7.70e-01 7.43e-01 5.00e-01 5.25e-01 2.22e+00 2.54e+00 ph/cm2/s
90%_error_low -1.97e-01 -1.25e-01 -1.07e-01 -1.96e-01 -3.61e-01 -4.10e-01 ph/cm2/s
90%_error_hi 2.11e-01 1.24e-01 1.05e-01 2.51e-01 3.61e-01 4.12e-01 ph/cm2/s
Fluence CPL 3.10e-07 6.50e-07 8.86e-07 1.18e-06 2.37e-06 3.03e-06 erg/cm2
90%_error_low -4.70e-08 -5.17e-08 -8.13e-08 -4.97e-07 -1.92e-07 -5.28e-07 erg/cm2
90%_error_hi 4.80e-08 5.28e-08 8.28e-08 9.62e-07 1.92e-07 9.56e-07 erg/cm2
Peak flux CPL 7.47e-01 7.56e-01 5.09e-01 4.35e-01 2.21e+00 2.45e+00 ph/cm2/s
90%_error_low -2.37e-01 -1.35e-01 -1.14e-01 -4.35e-01 -3.69e-01 -5.03e-01 ph/cm2/s
90%_error_hi 2.03e-01 1.48e-01 1.22e-01 2.42e-01 3.68e-01 4.94e-01 ph/cm2/s
======================================================================
Image
Pre-slew 15.0-350.0 keV image (Event data)
#   RAcent    DECcent   POSerr    Theta     Phi              Peak Cts       SNR   Name
   27.0307    -6.3472   0.0078    41.5243    -0.5153         2.8098263     24.758 TRIG_01061223

Foreground time interval of the image:
 -4.404  13.861 (delta_t =  18.265 [sec])
Background time interval of the image:
-239.440  -4.404 (delta_t = 235.036 [sec])
Light Curves
Note: The mask-weighted lightcurves have units of either count/det or counts/sec/det, where a det is 0.4 x 0.4 = 0.16 sq cm.
Full-time range; 1 s binning
Other quick-look light curves:
- 64 ms binning (zoomed)
- 16 ms binning (zoomed)
- 8 ms binning (zoomed)
- 2 ms binning (zoomed)
- SN=5 or 10 s binning (full-time range)
- Raw light curve
Spectra
- 64 ms binning (zoomed)
- 16 ms binning (zoomed)
- 8 ms binning (zoomed)
- 2 ms binning (zoomed)
- SN=5 or 10 s binning (full-time range)
- Raw light curve
Spectra
Notes:
- 1) The fitting includes the systematic errors.
- 2) When the burst includes telescope slew time periods, the fitting uses an average response file made from multiple 5-s response files through out the slew time plus single time preiod for the non-slew times, and weighted by the total counts in the corresponding time period using addrmf. An average response file is needed becuase a spectral fit using the pre-slew DRM will introduce some errors in both a spectral shape and a normalization if the PHA file contains a lot of the slew/post-slew time interval.
- 3) For fits to more complicated models (e.g. a power-law over a cutoff power-law), the BAT team has decided to require a chi-square improvement of more than 6 for each extra dof.
Time averaged spectrum fit using the average DRM
Power-law model
Time interval is from   -4.404 sec. to   59.592 sec.

Spectral model in power-law:
------------------------------------------------------------
Parameters  : value       lower 90%   higher 90%
Photon index: -1.53653     ( -0.114705   0.113846 )
Norm@50keV  : 4.05934E-03    ( -0.000273729   0.000273063 )
------------------------------------------------------------
#Fit statistic  : Chi-Squared                   62.79     using 59 bins.
 Reduced chi-squared = 1.10158
# Null hypothesis probability of 2.79e-01 with 57 degrees of freedom

Photon flux (15-150 keV)    in 64 sec: 0.511922 ( -0.035126  0.035193 ) ph/cm2/s
Energy fluence (15-150 keV)             : 2.45087e-06 ( -1.77341e-07  1.78371e-07 ) ergs/cm2
Cutoff power-law model
Time interval is from   -4.404 sec. to   59.592 sec.
Spectral model in the cutoff power-law:
------------------------------------------------------------
Parameters  : value       lower 90%   higher 90%
Photon index: -0.986298     ( -0.459836   0.5144 )
Epeak [keV] : 94.8136      ( -23.9729 188.343 )
Norm@50keV  : 7.57978E-03    ( -0.00302044   0.00578788 )
------------------------------------------------------------
#Fit statistic  : Chi-Squared                   58.53     using 59 bins.
 Reduced chi-squared = 1.04518
# Null hypothesis probability of 3.83e-01 with 56 degrees of freedom

Photon flux (15-150 keV)    in 64 sec: 0.498875 ( -0.036779  0.03679 ) ph/cm2/s
Energy fluence (15-150 keV)             : 2.36876e-06 ( -1.91597e-07  1.91775e-07 ) ergs/cm2
1-s peak spectrum fit
Power-law model
Time interval is from    1.000 sec. to    2.000 sec.

Spectral model in power-law:
------------------------------------------------------------
Parameters  : value       lower 90%   higher 90%
Photon index: -1.57217     ( -0.284476   0.272666 )
Norm@50keV  : 1.74605E-02    ( -0.00294683   0.00290165 )
------------------------------------------------------------
#Fit statistic  : Chi-Squared                   50.58     using 59 bins.
 Reduced chi-squared = 0.887368
# Null hypothesis probability of 7.13e-01 with 57 degrees of freedom

Photon flux (15-150 keV)    in 1 sec: 2.22492 ( -0.3607  0.36134 ) ph/cm2/s
Energy fluence (15-150 keV)             : 1.63897e-07 ( -2.95834e-08  2.98969e-08 ) ergs/cm2
Cutoff power-law model
Time interval is from    1.000 sec. to    2.000 sec.
Spectral model in the cutoff power-law:
------------------------------------------------------------
Parameters  : value       lower 90%   higher 90%
Photon index: -1.40439     ( -1.30672   1.13249 )
Epeak [keV] : 182.340      ( -182.336 -182.336 )
Norm@50keV  : 2.12046E-02    ( -0.00661531   0.0545299 )
------------------------------------------------------------
#Fit statistic  : Chi-Squared                   50.49     using 59 bins.
 Reduced chi-squared = 0.901607
# Null hypothesis probability of 6.83e-01 with 56 degrees of freedom

Photon flux (15-150 keV)    in 1 sec: 2.21258 ( -0.3686  0.36754 ) ph/cm2/s
Energy fluence (15-150 keV)             : 1.62547e-07 ( -3.10154e-08  3.0241e-08 ) ergs/cm2
Time-resolved spectra
Distribution
T90 vs. Hardness ratio plot
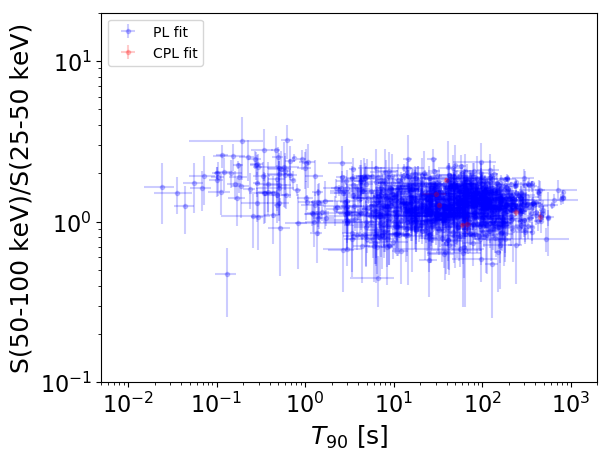
T90                                   = N/A sec.
Hardness ratio (energy fluence ratio) = N/A
S(15-50 keV) vs. S(50-150 keV) plot
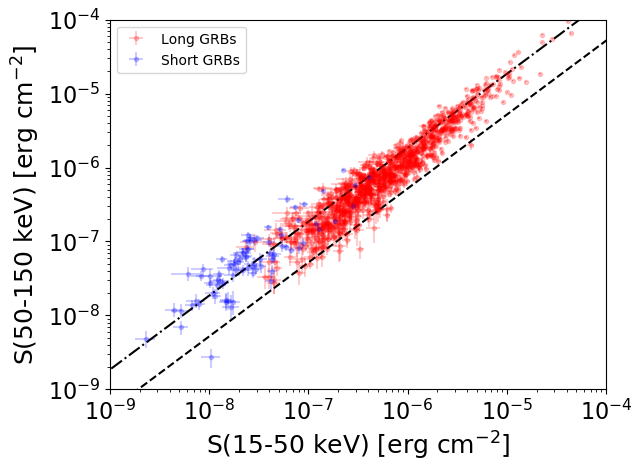
S(15-50 keV)  = N/A
S(50-150 keV) = N/A
The dash-dotted line and the dashed line traces the fluences calculated from the Band function with Epeak = 15 and 150 keV, respectively. Both lines assume a canonical values of alpha = -1 and beta = -2.5.
Mask shadow pattern
IMX = 8.854468711545050E-01, IMY = 7.963226404710136E-03
Spacecraft aspect plot
Bright source in the pre-burst/pre-slew/post-slew images
Pre-burst image of 15-350 keV band
Time interval of the image:
-239.440000 -4.404000

# RAcent  DECcent POSerr Theta    Phi  PeakCts   SNR AngSep     Name
#  [deg]    [deg]    ['] [deg]  [deg]                   [']
308.3168  40.9909    0.0  46.9  154.2   1.1688   1.2    9.6	Cyg X-3
326.1351  38.4693    5.9  33.2  150.3   0.8567   1.9    9.0	Cyg X-2
357.6059   0.2310    2.8  29.9   48.6   1.6618   4.1  144.3	UNKNOWN
324.1488  47.5409    3.4  36.2  165.6   1.4584   3.4 ------	UNKNOWN
341.9383  53.8753    2.2  29.7 -173.8   1.5844   5.3 ------	UNKNOWN
307.9870  80.7470    3.0  56.0 -155.5   5.3774   3.9 ------	UNKNOWN
Pre-slew background subtracted image of 15-350 keV band
Time interval of the image:
-4.404000 13.860590

# RAcent  DECcent POSerr Theta    Phi  PeakCts   SNR AngSep     Name
#  [deg]    [deg]    ['] [deg]  [deg]                   [']
308.1181  40.8689    5.5  47.0  154.1   0.4502   2.1    5.0	Cyg X-3
325.9988  38.2608    7.8  33.3  149.9  -0.1525  -1.5    8.9	Cyg X-2
 27.0307  -6.3472    0.5  41.5   -0.5   2.8101  24.8 ------	UNKNOWN
 36.8104  19.5576    2.6  30.5  -44.8   0.3468   4.4 ------	UNKNOWN
 44.7716   8.9320    1.9  42.5  -35.7   0.7414   6.2 ------	UNKNOWN
 52.1616   1.3201    2.4  52.9  -33.1   1.5749   4.9 ------	UNKNOWN
 55.1526  12.4193    2.4  49.5  -47.2   1.4207   4.8 ------	UNKNOWN
Post-slew image of 15-350 keV band
Time interval of the image:
73.860600 962.683800

# RAcent  DECcent POSerr Theta    Phi  PeakCts   SNR AngSep     Name
#  [deg]    [deg]    ['] [deg]  [deg]                   [']
346.1008  -3.2565    2.1  40.9  112.1  12.6709   5.5 ------	UNKNOWN
359.1017  -4.9481    2.3  27.8  111.1   5.1137   5.1  301.7	UNKNOWN
 13.9578 -26.3812    3.9  23.6   50.1   2.3747   2.9 ------	UNKNOWN
359.6116  30.9422    4.1  45.6  166.1   5.5172   2.8 ------	UNKNOWN
 29.0740 -41.1915    2.9  34.9   17.0   4.0116   4.0 ------	UNKNOWN
 19.8460   6.3906    3.7  14.6  170.2   2.1465   3.2 ------	UNKNOWN
 72.1505 -11.6355    3.1  44.8  -60.2  11.2279   3.7 ------	UNKNOWN