Analysis Summary
Notes:
- 1) No attempt has been made to eliminate the non-significant decimal places.
- 2) This batgrbproduct analysis is done using the HEASARC data.
- 3) This batgrbproduct analysis is using the flight position for the mask-weighting calculation.
======================================================================
                  BAT GRB EVENT DATA PROCESSING REPORT
    Process Script Ver: batgrbproduct v2.48
    Process Start Time: Fri Jul 29 22:49:00 EDT 2022
             Host Name: batproc1
   Current Working Dir: /local/data/bat1/alien/Swift_3rdBATcatalog/event/batevent_reproc/trigger1061284
======================================================================

  Trigger: 01061284      Segment: 000

  BAT Trigger Time: 648744398.336   [s; MET]
      Trigger Stop: 648744399.36   [s; MET]
               UTC: 2021-07-23T14:46:10.915460    [includes UTCF correction]
       Where From?: TDRSS position message

  BAT
    RA: 121.726128854254   Dec: -32.889330847315  [deg; J2000]

     Catalogged Source?: NO
     Point Source?:      YES
     GRB Indicated?:     YES    [ by BAT flight software ]
     Image S/N Ratio:    14.56
     Image Trigger?:     NO
     Rate S/N Ratio:     36.3455636907725  [ if not an image trigger ]
     Image S/N Ratio:    14.56

  Analysis Position:   [ source = BAT ]
    RA: 121.726128854254   Dec: -32.889330847315  [deg; J2000]

  Refined Position:   [ source = BAT pre-slew burst ]
    RA: 121.720931608691   Dec: -32.8937052398194  [deg; J2000]
        { 08h 06m 53.0s , -32d 53' 37.3" }
         +/- 0.660909558124809 [arcmin] (estimated 90% radius based on SNR)
         +/- 0.175657637037275 [arcmin] (formal 1-sigma fit error)
    SNR: 54.961469164534

  Angular difference between the analysis and refined position is 0.370744 arcmin

  Partial Coding Fraction: 0.7734375    [ including projection effects ]

  Duration
     T90: 55.0639998912811 +/- 449.680242135536
        Measured from: -1.89199995994568
                   to: 53.1719999313354     [s; relative to TRIGTIME]
     T50: 18.9719998836517 +/- 4.09143896092851
        Measured from: 3.96800005435944
                   to: 22.9399999380112     [s; relative to TRIGTIME]


  Fluence
     Peak Flux  (peak 1 second)
        Measured from: 2.68400001525879
                   to: 3.68400001525879     [s; relative to TRIGTIME]
     Total Fluence
        Measured from: -4.58799993991852
                   to: 612.796000003815     [s; relative to TRIGTIME]

             Band 1     Band 2     Band 3     Band 4
              15-25      25-50     50-100    100-350     keV
 Total     3.029715   3.890308   2.840110   0.432043
           0.173856   0.179570   0.157314   0.139893 [error]
 Peak      0.071580   0.132988   0.133408   0.023526
           0.009608   0.010925   0.010613   0.007401 [error]

     [ fluence units of on-axis counts / fully illuminated detector ]

======================================================================


====== Table of the duration information =============================

        Value   tstart    tstop
T100  617.384   -4.588  612.796
T90    55.064   -1.892   53.172
T50    18.972    3.968   22.940
Peak    1.000    2.684    3.684


====== Spectral Analysis Summary =====================================

Model      : spectral model: simple power-law (PL) and cutoff power-law (CPL)
Ph_index   : photon index: E^{Ph_index}
Ph_90err   : 90% error of the photon index
Epeak      : Epeak in keV
Epeak_90err: 90% error of Epeak
Norm       : normalization at 50 keV in both the PL model and CPL model
Nomr_90err : 90% error of the normalization
chi2       : Chi-Squared
dof        : degree of freedo

=== Time-averaged spectral analysis ===
(Best model with acceptable fit: N/A)

Model Ph_index Ph_90err_low Ph_90err_hi  Epeak  Epeak_90err_low  Epeak_90err_hi  Norm       Nomr_90err_low    Norm_90err_hi    chi2    dof
PL      -1.650    -0.099      0.098       -           -               -         1.07e-03     -6.00e-05          5.97e-05      63.310   57
CPL     -1.261    -0.387      0.424       94.891     -26.431      2079.139      1.68e-03     -5.92e-04          1.03e-03      60.370   56


=== 1-s peak spectral analysis ===
(Best model with acceptable fit: N/A)

Model Ph_index Ph_90err_low Ph_90err_hi  Epeak  Epeak_90err_low  Epeak_90err_hi  Norm       Nomr_90err_low    Norm_90err_hi    chi2    dof
PL      -1.144     -0.137     0.139       -           -               -         2.46e-02     -2.16e-03          2.16e-03      63.820   57
CPL     -0.173     -0.591     0.691      101.476     -22.575        72.326      7.15e-02     -3.34e-02          7.64e-02      55.240   56


=== Fluence/Peak Flux Summary ===

              Model    Band1     Band2     Band3     Band4     Band5     Total
                       15-25     25-50    50-100    100-350    15-150    15-350    keV
Fluence         PL   9.75e-07  1.64e-06  2.08e-06  5.33e-06  6.17e-06  1.00e-05   erg/cm2
      90%_error_low -8.87e-08 -9.04e-08 -1.56e-07 -8.12e-07 -3.66e-07 -9.41e-07   erg/cm2
      90%_error_hi   9.13e-08  9.01e-08  1.56e-07  9.06e-07  3.68e-07  1.02e-06   erg/cm2
Peak flux       PL   7.20e-01  8.96e-01  8.11e-01  1.27e+00  2.87e+00  3.70e+00   ph/cm2/s
      90%_error_low -1.13e-01 -9.17e-02 -7.95e-02 -2.35e-01 -2.57e-01 -3.42e-01   ph/cm2/s
      90%_error_hi   1.18e-01  9.09e-02  7.90e-02  2.65e-01  2.57e-01  3.46e-01   ph/cm2/s

Fluence        CPL   9.09e-07  1.69e-06  2.13e-06  3.04e-06  5.98e-06  7.77e-06   erg/cm2
      90%_error_low -1.10e-07 -1.07e-07 -1.66e-07 -1.22e-06 -4.12e-07 -1.29e-06   erg/cm2
      90%_error_hi   1.11e-07  1.08e-07  1.68e-07  2.28e-06  4.13e-07  2.29e-06   erg/cm2
Peak flux      CPL   5.87e-01  9.72e-01  9.04e-01  5.39e-01  2.80e+00  3.00e+00   ph/cm2/s
      90%_error_low -1.34e-01 -1.08e-01 -9.88e-02 -2.11e-01 -2.62e-01 -3.37e-01   ph/cm2/s
      90%_error_hi   1.40e-01  1.11e-01  1.01e-01  3.48e-01  2.61e-01  4.04e-01   ph/cm2/s

======================================================================
Image
Pre-slew 15.0-350.0 keV image (Event data)
#   RAcent    DECcent   POSerr    Theta     Phi              Peak Cts       SNR   Name
  121.7209   -32.8937   0.0035    31.3072   -15.3239         5.9106283     54.961 TRIG_01061284

Foreground time interval of the image:
 -4.588  15.565 (delta_t =  20.153 [sec])
Background time interval of the image:
-239.336  -4.588 (delta_t = 234.748 [sec])
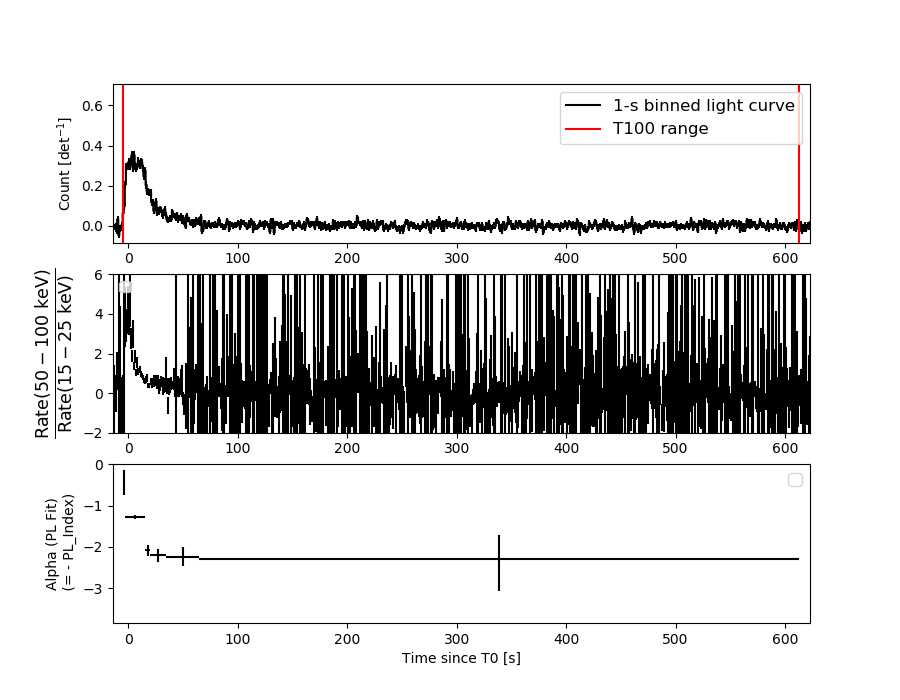
Light Curves
Note: The mask-weighted lightcurves have units of either count/det or counts/sec/det, where a det is 0.4 x 0.4 = 0.16 sq cm.
Full-time range; 1 s binning
Other quick-look light curves:
- 64 ms binning (zoomed)
- 16 ms binning (zoomed)
- 8 ms binning (zoomed)
- 2 ms binning (zoomed)
- SN=5 or 10 s binning (full-time range)
- Raw light curve
Spectra
- 64 ms binning (zoomed)
- 16 ms binning (zoomed)
- 8 ms binning (zoomed)
- 2 ms binning (zoomed)
- SN=5 or 10 s binning (full-time range)
- Raw light curve
Spectra
Notes:
- 1) The fitting includes the systematic errors.
- 2) When the burst includes telescope slew time periods, the fitting uses an average response file made from multiple 5-s response files through out the slew time plus single time preiod for the non-slew times, and weighted by the total counts in the corresponding time period using addrmf. An average response file is needed becuase a spectral fit using the pre-slew DRM will introduce some errors in both a spectral shape and a normalization if the PHA file contains a lot of the slew/post-slew time interval.
- 3) For fits to more complicated models (e.g. a power-law over a cutoff power-law), the BAT team has decided to require a chi-square improvement of more than 6 for each extra dof.
Time averaged spectrum fit using the average DRM
Power-law model
Time interval is from   -4.588 sec. to  612.796 sec.

Spectral model in power-law:
------------------------------------------------------------
Parameters  : value       lower 90%   higher 90%
Photon index: -1.64963     ( -0.0994708   0.0983616 )
Norm@50keV  : 1.07438E-03    ( -5.99789e-05   5.9693e-05 )
------------------------------------------------------------
#Fit statistic  : Chi-Squared                   63.31     using 59 bins.
 Reduced chi-squared = 1.1107
# Null hypothesis probability of 2.64e-01 with 57 degrees of freedom

Photon flux (15-150 keV)    in 617.4 sec: 0.140275 ( -0.007725  0.00774 ) ph/cm2/s
Energy fluence (15-150 keV)             : 6.17016e-06 ( -3.65635e-07  3.68317e-07 ) ergs/cm2
Cutoff power-law model
Time interval is from   -4.588 sec. to  612.796 sec.
Spectral model in the cutoff power-law:
------------------------------------------------------------
Parameters  : value       lower 90%   higher 90%
Photon index: -1.26114     ( -0.387055   0.423607 )
Epeak [keV] : 94.8909      ( -26.4307 2079.13 )
Norm@50keV  : 1.68193E-03    ( -0.000592364   0.001028 )
------------------------------------------------------------
#Fit statistic  : Chi-Squared                   60.37     using 59 bins.
 Reduced chi-squared = 1.07804
# Null hypothesis probability of 3.21e-01 with 56 degrees of freedom

Photon flux (15-150 keV)    in 617.4 sec: 0.137011 ( -0.008358  0.008363 ) ph/cm2/s
Energy fluence (15-150 keV)             : 5.97801e-06 ( -4.11713e-07  4.13397e-07 ) ergs/cm2
1-s peak spectrum fit
Power-law model
Time interval is from    2.684 sec. to    3.684 sec.

Spectral model in power-law:
------------------------------------------------------------
Parameters  : value       lower 90%   higher 90%
Photon index: -1.14438     ( -0.136796   0.138675 )
Norm@50keV  : 2.45922E-02    ( -0.00215661   0.00215625 )
------------------------------------------------------------
#Fit statistic  : Chi-Squared                   63.82     using 59 bins.
 Reduced chi-squared = 1.11965
# Null hypothesis probability of 2.49e-01 with 57 degrees of freedom

Photon flux (15-150 keV)    in 1 sec: 2.86605 ( -0.25714  0.25745 ) ph/cm2/s
Energy fluence (15-150 keV)             : 2.53618e-07 ( -2.41141e-08  2.42573e-08 ) ergs/cm2
Cutoff power-law model
Time interval is from    2.684 sec. to    3.684 sec.
Spectral model in the cutoff power-law:
------------------------------------------------------------
Parameters  : value       lower 90%   higher 90%
Photon index: -0.172854     ( -0.591316   0.690651 )
Epeak [keV] : 101.476      ( -22.5747 72.3258 )
Norm@50keV  : 7.14862E-02    ( -0.0334326   0.0763619 )
------------------------------------------------------------
#Fit statistic  : Chi-Squared                   55.24     using 59 bins.
 Reduced chi-squared = 0.986429
# Null hypothesis probability of 5.04e-01 with 56 degrees of freedom

Photon flux (15-150 keV)    in 1 sec: 2.79812 ( -0.26151  0.26148 ) ph/cm2/s
Energy fluence (15-150 keV)             : 2.42633e-07 ( -2.59823e-08  2.58396e-08 ) ergs/cm2
Time-resolved spectra
Distribution
T90 vs. Hardness ratio plot
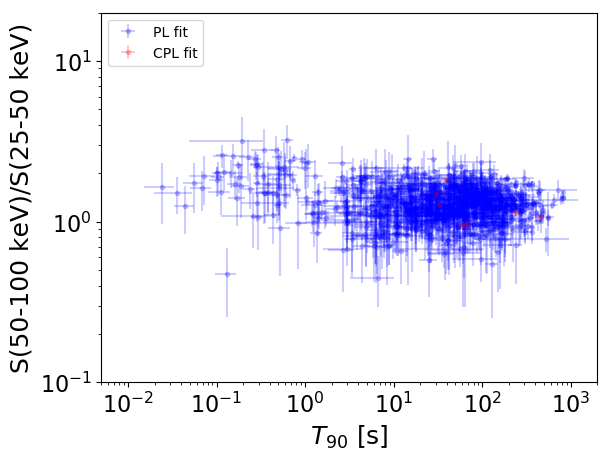
T90                                   = N/A sec.
Hardness ratio (energy fluence ratio) = N/A
S(15-50 keV) vs. S(50-150 keV) plot
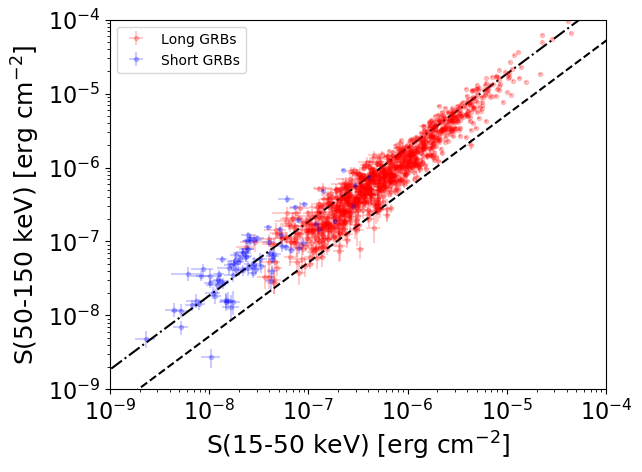
S(15-50 keV)  = N/A
S(50-150 keV) = N/A
The dash-dotted line and the dashed line traces the fluences calculated from the Band function with Epeak = 15 and 150 keV, respectively. Both lines assume a canonical values of alpha = -1 and beta = -2.5.
Mask shadow pattern
IMX = 5.865584203005796E-01, IMY = 1.607272149705196E-01
Spacecraft aspect plot
Bright source in the pre-burst/pre-slew/post-slew images
Pre-burst image of 15-350 keV band
Time interval of the image:
-239.336000 -4.588000

# RAcent  DECcent POSerr Theta    Phi  PeakCts   SNR AngSep     Name
#  [deg]    [deg]    ['] [deg]  [deg]                   [']
 83.6056  22.0157    0.6  41.6 -147.2  10.4168  19.7    1.5	Crab
135.3912 -40.6232    8.9  44.0   -8.5   0.6430   1.3    7.5	Vela X-1
 67.5005  14.5693    3.1  40.4 -173.2   1.6521   3.7 ------	UNKNOWN
149.8326 -33.2996    4.3  54.6  -20.0   2.5869   2.7 ------	UNKNOWN
Pre-slew background subtracted image of 15-350 keV band
Time interval of the image:
-4.588000 15.564600

# RAcent  DECcent POSerr Theta    Phi  PeakCts   SNR AngSep     Name
#  [deg]    [deg]    ['] [deg]  [deg]                   [']
 83.6287  22.0225  369.4  41.6 -147.2  -0.0050  -0.0    0.5	Crab
135.5550 -40.4425    4.2  44.1   -8.8   0.4431   2.8    6.8	Vela X-1
 67.5607 -26.6406    2.6  22.2  108.0   0.4924   4.4 ------	UNKNOWN
121.7209 -32.8937    0.2  31.3  -15.3   5.9107  55.0 ------	UNKNOWN
Post-slew image of 15-350 keV band
Time interval of the image:
78.164590 962.716300

# RAcent  DECcent POSerr Theta    Phi  PeakCts   SNR AngSep     Name
#  [deg]    [deg]    ['] [deg]  [deg]                   [']
135.5179 -40.5792    1.2  13.4   37.4   6.9872   9.6    1.5	Vela X-1
170.1161 -60.6306    5.7  41.7   55.0   4.0549   2.0    5.9	Cen X-3
119.7678  -0.9425    2.6  32.0  -95.3   5.6908   4.4 ------	UNKNOWN