Analysis Summary
Notes:
- 1) No attempt has been made to eliminate the non-significant decimal places.
- 2) This batgrbproduct analysis is done using the HEASARC data.
- 3) This batgrbproduct analysis is using the flight position for the mask-weighting calculation.
======================================================================
                  BAT GRB EVENT DATA PROCESSING REPORT
    Process Script Ver: batgrbproduct v2.48
    Process Start Time: Fri Jul 29 22:47:22 EDT 2022
             Host Name: batproc1
   Current Working Dir: /local/data/bat1/alien/Swift_3rdBATcatalog/event/batevent_reproc/trigger1061482
======================================================================

  Trigger: 01061482      Segment: 000

  BAT Trigger Time: 648850476.672   [s; MET]
      Trigger Stop: 648850480.768   [s; MET]
               UTC: 2021-07-24T20:14:09.244380    [includes UTCF correction]
       Where From?: TDRSS position message

  BAT
    RA: 227.407397668851   Dec: -6.27450560577922  [deg; J2000]

     Catalogged Source?: NO
     Point Source?:      YES
     GRB Indicated?:     YES    [ by BAT flight software ]
     Image S/N Ratio:    7.21
     Image Trigger?:     NO
     Rate S/N Ratio:     9  [ if not an image trigger ]
     Image S/N Ratio:    7.21

  Analysis Position:   [ source = BAT ]
    RA: 227.407397668851   Dec: -6.27450560577922  [deg; J2000]

  Refined Position:   [ source = BAT pre-slew burst ]
    RA: 227.431008044548   Dec: -6.27370168968258  [deg; J2000]
        { 15h 09m 43.4s , -06d 16' 25.3" }
         +/- 1.80651896658924 [arcmin] (estimated 90% radius based on SNR)
         +/- 0.810627025245755 [arcmin] (formal 1-sigma fit error)
    SNR: 13.0677400386894

  Angular difference between the analysis and refined position is 1.408964 arcmin

  Partial Coding Fraction: 0.34375    [ including projection effects ]

  Duration
     T90: 44.1759999990463 +/- 5.37786268260533
        Measured from: -31.2720000743866
                   to: 12.9039999246597     [s; relative to TRIGTIME]
     T50: 17.7760000228882 +/- 11.7732713357007
        Measured from: -12.5839999914169
                   to: 5.19200003147125     [s; relative to TRIGTIME]


  Fluence
     Peak Flux  (peak 1 second)
        Measured from: -0.516000032424927
                   to: 0.483999967575073     [s; relative to TRIGTIME]
     Total Fluence
        Measured from: -33.8160001039505
                   to: 15.2719999551773     [s; relative to TRIGTIME]

             Band 1     Band 2     Band 3     Band 4
              15-25      25-50     50-100    100-350     keV
 Total     1.160439   1.114146   0.517464   0.085480
           0.119683   0.107074   0.086505   0.073024 [error]
 Peak      0.075473   0.090092   0.019603   0.008628
           0.017862   0.016394   0.012618   0.010474 [error]

     [ fluence units of on-axis counts / fully illuminated detector ]

======================================================================


====== Table of the duration information =============================

        Value   tstart    tstop
T100   49.088  -33.816   15.272
T90    44.176  -31.272   12.904
T50    17.776  -12.584    5.192
Peak    1.000   -0.516    0.484


====== Spectral Analysis Summary =====================================

Model      : spectral model: simple power-law (PL) and cutoff power-law (CPL)
Ph_index   : photon index: E^{Ph_index}
Ph_90err   : 90% error of the photon index
Epeak      : Epeak in keV
Epeak_90err: 90% error of Epeak
Norm       : normalization at 50 keV in both the PL model and CPL model
Nomr_90err : 90% error of the normalization
chi2       : Chi-Squared
dof        : degree of freedo

=== Time-averaged spectral analysis ===
(Best model with acceptable fit: N/A)

Model Ph_index Ph_90err_low Ph_90err_hi  Epeak  Epeak_90err_low  Epeak_90err_hi  Norm       Nomr_90err_low    Norm_90err_hi    chi2    dof
PL      -2.220    -0.217      0.204       -           -               -         3.52e-03     -4.85e-04          4.73e-04      48.630   57
CPL     -1.548    -0.454      1.066       29.079     -27.749        15.475      8.37e-03     -8.37e-03          2.47e-02      46.880   56


=== 1-s peak spectral analysis ===
(Best model with acceptable fit: N/A)

Model Ph_index Ph_90err_low Ph_90err_hi  Epeak  Epeak_90err_low  Epeak_90err_hi  Norm       Nomr_90err_low    Norm_90err_hi    chi2    dof
PL      -2.280     -0.433     0.379       -           -               -         1.05e-02     -3.18e-03          3.08e-03      60.410   57
CPL      0.433     -2.175     5.093       34.580     -24.394        11.202      4.53e-01     -4.53e-01          7.46e+02      56.080   56


=== Fluence/Peak Flux Summary ===

              Model    Band1     Band2     Band3     Band4     Band5     Total
                       15-25     25-50    50-100    100-350    15-150    15-350    keV
Fluence         PL   4.36e-07  5.18e-07  4.45e-07  6.51e-07  1.63e-06  2.05e-06   erg/cm2
      90%_error_low -6.84e-08 -5.65e-08 -8.24e-08 -2.12e-07 -1.94e-07 -3.17e-07   erg/cm2
      90%_error_hi   7.09e-08  5.64e-08  8.37e-08  2.69e-07  1.96e-07  3.53e-07   erg/cm2
Peak flux       PL   9.22e-01  5.87e-01  2.42e-01  1.35e-01  1.82e+00  1.89e+00   ph/cm2/s
      90%_error_low -2.92e-01 -1.44e-01 -8.87e-02 -7.40e-02 -4.54e-01 -4.64e-01   ph/cm2/s
      90%_error_hi   3.11e-01  1.44e-01  9.14e-02  1.09e-01  4.56e-01  4.65e-01   ph/cm2/s

Fluence        CPL   4.04e-07  5.57e-07  4.39e-07  2.42e-07  1.55e-06  1.64e-06   erg/cm2
      90%_error_low -8.14e-08 -7.34e-08 -9.57e-08 -1.72e-07 -2.12e-07 -2.85e-07   erg/cm2
      90%_error_hi   8.06e-08  7.76e-08  9.19e-08  5.16e-07  2.20e-07  5.31e-07   erg/cm2
Peak flux      CPL   7.33e-01  7.86e-01  1.95e-01  6.05e-03  1.72e+00  1.72e+00   ph/cm2/s
      90%_error_low -3.45e-01 -2.20e-01 -1.95e-01 -6.05e-03 -4.58e-01 -4.59e-01   ph/cm2/s
      90%_error_hi   3.58e-01  2.29e-01  1.40e-01  8.07e-02  4.64e-01  4.65e-01   ph/cm2/s

======================================================================
Image
Pre-slew 15.0-350.0 keV image (Event data)
#   RAcent    DECcent   POSerr    Theta     Phi              Peak Cts       SNR   Name
  227.4310    -6.2737   0.0147    46.8952    -5.8255         2.9981924     13.068 TRIG_01061482

Foreground time interval of the image:
-33.816  15.272 (delta_t =  49.088 [sec])
Background time interval of the image:
-239.672 -33.816 (delta_t = 205.856 [sec])
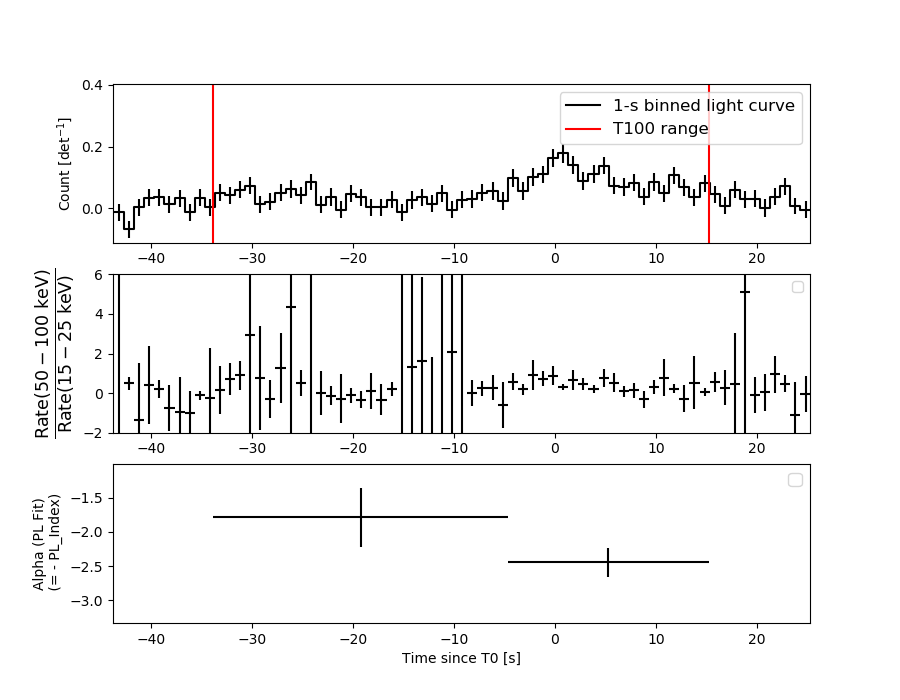
Light Curves
Note: The mask-weighted lightcurves have units of either count/det or counts/sec/det, where a det is 0.4 x 0.4 = 0.16 sq cm.
Full-time range; 1 s binning
Other quick-look light curves:
- 64 ms binning (zoomed)
- 16 ms binning (zoomed)
- 8 ms binning (zoomed)
- 2 ms binning (zoomed)
- SN=5 or 10 s binning (full-time range)
- Raw light curve
Spectra
- 64 ms binning (zoomed)
- 16 ms binning (zoomed)
- 8 ms binning (zoomed)
- 2 ms binning (zoomed)
- SN=5 or 10 s binning (full-time range)
- Raw light curve
Spectra
Notes:
- 1) The fitting includes the systematic errors.
- 2) When the burst includes telescope slew time periods, the fitting uses an average response file made from multiple 5-s response files through out the slew time plus single time preiod for the non-slew times, and weighted by the total counts in the corresponding time period using addrmf. An average response file is needed becuase a spectral fit using the pre-slew DRM will introduce some errors in both a spectral shape and a normalization if the PHA file contains a lot of the slew/post-slew time interval.
- 3) For fits to more complicated models (e.g. a power-law over a cutoff power-law), the BAT team has decided to require a chi-square improvement of more than 6 for each extra dof.
Time averaged spectrum fit using the average DRM
Power-law model
Time interval is from  -33.816 sec. to   15.272 sec.

Spectral model in power-law:
------------------------------------------------------------
Parameters  : value       lower 90%   higher 90%
Photon index: -2.22024     ( -0.216689   0.203727 )
Norm@50keV  : 3.52018E-03    ( -0.000485273   0.000473224 )
------------------------------------------------------------
#Fit statistic  : Chi-Squared                   48.63     using 59 bins.
 Reduced chi-squared = 0.853158
# Null hypothesis probability of 7.77e-01 with 57 degrees of freedom

Photon flux (15-150 keV)    in 49.09 sec: 0.589110 ( -0.066183  0.066387 ) ph/cm2/s
Energy fluence (15-150 keV)             : 1.62983e-06 ( -1.94134e-07  1.96304e-07 ) ergs/cm2
Cutoff power-law model
Time interval is from  -33.816 sec. to   15.272 sec.
Spectral model in the cutoff power-law:
------------------------------------------------------------
Parameters  : value       lower 90%   higher 90%
Photon index: -1.54842     ( -0.453609   1.06609 )
Epeak [keV] : 29.0786      ( -27.7491 15.4754 )
Norm@50keV  : 8.37193E-03    ( -0.00837194   0.0247397 )
------------------------------------------------------------
#Fit statistic  : Chi-Squared                   46.88     using 59 bins.
 Reduced chi-squared = 0.837143
# Null hypothesis probability of 8.02e-01 with 56 degrees of freedom

Photon flux (15-150 keV)    in 49.09 sec: 0.571339 ( -0.070325  0.070185 ) ph/cm2/s
Energy fluence (15-150 keV)             : 1.55036e-06 ( -2.12463e-07  2.19516e-07 ) ergs/cm2
1-s peak spectrum fit
Power-law model
Time interval is from   -0.516 sec. to    0.484 sec.

Spectral model in power-law:
------------------------------------------------------------
Parameters  : value       lower 90%   higher 90%
Photon index: -2.28046     ( -0.432577   0.379963 )
Norm@50keV  : 1.05175E-02    ( -0.0031781   0.00308379 )
------------------------------------------------------------
#Fit statistic  : Chi-Squared                   60.41     using 59 bins.
 Reduced chi-squared = 1.05982
# Null hypothesis probability of 3.54e-01 with 57 degrees of freedom

Photon flux (15-150 keV)    in 1 sec: 1.81856 ( -0.45436  0.45598 ) ph/cm2/s
Energy fluence (15-150 keV)             : 1.00166e-07 ( -2.62259e-08  2.66547e-08 ) ergs/cm2
Cutoff power-law model
Time interval is from   -0.516 sec. to    0.484 sec.
Spectral model in the cutoff power-law:
------------------------------------------------------------
Parameters  : value       lower 90%   higher 90%
Photon index: 0.433023     ( -2.20821   5.06036 )
Epeak [keV] : 34.5804      ( -24.5073 11.0889 )
Norm@50keV  : 0.452898    ( -0.622963   745.547 )
------------------------------------------------------------
#Fit statistic  : Chi-Squared                   56.08     using 59 bins.
 Reduced chi-squared = 1.00143
# Null hypothesis probability of 4.72e-01 with 56 degrees of freedom

Photon flux (15-150 keV)    in 1 sec: 1.72063 ( -0.45846  0.46389 ) ph/cm2/s
Energy fluence (15-150 keV)             : 8.73957e-08 ( -2.41822e-08  2.77108e-08 ) ergs/cm2
Time-resolved spectra
Distribution
T90 vs. Hardness ratio plot
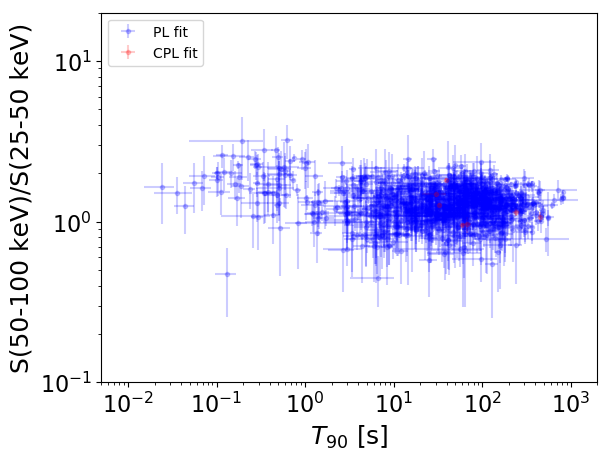
T90                                   = N/A sec.
Hardness ratio (energy fluence ratio) = N/A
S(15-50 keV) vs. S(50-150 keV) plot
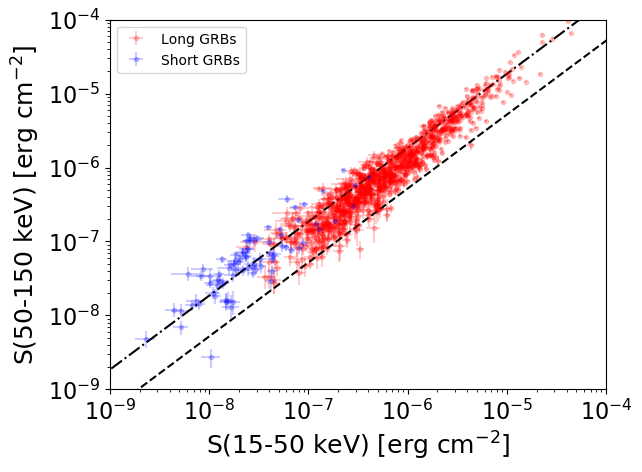
S(15-50 keV)  = N/A
S(50-150 keV) = N/A
The dash-dotted line and the dashed line traces the fluences calculated from the Band function with Epeak = 15 and 150 keV, respectively. Both lines assume a canonical values of alpha = -1 and beta = -2.5.
Mask shadow pattern
IMX = 1.062925553726042E+00, IMY = 1.084459794156913E-01
Spacecraft aspect plot
Bright source in the pre-burst/pre-slew/post-slew images
Pre-burst image of 15-350 keV band
Time interval of the image:
-239.672000 -33.816000

# RAcent  DECcent POSerr Theta    Phi  PeakCts   SNR AngSep     Name
#  [deg]    [deg]    ['] [deg]  [deg]                   [']
170.4805 -60.5606   16.7  40.3 -115.6   0.5403   0.7    6.1	Cen X-3
186.6619 -62.7708    0.4  32.3 -116.2  14.7124  29.6    0.1	GX 301-2
244.9798 -15.6365    0.9  35.4   18.6   6.2839  13.6    0.2	Sco X-1
255.9934 -37.7963    2.6  15.6   54.0   1.5162   4.4    2.9	4U 1700-377
256.1860 -36.3546    0.0  16.9   52.1   0.7956   2.2   12.7	GX 349+2
263.1885 -24.7970    7.5  29.9   53.5   0.6785   1.5   10.3	GX 1+4
264.8100 -44.2473    0.0  15.3   89.3  -0.4199  -1.1   12.5	4U 1735-44
270.0544 -25.0481    0.0  32.6   64.4   0.6443   1.3   12.6	GX 5-1
270.3003 -25.6954    5.4  32.1   65.4   1.0734   2.1    2.9	GRS 1758-258
275.9252 -30.3669  166.3  31.2   78.2  -0.0352  -0.1    0.0	H1820-303
263.0552 -33.6439    0.0  22.1   62.8   0.4129   1.1   11.9	GX 354-0
232.7837 -41.9412    2.5  12.0  -28.1   1.4649   4.7 ------	UNKNOWN
Pre-slew background subtracted image of 15-350 keV band
Time interval of the image:
-33.816000 15.272000

# RAcent  DECcent POSerr Theta    Phi  PeakCts   SNR AngSep     Name
#  [deg]    [deg]    ['] [deg]  [deg]                   [']
170.1716 -60.7322    7.3  40.4 -115.9   0.4896   1.6    7.8	Cen X-3
186.7443 -62.7762    1.7  32.3 -116.2   1.1113   6.6    2.4	GX 301-2
245.0167 -15.5189    6.2  35.5   18.6  -0.3240  -1.9    7.6	Sco X-1
255.8993 -38.0370    0.0  15.3   54.2  -0.2049  -1.6   12.3	4U 1700-377
256.2075 -36.3886    4.9  16.9   52.2  -0.3014  -2.3   11.2	GX 349+2
262.8108 -24.7314    5.9  29.9   52.8  -0.3235  -1.9   10.8	GX 1+4
264.9266 -44.5378   32.8  15.2   90.4   0.0435   0.4    9.5	4U 1735-44
270.4484 -25.1441    3.5  32.7   65.1   0.6909   3.3    9.7	GX 5-1
270.2413 -25.6671    6.6  32.1   65.3  -0.3632  -1.8    5.6	GRS 1758-258
275.7939 -30.4356    5.0  31.1   78.2   0.4820   2.3    7.9	H1820-303
262.9349 -33.7608   10.6  21.9   62.8  -0.1584  -1.1    5.2	GX 354-0
348.6593 -59.4259    2.2  53.8  159.9   2.9969   5.1 ------	UNKNOWN
227.4315  -6.2740    0.9  46.9   -5.8   3.0003  13.1 ------	UNKNOWN
148.9744 -80.2594    2.4  40.9 -147.6   0.8115   4.9 ------	UNKNOWN
 84.6793 -68.5182    2.1  59.5 -154.0   4.0029   5.5 ------	UNKNOWN
117.8697 -68.5602    2.9  54.1 -141.2   2.4584   3.9 ------	UNKNOWN
Post-slew image of 15-350 keV band
Time interval of the image:
103.828630 511.828640

# RAcent  DECcent POSerr Theta    Phi  PeakCts   SNR AngSep     Name
#  [deg]    [deg]    ['] [deg]  [deg]                   [']
244.9876 -15.6305    0.5  19.6  101.4  13.2327  23.5    0.7	Sco X-1
254.4651  35.3047    6.0  48.8   11.0   1.9944   1.9    2.3	Her X-1
256.1377 -37.7843    5.0  40.9  126.0   3.8624   2.3    8.0	4U 1700-377
256.3739 -36.5464    6.4  40.2  124.4   2.7512   1.8    8.0	GX 349+2
263.1132 -24.6991    5.0  38.8  103.7   3.0136   2.3    6.3	GX 1+4
258.5219   1.6126    3.2  32.0   58.2   2.7204   3.6 ------	UNKNOWN
236.3008 -28.0922    3.2  23.4  141.4   2.0466   3.6 ------	UNKNOWN
231.9703  16.1558    3.2  22.9   -7.2   1.6351   3.6 ------	UNKNOWN
195.8312 -30.0657    2.8  38.0 -151.2   2.8239   4.1 ------	UNKNOWN
215.9630  50.3761    3.6  57.5  -27.2  10.4079   3.2 ------	UNKNOWN
195.9317  26.4934    3.3  44.8  -60.1   8.0293   3.5 ------	UNKNOWN