Analysis Summary
Notes:
- 1) No attempt has been made to eliminate the non-significant decimal places.
- 2) This batgrbproduct analysis is done using the HEASARC data.
- 3) This batgrbproduct analysis is using the flight position for the mask-weighting calculation.
======================================================================
BAT GRB EVENT DATA PROCESSING REPORT
Process Script Ver: batgrbproduct v2.48
Process Start Time: Fri Jul 29 22:45:57 EDT 2022
Host Name: batproc1
Current Working Dir: /local/data/bat1/alien/Swift_3rdBATcatalog/event/batevent_reproc/trigger1061511
======================================================================
Trigger: 01061511 Segment: 000
BAT Trigger Time: 648877650.368 [s; MET]
Trigger Stop: 648877655.872 [s; MET]
UTC: 2021-07-25T03:47:02.938560 [includes UTCF correction]
Where From?: TDRSS position message
BAT
RA: 215.362562229834 Dec: -1.17692971172635 [deg; J2000]
Catalogged Source?: NO
Point Source?: YES
GRB Indicated?: YES [ by BAT flight software ]
Image S/N Ratio: 8.32
Image Trigger?: NO
Rate S/N Ratio: 23.7907545067406 [ if not an image trigger ]
Image S/N Ratio: 8.32
Analysis Position: [ source = BAT ]
RA: 215.362562229834 Dec: -1.17692971172635 [deg; J2000]
Refined Position: [ source = BAT pre-slew burst ]
RA: 215.380754874911 Dec: -1.17698819559185 [deg; J2000]
{ 14h 21m 31.4s , -01d 10' 37.2" }
+/- 2.33249921621752 [arcmin] (estimated 90% radius based on SNR)
+/- 1.03310798753396 [arcmin] (formal 1-sigma fit error)
SNR: 9.0710818360342
Angular difference between the analysis and refined position is 1.091334 arcmin
Partial Coding Fraction: 0.9296875 [ including projection effects ]
Duration
T90: 53.5439999103546 +/- 11.2534979998781
Measured from: 0.26800000667572
to: 53.8119999170303 [s; relative to TRIGTIME]
T50: 23.0159999132156 +/- 11.5547339072151
Measured from: 2.86000001430511
to: 25.8759999275208 [s; relative to TRIGTIME]
Fluence
Peak Flux (peak 1 second)
Measured from: 1.00800001621246
to: 2.00800001621246 [s; relative to TRIGTIME]
Total Fluence
Measured from: -0.824000000953674
to: 59.8639999628067 [s; relative to TRIGTIME]
Band 1 Band 2 Band 3 Band 4
15-25 25-50 50-100 100-350 keV
Total 0.363348 0.413693 0.402415 0.086866
0.059988 0.057993 0.051317 0.045949 [error]
Peak 0.022683 0.046439 0.032986 0.019093
0.007754 0.008035 0.007677 0.006844 [error]
[ fluence units of on-axis counts / fully illuminated detector ]
======================================================================
====== Table of the duration information =============================
Value tstart tstop
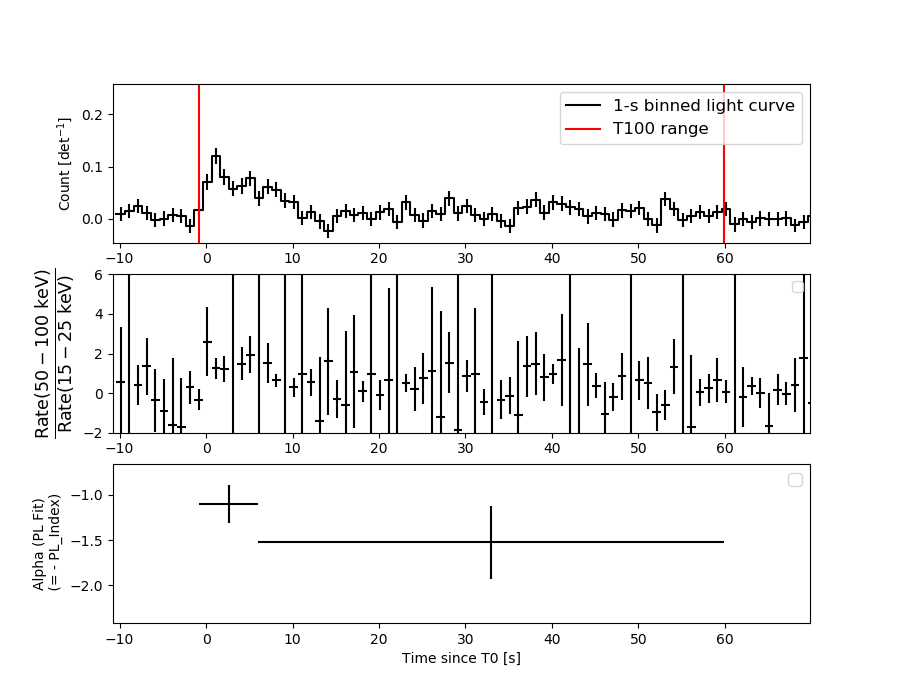
T100 60.688 -0.824 59.864
T90 53.544 0.268 53.812
T50 23.016 2.860 25.876
Peak 1.000 1.008 2.008
====== Spectral Analysis Summary =====================================
Model : spectral model: simple power-law (PL) and cutoff power-law (CPL)
Ph_index : photon index: E^{Ph_index}
Ph_90err : 90% error of the photon index
Epeak : Epeak in keV
Epeak_90err: 90% error of Epeak
Norm : normalization at 50 keV in both the PL model and CPL model
Nomr_90err : 90% error of the normalization
chi2 : Chi-Squared
dof : degree of freedo
=== Time-averaged spectral analysis ===
(Best model with acceptable fit: N/A)
Model Ph_index Ph_90err_low Ph_90err_hi Epeak Epeak_90err_low Epeak_90err_hi Norm Nomr_90err_low Norm_90err_hi chi2 dof
PL -1.336 -0.248 0.248 - - - 1.35e-03 -1.82e-04 1.81e-04 60.490 57
CPL -1.257 -1.667 0.857 496.399 -496.399 -496.399 1.48e-03 -1.31e-03 2.14e-03 60.520 56
=== 1-s peak spectral analysis ===
(Best model with acceptable fit: N/A)
Model Ph_index Ph_90err_low Ph_90err_hi Epeak Epeak_90err_low Epeak_90err_hi Norm Nomr_90err_low Norm_90err_hi chi2 dof
PL -1.103 -0.355 0.370 - - - 7.48e-03 -1.54e-03 1.54e-03 63.480 57
CPL -0.619 0.619 2.052 144.010 -144.010 -144.010 1.31e-02 -7.03e-03 8.14e-02 63.160 56
=== Fluence/Peak Flux Summary ===
Model Band1 Band2 Band3 Band4 Band5 Total
15-25 25-50 50-100 100-350 15-150 15-350 keV
Fluence PL 9.00e-08 1.83e-07 2.90e-07 1.02e-06 8.06e-07 1.58e-06 erg/cm2
90%_error_low -2.15e-08 -2.69e-08 -5.04e-08 -3.45e-07 -1.22e-07 -3.86e-07 erg/cm2
90%_error_hi 2.31e-08 2.64e-08 4.97e-08 4.55e-07 1.24e-07 4.80e-07 erg/cm2
Peak flux PL 2.11e-01 2.69e-01 2.50e-01 4.09e-01 8.68e-01 1.14e+00 ph/cm2/s
90%_error_low -7.82e-02 -6.60e-02 -5.98e-02 -1.74e-01 -1.81e-01 -2.52e-01 ph/cm2/s
90%_error_hi 8.83e-02 6.43e-02 5.89e-02 2.47e-01 1.82e-01 2.69e-01 ph/cm2/s
Fluence CPL 9.01e-08 1.83e-07 2.89e-07 1.04e-06 8.07e-07 1.43e-06 erg/cm2
90%_error_low -2.19e-08 -2.65e-08 -5.02e-08 -7.71e-07 -1.33e-07 -5.85e-07 erg/cm2
90%_error_hi 1.62e-08 3.01e-08 5.53e-08 2.47e-07 9.99e-08 2.57e-07 erg/cm2
Peak flux CPL 1.93e-01 2.82e-01 2.60e-01 2.29e-01 8.50e-01 9.64e-01 ph/cm2/s
90%_error_low -9.01e-02 -7.43e-02 -6.56e-02 -2.29e-01 -1.90e-01 -2.85e-01 ph/cm2/s
90%_error_hi 9.99e-02 8.33e-02 6.92e-02 2.41e-01 1.89e-01 3.17e-01 ph/cm2/s
======================================================================
Image
Pre-slew 15.0-350.0 keV image (Event data)
#   RAcent    DECcent   POSerr    Theta     Phi              Peak Cts       SNR   Name
  215.3808    -1.1770   0.0213    13.0149   -75.9015         1.0691691      9.071 TRIG_01061511

Foreground time interval of the image:
 -0.824  57.133 (delta_t =  57.957 [sec])
Background time interval of the image:
-239.368  -0.824 (delta_t = 238.544 [sec])
Light Curves
Note: The mask-weighted lightcurves have units of either count/det or counts/sec/det, where a det is 0.4 x 0.4 = 0.16 sq cm.
Full-time range; 1 s binning
Other quick-look light curves:
- 64 ms binning (zoomed)
- 16 ms binning (zoomed)
- 8 ms binning (zoomed)
- 2 ms binning (zoomed)
- SN=5 or 10 s binning (full-time range)
- Raw light curve
Spectra
- 64 ms binning (zoomed)
- 16 ms binning (zoomed)
- 8 ms binning (zoomed)
- 2 ms binning (zoomed)
- SN=5 or 10 s binning (full-time range)
- Raw light curve
Spectra
Notes:
- 1) The fitting includes the systematic errors.
- 2) When the burst includes telescope slew time periods, the fitting uses an average response file made from multiple 5-s response files through out the slew time plus single time preiod for the non-slew times, and weighted by the total counts in the corresponding time period using addrmf. An average response file is needed becuase a spectral fit using the pre-slew DRM will introduce some errors in both a spectral shape and a normalization if the PHA file contains a lot of the slew/post-slew time interval.
- 3) For fits to more complicated models (e.g. a power-law over a cutoff power-law), the BAT team has decided to require a chi-square improvement of more than 6 for each extra dof.
Time averaged spectrum fit using the average DRM
Power-law model
Time interval is from   -0.824 sec. to   59.864 sec.

Spectral model in power-law:
------------------------------------------------------------
Parameters  : value       lower 90%   higher 90%
Photon index: -1.33596     ( -0.248194   0.248265 )
Norm@50keV  : 1.35455E-03    ( -0.000181794   0.000181193 )
------------------------------------------------------------
#Fit statistic  : Chi-Squared                   60.49     using 59 bins.
 Reduced chi-squared = 1.06123
# Null hypothesis probability of 3.51e-01 with 57 degrees of freedom

Photon flux (15-150 keV)    in 60.69 sec: 0.162723 ( -0.022084  0.022151 ) ph/cm2/s
Energy fluence (15-150 keV)             : 8.05557e-07 ( -1.2198e-07  1.23789e-07 ) ergs/cm2
Cutoff power-law model

Time interval is from   -0.824 sec. to   59.864 sec.
Spectral model in the cutoff power-law:
------------------------------------------------------------
Parameters  : value       lower 90%   higher 90%
Photon index: -1.33242     ( -1.65878   0.865301 )
Epeak [keV] : 9998.49      ( -9998.56 -9998.56 )
Norm@50keV  : 1.35993E-03    ( -0.00119107   0.00225686 )
------------------------------------------------------------
#Fit statistic  : Chi-Squared                   60.49     using 59 bins.
 Reduced chi-squared = 1.08018
# Null hypothesis probability of 3.17e-01 with 56 degrees of freedom

Photon flux (15-150 keV)    in 60.69 sec: 0.162943 ( -0.023493  0.022049 ) ph/cm2/s
Energy fluence (15-150 keV)             : 8.06801e-07 ( -1.33208e-07  9.99067e-08 ) ergs/cm2
1-s peak spectrum fit
Power-law model
Time interval is from    1.008 sec. to    2.008 sec.

Spectral model in power-law:
------------------------------------------------------------
Parameters  : value       lower 90%   higher 90%
Photon index: -1.10294     ( -0.35461   0.370323 )
Norm@50keV  : 7.48136E-03    ( -0.00153728   0.00153709 )
------------------------------------------------------------
#Fit statistic  : Chi-Squared                   63.48     using 59 bins.
 Reduced chi-squared = 1.11368
# Null hypothesis probability of 2.59e-01 with 57 degrees of freedom

Photon flux (15-150 keV)    in 1 sec: 0.868036 ( -0.18109  0.181574 ) ph/cm2/s
Energy fluence (15-150 keV)             : 7.81538e-08 ( -1.79672e-08  1.83468e-08 ) ergs/cm2
Cutoff power-law model

Time interval is from    1.008 sec. to    2.008 sec.
Spectral model in the cutoff power-law:
------------------------------------------------------------
Parameters  : value       lower 90%   higher 90%
Photon index: -0.619317     ( 0.619383   2.05223 )
Epeak [keV] : 144.010      ( -144.118 -144.118 )
Norm@50keV  : 1.31081E-02    ( -0.00701922   0.0814037 )
------------------------------------------------------------
#Fit statistic  : Chi-Squared                   63.16     using 59 bins.
 Reduced chi-squared = 1.12786
# Null hypothesis probability of 2.38e-01 with 56 degrees of freedom

Photon flux (15-150 keV)    in 1 sec: 0.850379 ( -0.190496  0.188801 ) ph/cm2/s
Energy fluence (15-150 keV)             : 7.45865e-08 ( -2.23276e-08  2.07721e-08 ) ergs/cm2
Time-resolved spectra
Distribution
T90 vs. Hardness ratio plot
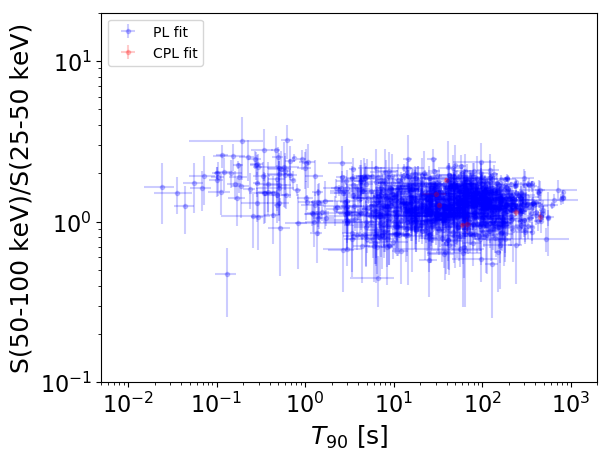
T90                                   = N/A sec.
Hardness ratio (energy fluence ratio) = N/A
S(15-50 keV) vs. S(50-150 keV) plot
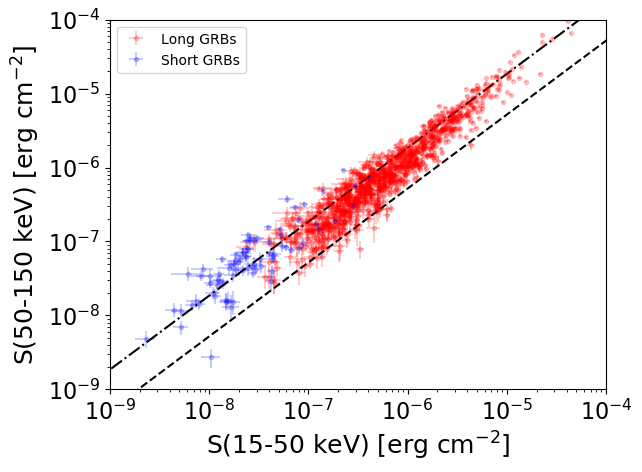
S(15-50 keV)  = N/A
S(50-150 keV) = N/A
The dash-dotted line and the dashed line traces the fluences calculated from the Band function with Epeak = 15 and 150 keV, respectively. Both lines assume a canonical values of alpha = -1 and beta = -2.5.
Mask shadow pattern
IMX = 5.630342241130590E-02, IMY = 2.241789332087629E-01
Spacecraft aspect plot
Bright source in the pre-burst/pre-slew/post-slew images
Pre-burst image of 15-350 keV band
Time interval of the image:
-239.368000 -0.824000

# RAcent  DECcent POSerr Theta    Phi  PeakCts   SNR AngSep     Name
#  [deg]    [deg]    ['] [deg]  [deg]                   [']
244.9743 -15.6450    0.5  19.6  111.3   8.0307  21.2    0.4	Sco X-1
254.3303  35.2293    3.7  48.7   21.0   2.3385   3.1    9.2	Her X-1
255.9895 -37.8438   28.7  40.9  136.1   0.3468   0.4    0.1	4U 1700-377
256.5128 -36.3201   17.1  40.1  134.0  -0.5686  -0.7    7.2	GX 349+2
262.8560 -24.6387    0.0  38.6  113.7  -1.0028  -1.1   10.5	GX 1+4
263.1196 -33.7347    4.7  43.0  126.0  -3.0602  -2.5    8.9	GX 354-0
230.5331  46.6659    3.6  53.0   -5.8   2.3633   3.2 ------	UNKNOWN
179.3742 -35.7213    2.9  52.8 -139.4   5.9588   3.9 ------	UNKNOWN
Pre-slew background subtracted image of 15-350 keV band
Time interval of the image:
-0.824000 57.132590

# RAcent  DECcent POSerr Theta    Phi  PeakCts   SNR AngSep     Name
#  [deg]    [deg]    ['] [deg]  [deg]                   [']
244.8634 -15.5079    4.3  19.5  111.1   0.3937   2.7   10.4	Sco X-1
254.4894  35.3568    9.0  48.8   21.0   0.4216   1.3    1.8	Her X-1
255.9454 -37.7646    4.4  40.8  136.1   0.9395   2.6    5.2	4U 1700-377
256.4600 -36.2844    5.6  40.1  134.0   0.7098   2.0    8.4	GX 349+2
262.9906 -24.8713   13.1  38.8  114.0   0.3662   0.9    7.6	GX 1+4
263.1476 -33.9297    4.0  43.1  126.2  -1.5241  -2.9    9.7	GX 354-0
229.2165 -54.7007    2.5  48.4  170.0   1.5605   4.7 ------	UNKNOWN
215.3808  -1.1770    1.3  13.0  -75.9   1.0687   9.1 ------	UNKNOWN
212.3702  29.5762    1.9  38.7  -29.7   1.0828   6.0 ------	UNKNOWN
Post-slew image of 15-350 keV band
Time interval of the image:
94.532600 962.724200

# RAcent  DECcent POSerr Theta    Phi  PeakCts   SNR AngSep     Name
#  [deg]    [deg]    ['] [deg]  [deg]                   [']
244.9718 -15.6559    0.5  32.6   98.6  33.8319  22.8    1.0	Sco X-1
254.5110  35.3469    5.8  51.6   21.6   6.3559   2.0    2.6	Her X-1
229.8727 -21.1124    3.0  24.4  126.3   4.2279   3.8 ------	UNKNOWN
209.7330 -46.4687    3.3  45.6  166.1   7.2792   3.5 ------	UNKNOWN
212.5932 -15.6192    3.8  14.7  171.3   2.4278   3.0 ------	UNKNOWN
217.8624  58.1990    3.9  59.4  -17.9  16.9935   3.0 ------	UNKNOWN
166.1371 -24.2427    3.0  52.9 -139.3  16.5631   3.8 ------	UNKNOWN
182.8805  31.3184    4.0  44.8  -60.0  10.0508   2.9 ------	UNKNOWN
168.8538 -15.3518    2.8  48.0 -129.1  15.3139   4.1 ------	UNKNOWN