Analysis Summary
Notes:
- 1) No attempt has been made to eliminate the non-significant decimal places.
- 2) This batgrbproduct analysis is done using the HEASARC data.
- 3) This batgrbproduct analysis is using the flight position for the mask-weighting calculation.
======================================================================
                  BAT GRB EVENT DATA PROCESSING REPORT
    Process Script Ver: batgrbproduct v2.48
    Process Start Time: Fri Jul 29 22:42:53 EDT 2022
             Host Name: batproc1
   Current Working Dir: /local/data/bat1/alien/Swift_3rdBATcatalog/event/batevent_reproc/trigger1061554
======================================================================

  Trigger: 01061554      Segment: 000

  BAT Trigger Time: 648907275.456   [s; MET]
      Trigger Stop: 648907278.528   [s; MET]
               UTC: 2021-07-25T12:00:48.024580    [includes UTCF correction]
       Where From?: TDRSS position message

  BAT
    RA: 192.932182299759   Dec: 17.1251868322912  [deg; J2000]

     Catalogged Source?: NO
     Point Source?:      YES
     GRB Indicated?:     YES    [ by BAT flight software ]
     Image S/N Ratio:    7.81
     Image Trigger?:     NO
     Rate S/N Ratio:     11  [ if not an image trigger ]
     Image S/N Ratio:    7.81

  Analysis Position:   [ source = BAT ]
    RA: 192.932182299759   Dec: 17.1251868322912  [deg; J2000]

  Refined Position:   [ source = BAT pre-slew burst ]
    RA: 192.890888455284   Dec: 17.1017936462215  [deg; J2000]
        { 12h 51m 33.8s , +17d 06' 06.5" }
         +/- 3.25037354393711 [arcmin] (estimated 90% radius based on SNR)
         +/- 1.52588488265531 [arcmin] (formal 1-sigma fit error)
    SNR: 5.64657538750426

  Angular difference between the analysis and refined position is 2.752665 arcmin

  Partial Coding Fraction: 0.984375    [ including projection effects ]

  Duration
     T90: 417.907999873161 +/- 158.76587538321
        Measured from: 0.820000052452087
                   to: 418.727999925613     [s; relative to TRIGTIME]
     T50: 290.359999895096 +/- 274.904362450144
        Measured from: 5.74800002574921
                   to: 296.107999920845     [s; relative to TRIGTIME]


  Fluence
     Peak Flux  (peak 1 second)
        Measured from: 0.972000002861023
                   to: 1.97200000286102     [s; relative to TRIGTIME]
     Total Fluence
        Measured from: 0.096000075340271
                   to: 432.399999976158     [s; relative to TRIGTIME]

             Band 1     Band 2     Band 3     Band 4
              15-25      25-50     50-100    100-350     keV
 Total     0.283942   0.531999   0.493366   0.008465
           0.141367   0.146733   0.130113   0.120038 [error]
 Peak      0.018472   0.026418   0.026145   0.020536
           0.006884   0.007501   0.006963   0.006392 [error]

     [ fluence units of on-axis counts / fully illuminated detector ]

======================================================================


====== Table of the duration information =============================

        Value   tstart    tstop
T100  432.304    0.096  432.400
T90   417.908    0.820  418.728
T50   290.360    5.748  296.108
Peak    1.000    0.972    1.972


====== Spectral Analysis Summary =====================================

Model      : spectral model: simple power-law (PL) and cutoff power-law (CPL)
Ph_index   : photon index: E^{Ph_index}
Ph_90err   : 90% error of the photon index
Epeak      : Epeak in keV
Epeak_90err: 90% error of Epeak
Norm       : normalization at 50 keV in both the PL model and CPL model
Nomr_90err : 90% error of the normalization
chi2       : Chi-Squared
dof        : degree of freedo

=== Time-averaged spectral analysis ===
(Best model with acceptable fit: N/A)

Model Ph_index Ph_90err_low Ph_90err_hi  Epeak  Epeak_90err_low  Epeak_90err_hi  Norm       Nomr_90err_low    Norm_90err_hi    chi2    dof
PL      -1.409    -0.510      0.495       -           -               -         2.06e-04     -6.39e-05          6.29e-05      39.750   57
CPL     -0.108    -1.668      3.359       72.168     -28.543       -72.168      9.37e-04     -9.37e-04          3.42e-02      38.530   56


=== 1-s peak spectral analysis ===
(Best model with acceptable fit: N/A)

Model Ph_index Ph_90err_low Ph_90err_hi  Epeak  Epeak_90err_low  Epeak_90err_hi  Norm       Nomr_90err_low    Norm_90err_hi    chi2    dof
PL      -1.152     -0.509     0.552       -           -               -         4.87e-03     -1.37e-03          1.37e-03      70.800   57
CPL     -1.153     -0.507     0.560     9999.360    -9999.360      -9999.360      4.89e-03     -1.38e-03          5.39e-02      70.810   56


=== Fluence/Peak Flux Summary ===

              Model    Band1     Band2     Band3     Band4     Band5     Total
                       15-25     25-50    50-100    100-350    15-150    15-350    keV
Fluence         PL   1.05e-07  2.03e-07  3.06e-07  9.98e-07  8.60e-07  1.61e-06   erg/cm2
      90%_error_low -4.63e-08 -6.25e-08 -1.19e-07 -6.15e-07 -2.90e-07 -7.51e-07   erg/cm2
      90%_error_hi   5.18e-08  6.18e-08  1.20e-07  1.07e-06  3.02e-07  1.13e-06   erg/cm2
Peak flux       PL   1.44e-01  1.78e-01  1.60e-01  2.50e-01  5.68e-01  7.32e-01   ph/cm2/s
      90%_error_low -7.24e-02 -6.05e-02 -5.48e-02 -1.42e-01 -1.62e-01 -2.21e-01   ph/cm2/s
      90%_error_hi   8.28e-02  5.71e-02  5.32e-02  2.40e-01  1.63e-01  2.43e-01   ph/cm2/s

Fluence        CPL   8.41e-08  2.31e-07  3.27e-07  2.20e-07  7.85e-07  8.62e-07   erg/cm2
      90%_error_low -5.67e-08 -7.66e-08 -1.43e-07 -2.01e-07 -2.84e-07 -3.58e-07   erg/cm2
      90%_error_hi   6.07e-08  8.34e-08  1.45e-07  1.24e-06  3.20e-07  1.14e-06   erg/cm2
Peak flux      CPL   1.49e-01  1.76e-01  1.59e-01  2.54e-01  5.71e-01  7.34e-01   ph/cm2/s
      90%_error_low -7.80e-02 -6.14e-02 -5.37e-02     N/A   -1.73e-01 -2.82e-01   ph/cm2/s
      90%_error_hi   7.19e-02  7.19e-02  5.63e-02     N/A    1.66e-01  2.14e-01   ph/cm2/s

======================================================================
Image
Pre-slew 15.0-350.0 keV image (Event data)
#   RAcent    DECcent   POSerr    Theta     Phi              Peak Cts       SNR   Name
  192.8909    17.1018   0.0342    11.4447   147.5529         0.5221035      5.647 TRIG_01061554

Foreground time interval of the image:
  0.096  43.845 (delta_t =  43.749 [sec])
Background time interval of the image:
-239.456   0.096 (delta_t = 239.552 [sec])
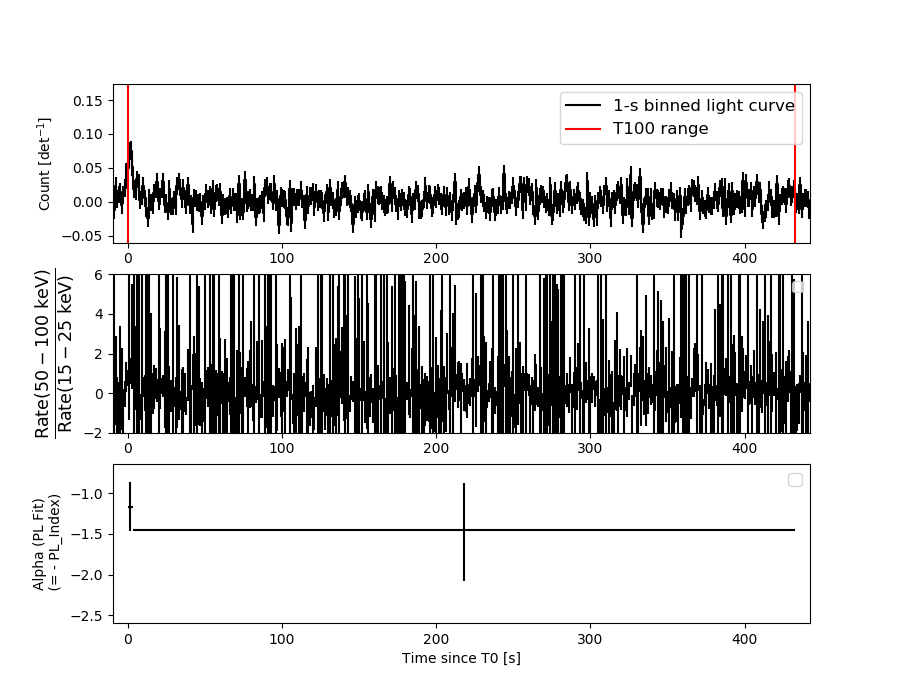
Light Curves
Note: The mask-weighted lightcurves have units of either count/det or counts/sec/det, where a det is 0.4 x 0.4 = 0.16 sq cm.
Full-time range; 1 s binning
Other quick-look light curves:
- 64 ms binning (zoomed)
- 16 ms binning (zoomed)
- 8 ms binning (zoomed)
- 2 ms binning (zoomed)
- SN=5 or 10 s binning (full-time range)
- Raw light curve
Spectra
- 64 ms binning (zoomed)
- 16 ms binning (zoomed)
- 8 ms binning (zoomed)
- 2 ms binning (zoomed)
- SN=5 or 10 s binning (full-time range)
- Raw light curve
Spectra
Notes:
- 1) The fitting includes the systematic errors.
- 2) When the burst includes telescope slew time periods, the fitting uses an average response file made from multiple 5-s response files through out the slew time plus single time preiod for the non-slew times, and weighted by the total counts in the corresponding time period using addrmf. An average response file is needed becuase a spectral fit using the pre-slew DRM will introduce some errors in both a spectral shape and a normalization if the PHA file contains a lot of the slew/post-slew time interval.
- 3) For fits to more complicated models (e.g. a power-law over a cutoff power-law), the BAT team has decided to require a chi-square improvement of more than 6 for each extra dof.
Time averaged spectrum fit using the average DRM
Power-law model
Time interval is from    0.096 sec. to  432.400 sec.

Spectral model in power-law:
------------------------------------------------------------
Parameters  : value       lower 90%   higher 90%
Photon index: -1.40945     ( -0.5105   0.494452 )
Norm@50keV  : 2.06194E-04    ( -6.39373e-05   6.29256e-05 )
------------------------------------------------------------
#Fit statistic  : Chi-Squared                   39.75     using 59 bins.
 Reduced chi-squared = 0.697368
# Null hypothesis probability of 9.60e-01 with 57 degrees of freedom

Photon flux (15-150 keV)    in 432.3 sec: 2.51652E-02 ( -0.0074806  0.0074901 ) ph/cm2/s
Energy fluence (15-150 keV)             : 8.59814e-07 ( -2.89657e-07  3.01675e-07 ) ergs/cm2
Cutoff power-law model
Time interval is from    0.096 sec. to  432.400 sec.
Spectral model in the cutoff power-law:
------------------------------------------------------------
Parameters  : value       lower 90%   higher 90%
Photon index: -0.108394     ( -1.67681   3.35037 )
Epeak [keV] : 72.1678      ( -28.395 -72.0194 )
Norm@50keV  : 9.37186E-04    ( -0.000946202   0.0341804 )
------------------------------------------------------------
#Fit statistic  : Chi-Squared                   38.53     using 59 bins.
 Reduced chi-squared = 0.688036
# Null hypothesis probability of 9.64e-01 with 56 degrees of freedom

Photon flux (15-150 keV)    in 432.3 sec: 2.39578E-02 ( -0.0077259  0.0077241 ) ph/cm2/s
Energy fluence (15-150 keV)             : 7.85174e-07 ( -2.84188e-07  3.20496e-07 ) ergs/cm2
1-s peak spectrum fit
Power-law model
Time interval is from    0.972 sec. to    1.972 sec.

Spectral model in power-law:
------------------------------------------------------------
Parameters  : value       lower 90%   higher 90%
Photon index: -1.15198     ( -0.508623   0.552363 )
Norm@50keV  : 4.87006E-03    ( -0.00137411   0.00137411 )
------------------------------------------------------------
#Fit statistic  : Chi-Squared                   70.80     using 59 bins.
 Reduced chi-squared = 1.24211
# Null hypothesis probability of 1.03e-01 with 57 degrees of freedom

Photon flux (15-150 keV)    in 1 sec: 0.568083 ( -0.162269  0.162631 ) ph/cm2/s
Energy fluence (15-150 keV)             : 5.01095e-08 ( -1.60452e-08  1.65666e-08 ) ergs/cm2
Cutoff power-law model

Time interval is from    0.972 sec. to    1.972 sec.
Spectral model in the cutoff power-law:
------------------------------------------------------------
Parameters  : value       lower 90%   higher 90%
Photon index: -1.15271     ( -0.507101   0.559875 )
Epeak [keV] : 9999.36      ( -9999.36 -9999.36 )
Norm@50keV  : 4.89331E-03    ( -0.00138378   0.0539122 )
------------------------------------------------------------
#Fit statistic  : Chi-Squared                   70.81     using 59 bins.
 Reduced chi-squared = 1.26446
# Null hypothesis probability of 8.79e-02 with 56 degrees of freedom

Photon flux (15-150 keV)    in 1 sec: 0.570808 ( -0.17269  0.165905 ) ph/cm2/s
Energy fluence (15-150 keV)             : 5.05068e-08 ( -1.93086e-08  1.15615e-08 ) ergs/cm2
Time-resolved spectra
Distribution
T90 vs. Hardness ratio plot
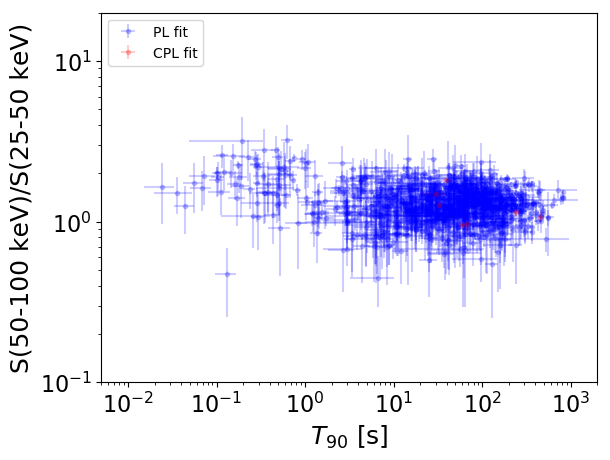
T90                                   = N/A sec.
Hardness ratio (energy fluence ratio) = N/A
S(15-50 keV) vs. S(50-150 keV) plot
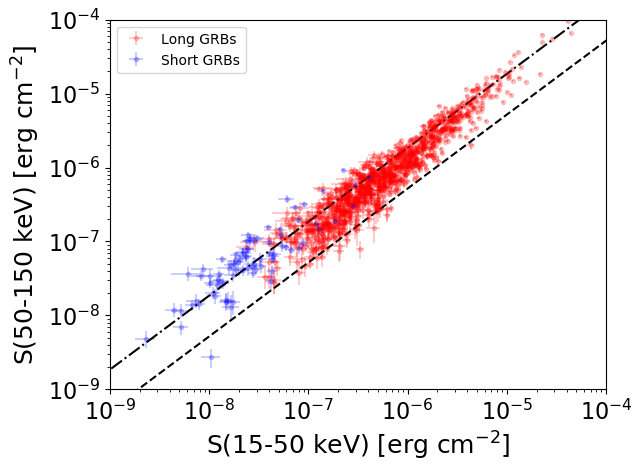
S(15-50 keV)  = N/A
S(50-150 keV) = N/A
The dash-dotted line and the dashed line traces the fluences calculated from the Band function with Epeak = 15 and 150 keV, respectively. Both lines assume a canonical values of alpha = -1 and beta = -2.5.
Mask shadow pattern
IMX = -1.708432704522193E-01, IMY = -1.086174351391151E-01
Spacecraft aspect plot
Bright source in the pre-burst/pre-slew/post-slew images
Pre-burst image of 15-350 keV band
Time interval of the image:
-239.456000 0.096000

# RAcent  DECcent POSerr Theta    Phi  PeakCts   SNR AngSep     Name
#  [deg]    [deg]    ['] [deg]  [deg]                   [']
196.5383  12.0661    3.1  17.4  141.3   1.0914   3.7 ------	UNKNOWN
219.7894  79.2356    3.0  53.0   -6.1   2.4517   3.8 ------	UNKNOWN
160.6724 -22.2244    2.8  57.1 -161.5   5.1144   4.1 ------	UNKNOWN
160.1492 -15.9393    3.2  52.0 -157.0   2.7559   3.7 ------	UNKNOWN
Pre-slew background subtracted image of 15-350 keV band
Time interval of the image:
0.096000 43.844590

# RAcent  DECcent POSerr Theta    Phi  PeakCts   SNR AngSep     Name
#  [deg]    [deg]    ['] [deg]  [deg]                   [']
163.1471 -11.1695    2.4  46.4 -156.9   0.8467   4.8 ------	UNKNOWN
132.3664  75.1915    2.2  54.7  -28.1   2.2181   5.2 ------	UNKNOWN
140.4065  38.0238    2.6  41.4  -76.1   1.5535   4.5 ------	UNKNOWN
Post-slew image of 15-350 keV band
Time interval of the image:
74.844590 437.844600

# RAcent  DECcent POSerr Theta    Phi  PeakCts   SNR AngSep     Name
#  [deg]    [deg]    ['] [deg]  [deg]                   [']
229.6090  41.8736    4.5  39.9   30.3   1.6461   2.6 ------	UNKNOWN
229.9444  46.2706    2.4  42.2   24.6   3.4019   4.9 ------	UNKNOWN