Analysis Summary
Notes:
- 1) No attempt has been made to eliminate the non-significant decimal places.
- 2) This batgrbproduct analysis is done using the HEASARC data.
- 3) This batgrbproduct analysis is using the flight position for the mask-weighting calculation.
======================================================================
BAT GRB EVENT DATA PROCESSING REPORT
Process Script Ver: batgrbproduct v2.48
Process Start Time: Fri Jul 29 22:41:07 EDT 2022
Host Name: batproc1
Current Working Dir: /local/data/bat1/alien/Swift_3rdBATcatalog/event/batevent_reproc/trigger1061687
======================================================================
Trigger: 01061687 Segment: 000
BAT Trigger Time: 649019971.136 [s; MET]
Trigger Stop: 649019971.648 [s; MET]
UTC: 2021-07-26T19:19:03.697060 [includes UTCF correction]
Where From?: TDRSS position message
BAT
RA: 193.341818919826 Dec: 19.1846373567284 [deg; J2000]
Catalogged Source?: NO
Point Source?: YES
GRB Indicated?: YES [ by BAT flight software ]
Image S/N Ratio: 6.71
Image Trigger?: NO
Rate S/N Ratio: 13.4536240470737 [ if not an image trigger ]
Image S/N Ratio: 6.71
Analysis Position: [ source = BAT ]
RA: 193.341818919826 Dec: 19.1846373567284 [deg; J2000]
Refined Position: [ source = BAT pre-slew burst ]
RA: 193.332630692449 Dec: 19.2106510288083 [deg; J2000]
{ 12h 53m 19.8s , +19d 12' 38.3" }
+/- 2.55025607769317 [arcmin] (estimated 90% radius based on SNR)
+/- 1.53944424218125 [arcmin] (formal 1-sigma fit error)
SNR: 7.98517415602625
Angular difference between the analysis and refined position is 1.645364 arcmin
Partial Coding Fraction: 1.015625 [ including projection effects ]
Duration
T90: 0.383999943733215 +/- 0.111211531908395
Measured from: 0.0159999132156372
to: 0.399999856948853 [s; relative to TRIGTIME]
T50: 0.179999947547913 +/- 0.0865332406622053
Measured from: 0.139999985694885
to: 0.319999933242798 [s; relative to TRIGTIME]
Fluence
Peak Flux (peak 1 second)
Measured from: -0.287999987602234
to: 0.712000012397766 [s; relative to TRIGTIME]
Total Fluence
Measured from: -0.00400006771087646
to: 0.423999905586243 [s; relative to TRIGTIME]
Band 1 Band 2 Band 3 Band 4
15-25 25-50 50-100 100-350 keV
Total 0.016171 0.031378 0.023115 0.004193
0.005094 0.005667 0.005019 0.003812 [error]
Peak 0.021811 0.035741 0.018568 0.005711
0.007345 0.008083 0.007108 0.005706 [error]
[ fluence units of on-axis counts / fully illuminated detector ]
======================================================================
====== Table of the duration information =============================
Value tstart tstop
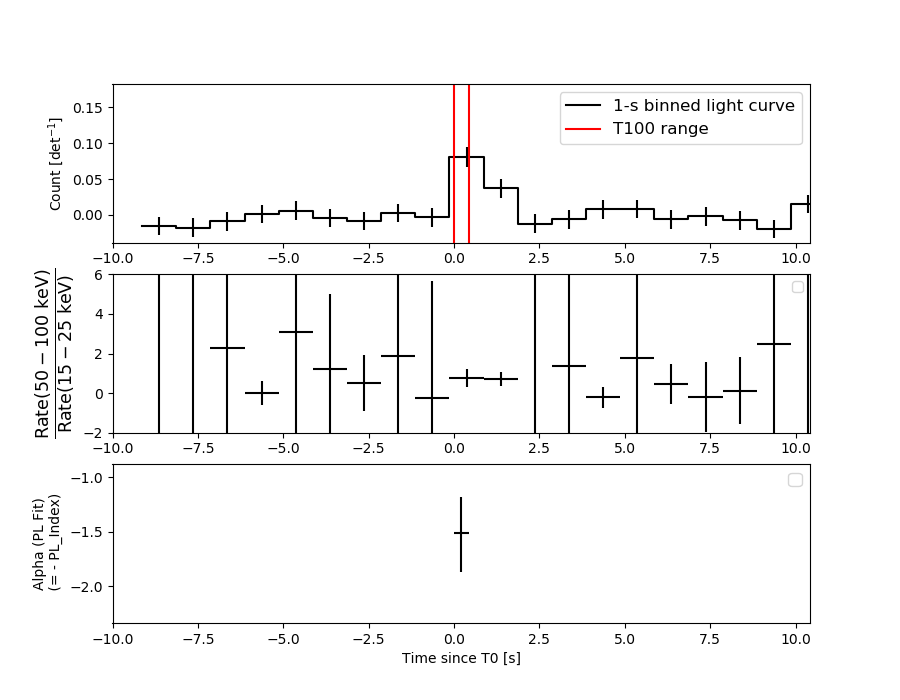
T100 0.428 -0.004 0.424
T90 0.384 0.016 0.400
T50 0.180 0.140 0.320
Peak 1.000 -0.288 0.712
====== Spectral Analysis Summary =====================================
Model : spectral model: simple power-law (PL) and cutoff power-law (CPL)
Ph_index : photon index: E^{Ph_index}
Ph_90err : 90% error of the photon index
Epeak : Epeak in keV
Epeak_90err: 90% error of Epeak
Norm : normalization at 50 keV in both the PL model and CPL model
Nomr_90err : 90% error of the normalization
chi2 : Chi-Squared
dof : degree of freedo
=== Time-averaged spectral analysis ===
(Best model with acceptable fit: N/A)
Model Ph_index Ph_90err_low Ph_90err_hi Epeak Epeak_90err_low Epeak_90err_hi Norm Nomr_90err_low Norm_90err_hi chi2 dof
PL -1.516 -0.353 0.336 - - - 1.06e-02 -2.42e-03 2.37e-03 57.230 57
CPL -0.906 -0.915 1.686 85.793 -38.172 -85.793 2.25e-02 -1.40e-02 1.55e-01 56.610 56
=== 1-s peak spectral analysis ===
(Best model with acceptable fit: N/A)
Model Ph_index Ph_90err_low Ph_90err_hi Epeak Epeak_90err_low Epeak_90err_hi Norm Nomr_90err_low Norm_90err_hi chi2 dof
PL -1.682 -0.491 0.443 - - - 4.87e-03 -1.57e-03 1.50e-03 50.310 57
CPL -0.841 -1.354 3.298 57.746 -57.746 -57.746 1.51e-02 -1.51e-02 1.76e+00 49.800 56
=== Fluence/Peak Flux Summary ===
Model Band1 Band2 Band3 Band4 Band5 Total
15-25 25-50 50-100 100-350 15-150 15-350 keV
Fluence PL 5.90e-09 1.07e-08 1.50e-08 4.39e-08 4.31e-08 7.56e-08 erg/cm2
90%_error_low -1.81e-09 -2.29e-09 -4.38e-09 -2.13e-08 -1.06e-08 -2.63e-08 erg/cm2
90%_error_hi 1.91e-09 2.28e-09 4.34e-09 3.05e-08 1.07e-08 3.37e-08 erg/cm2
Peak flux PL 2.39e-01 2.16e-01 1.34e-01 1.28e-01 6.43e-01 7.17e-01 ph/cm2/s
90%_error_low -8.81e-02 -5.81e-02 -5.37e-02 -7.66e-02 -1.73e-01 -2.01e-01 ph/cm2/s
90%_error_hi 9.33e-02 5.81e-02 5.45e-02 1.22e-01 1.73e-01 2.06e-01 ph/cm2/s
Fluence CPL 5.49e-09 1.17e-08 1.56e-08 1.81e-08 4.15e-08 5.09e-08 erg/cm2
90%_error_low -2.08e-09 -2.72e-09 -4.89e-09 -1.53e-08 -1.12e-08 -1.96e-08 erg/cm2
90%_error_hi 2.10e-09 3.22e-09 4.99e-09 4.73e-08 1.14e-08 3.65e-08 erg/cm2
Peak flux CPL 2.24e-01 2.41e-01 1.34e-01 4.26e-02 6.30e-01 6.42e-01 ph/cm2/s
90%_error_low -9.88e-02 -7.78e-02 -7.74e-02 -4.26e-02 -1.75e-01 -1.86e-01 ph/cm2/s
90%_error_hi 1.00e-01 9.24e-02 6.22e-02 1.14e-01 1.76e-01 2.09e-01 ph/cm2/s
======================================================================
Image
Pre-slew 15.0-350.0 keV image (Event data)
#   RAcent    DECcent   POSerr    Theta     Phi              Peak Cts       SNR   Name
  193.3326    19.2107   0.0238     2.1128   -13.4780         0.0777405      7.985 TRIG_01061687

Foreground time interval of the image:
 -0.004   0.424 (delta_t =   0.428 [sec])
Background time interval of the image:
-26.835  -0.004 (delta_t =  26.831 [sec])
Light Curves
Note: The mask-weighted lightcurves have units of either count/det or counts/sec/det, where a det is 0.4 x 0.4 = 0.16 sq cm.
Full-time range; 1 s binning
Other quick-look light curves:
- 64 ms binning (zoomed)
- 16 ms binning (zoomed)
- 8 ms binning (zoomed)
- 2 ms binning (zoomed)
- SN=5 or 10 s binning (full-time range)
- Raw light curve
Spectra
- 64 ms binning (zoomed)
- 16 ms binning (zoomed)
- 8 ms binning (zoomed)
- 2 ms binning (zoomed)
- SN=5 or 10 s binning (full-time range)
- Raw light curve
Spectra
Notes:
- 1) The fitting includes the systematic errors.
- 2) When the burst includes telescope slew time periods, the fitting uses an average response file made from multiple 5-s response files through out the slew time plus single time preiod for the non-slew times, and weighted by the total counts in the corresponding time period using addrmf. An average response file is needed becuase a spectral fit using the pre-slew DRM will introduce some errors in both a spectral shape and a normalization if the PHA file contains a lot of the slew/post-slew time interval.
- 3) For fits to more complicated models (e.g. a power-law over a cutoff power-law), the BAT team has decided to require a chi-square improvement of more than 6 for each extra dof.
Time averaged spectrum fit using the average DRM
Power-law model
Time interval is from   -0.004 sec. to    0.424 sec.

Spectral model in power-law:
------------------------------------------------------------
Parameters  : value       lower 90%   higher 90%
Photon index: -1.51578     ( -0.352783   0.335594 )
Norm@50keV  : 1.06356E-02    ( -0.00242175   0.00237018 )
------------------------------------------------------------
#Fit statistic  : Chi-Squared                   57.23     using 59 bins.
 Reduced chi-squared = 1.00404
# Null hypothesis probability of 4.67e-01 with 57 degrees of freedom

Photon flux (15-150 keV)    in 0.428 sec: 1.33349 ( -0.28158  0.28163 ) ph/cm2/s
Energy fluence (15-150 keV)             : 4.30799e-08 ( -1.05552e-08  1.07426e-08 ) ergs/cm2
Cutoff power-law model
Time interval is from   -0.004 sec. to    0.424 sec.
Spectral model in the cutoff power-law:
------------------------------------------------------------
Parameters  : value       lower 90%   higher 90%
Photon index: -0.906373     ( -0.915172   1.68604 )
Epeak [keV] : 85.7934      ( -38.1719 -85.7934 )
Norm@50keV  : 2.25489E-02    ( -0.0140209   0.154614 )
------------------------------------------------------------
#Fit statistic  : Chi-Squared                   56.61     using 59 bins.
 Reduced chi-squared = 1.01089
# Null hypothesis probability of 4.52e-01 with 56 degrees of freedom

Photon flux (15-150 keV)    in 0.428 sec: 1.32056 ( -0.28403  0.28346 ) ph/cm2/s
Energy fluence (15-150 keV)             : 4.147e-08 ( -1.11769e-08  1.13568e-08 ) ergs/cm2
1-s peak spectrum fit
Power-law model
Time interval is from   -0.288 sec. to    0.712 sec.

Spectral model in power-law:
------------------------------------------------------------
Parameters  : value       lower 90%   higher 90%
Photon index: -1.682     ( -0.491058   0.442646 )
Norm@50keV  : 4.86992E-03    ( -0.0015699   0.00149984 )
------------------------------------------------------------
#Fit statistic  : Chi-Squared                   50.31     using 59 bins.
 Reduced chi-squared = 0.882632
# Null hypothesis probability of 7.22e-01 with 57 degrees of freedom

Photon flux (15-150 keV)    in 1 sec: 0.642790 ( -0.172965  0.172974 ) ph/cm2/s
Energy fluence (15-150 keV)             : 4.51627e-08 ( -1.47139e-08  1.54174e-08 ) ergs/cm2
Cutoff power-law model
Time interval is from   -0.288 sec. to    0.712 sec.
Spectral model in the cutoff power-law:
------------------------------------------------------------
Parameters  : value       lower 90%   higher 90%
Photon index: -0.840585     ( -1.35379   3.29753 )
Epeak [keV] : 57.7464      ( -57.7449 -57.7449 )
Norm@50keV  : 1.50966E-02    ( -0.0150978   1.75554 )
------------------------------------------------------------
#Fit statistic  : Chi-Squared                   49.80     using 59 bins.
 Reduced chi-squared = 0.889286
# Null hypothesis probability of 7.07e-01 with 56 degrees of freedom

Photon flux (15-150 keV)    in 1 sec: 0.630264 ( -0.175298  0.17579 ) ph/cm2/s
Energy fluence (15-150 keV)             : 4.12715e-08 ( -1.56208e-08  1.77486e-08 ) ergs/cm2
Time-resolved spectra
Distribution
T90 vs. Hardness ratio plot
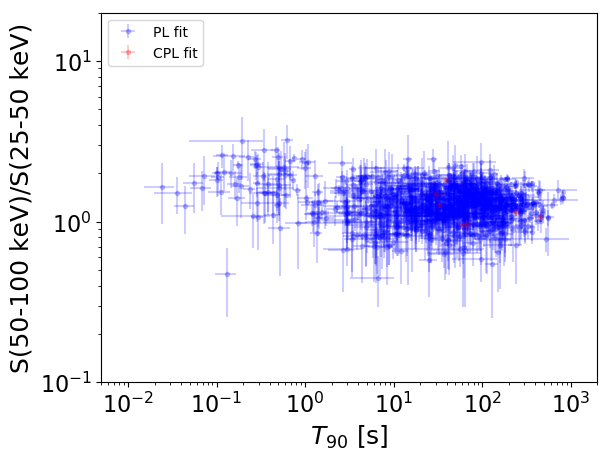
T90                                   = N/A sec.
Hardness ratio (energy fluence ratio) = N/A
S(15-50 keV) vs. S(50-150 keV) plot
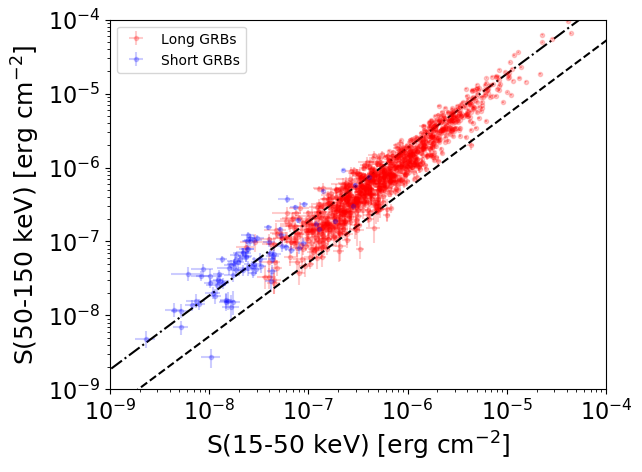
S(15-50 keV)  = N/A
S(50-150 keV) = N/A
The dash-dotted line and the dashed line traces the fluences calculated from the Band function with Epeak = 15 and 150 keV, respectively. Both lines assume a canonical values of alpha = -1 and beta = -2.5.
Mask shadow pattern
IMX = 3.587654926147974E-02, IMY = 8.598641932710489E-03
Spacecraft aspect plot
Bright source in the pre-burst/pre-slew/post-slew images
Pre-burst image of 15-350 keV band
Time interval of the image:
-26.835400 -0.004000

# RAcent  DECcent POSerr Theta    Phi  PeakCts   SNR AngSep     Name
#  [deg]    [deg]    ['] [deg]  [deg]                   [']
241.8080  55.4600    2.4  53.2    8.1   1.1855   4.9 ------	UNKNOWN
161.8745 -12.7998    2.3  42.9 -156.4   0.5670   5.0 ------	UNKNOWN
156.9122  58.8761    2.3  49.3  -47.7   1.7872   5.0 ------	UNKNOWN
Pre-slew background subtracted image of 15-350 keV band
Time interval of the image:
-0.004000 0.424000

# RAcent  DECcent POSerr Theta    Phi  PeakCts   SNR AngSep     Name
#  [deg]    [deg]    ['] [deg]  [deg]                   [']
199.0303  11.9725    2.2   7.8  106.2   0.0506   5.2 ------	UNKNOWN
193.3326  19.2107    1.4   2.1  -13.5   0.0777   8.0 ------	UNKNOWN
Post-slew image of 15-350 keV band
Time interval of the image:
40.364610 962.915500

# RAcent  DECcent POSerr Theta    Phi  PeakCts   SNR AngSep     Name
#  [deg]    [deg]    ['] [deg]  [deg]                   [']
215.5306  24.2845    2.8  21.2   60.0   4.3589   4.2 ------	UNKNOWN
242.4043  64.1502    3.2  55.5   11.4  19.9818   3.6 ------	UNKNOWN
166.5720 -32.3904    2.9  57.6 -165.4  21.1502   3.9 ------	UNKNOWN