Analysis Summary
Notes:
- 1) No attempt has been made to eliminate the non-significant decimal places.
- 2) This batgrbproduct analysis is done using the HEASARC data.
- 3) This batgrbproduct analysis is using the flight position for the mask-weighting calculation.
======================================================================
                  BAT GRB EVENT DATA PROCESSING REPORT
    Process Script Ver: batgrbproduct v2.48
    Process Start Time: Fri Jul 29 22:37:38 EDT 2022
             Host Name: batproc1
   Current Working Dir: /local/data/bat1/alien/Swift_3rdBATcatalog/event/batevent_reproc/trigger1062336
======================================================================

  Trigger: 01062336      Segment: 000

  BAT Trigger Time: 649462896   [s; MET]
      Trigger Stop: 649462984   [s; MET]
               UTC: 2021-07-31T22:21:08.531520    [includes UTCF correction]
       Where From?: TDRSS position message

  BAT
    RA: 300.313626634788   Dec: -28.0420279574902  [deg; J2000]

     Catalogged Source?: NO
     Point Source?:      YES
     GRB Indicated?:     YES    [ by BAT flight software ]
     Image S/N Ratio:    9.45
     Image Trigger?:     YES
     Rate S/N Ratio:     0  [ if not an image trigger ]
     Image S/N Ratio:    9.45

  Analysis Position:   [ source = BAT ]
    RA: 300.313626634788   Dec: -28.0420279574902  [deg; J2000]

  Refined Position:   [ source = BAT pre-slew burst ]
    RA: 300.310579539394   Dec: -28.0555623932543  [deg; J2000]
        { 20h 01m 14.5s , -28d 03' 20.0" }
         +/- 1.65464348874518 [arcmin] (estimated 90% radius based on SNR)
         +/- 0.564292014475115 [arcmin] (formal 1-sigma fit error)
    SNR: 14.8143797585764

  Angular difference between the analysis and refined position is 0.827941 arcmin

  Partial Coding Fraction: 0.390625    [ including projection effects ]

  Duration
     T90: 22.5119999647141 +/- 2.78522750238739
        Measured from: 0.46399998664856
                   to: 22.9759999513626     [s; relative to TRIGTIME]
     T50: 10.5199999809265 +/- 1.67874714133445
        Measured from: 5.41999995708466
                   to: 15.9399999380112     [s; relative to TRIGTIME]


  Fluence
     Peak Flux  (peak 1 second)
        Measured from: 11.2799999713898
                   to: 12.2799999713898     [s; relative to TRIGTIME]
     Total Fluence
        Measured from: -0.779999971389771
                   to: 25.4960000514984     [s; relative to TRIGTIME]

             Band 1     Band 2     Band 3     Band 4
              15-25      25-50     50-100    100-350     keV
 Total     0.400446   1.098970   1.271953   0.281086
           0.075919   0.072051   0.062644   0.050762 [error]
 Peak      0.020323   0.089670   0.080452   0.010119
           0.014278   0.015336   0.012877   0.010048 [error]

     [ fluence units of on-axis counts / fully illuminated detector ]

======================================================================


====== Table of the duration information =============================

        Value   tstart    tstop
T100   26.276   -0.780   25.496
T90    22.512    0.464   22.976
T50    10.520    5.420   15.940
Peak    1.000   11.280   12.280


====== Spectral Analysis Summary =====================================

Model      : spectral model: simple power-law (PL) and cutoff power-law (CPL)
Ph_index   : photon index: E^{Ph_index}
Ph_90err   : 90% error of the photon index
Epeak      : Epeak in keV
Epeak_90err: 90% error of Epeak
Norm       : normalization at 50 keV in both the PL model and CPL model
Nomr_90err : 90% error of the normalization
chi2       : Chi-Squared
dof        : degree of freedo

=== Time-averaged spectral analysis ===
(Best model with acceptable fit: N/A)

Model Ph_index Ph_90err_low Ph_90err_hi  Epeak  Epeak_90err_low  Epeak_90err_hi  Norm       Nomr_90err_low    Norm_90err_hi    chi2    dof
PL      -1.011    -0.109      0.111       -           -               -         8.37e-03     -5.55e-04          5.52e-04      67.960   57
CPL      0.249    -0.553      0.635      106.543     -17.004        36.585      2.82e-02     -1.14e-02          2.21e-02      50.280   56


=== 1-s peak spectral analysis ===
(Best model with acceptable fit: N/A)

Model Ph_index Ph_90err_low Ph_90err_hi  Epeak  Epeak_90err_low  Epeak_90err_hi  Norm       Nomr_90err_low    Norm_90err_hi    chi2    dof
PL      -1.012     -0.325     0.353       -           -               -         1.39e-02     -2.90e-03          2.86e-03      51.790   57
CPL      0.049     -1.200     1.939      111.751     -40.636      -111.751      4.08e-02     -4.08e-02          2.14e-01      50.160   56


=== Fluence/Peak Flux Summary ===

              Model    Band1     Band2     Band3     Band4     Band5     Total
                       15-25     25-50    50-100    100-350    15-150    15-350    keV
Fluence         PL   1.78e-07  4.42e-07  8.78e-07  4.34e-06  2.37e-06  5.83e-06   erg/cm2
      90%_error_low -2.38e-08 -3.67e-08 -5.85e-08 -6.24e-07 -1.55e-07 -6.50e-07   erg/cm2
      90%_error_hi   2.51e-08  3.65e-08  5.83e-08  6.95e-07  1.55e-07  7.12e-07   erg/cm2
Peak flux       PL   3.61e-01  4.86e-01  4.81e-01  8.59e-01  1.61e+00  2.19e+00   ph/cm2/s
      90%_error_low -1.40e-01 -1.29e-01 -9.89e-02 -3.18e-01 -3.39e-01 -4.44e-01   ph/cm2/s
      90%_error_hi   1.64e-01  1.27e-01  9.81e-02  4.25e-01  3.43e-01  4.57e-01   ph/cm2/s

Fluence        CPL   1.23e-07  4.61e-07  9.90e-07  1.31e-06  2.24e-06  2.89e-06   erg/cm2
      90%_error_low -2.91e-08 -4.25e-08 -7.55e-08 -4.39e-07 -1.68e-07 -4.55e-07   erg/cm2
      90%_error_hi   3.15e-08  4.24e-08  7.67e-08  7.35e-07  1.68e-07  7.27e-07   erg/cm2
Peak flux      CPL   2.70e-01  5.09e-01  5.43e-01  3.71e-01  1.54e+00  1.69e+00   ph/cm2/s
      90%_error_low -1.57e-01 -1.48e-01 -1.27e-01 -3.71e-01 -3.46e-01 -4.39e-01   ph/cm2/s
      90%_error_hi   1.01e-01  1.49e-01  1.32e-01  6.40e-01  3.53e-01  7.34e-01   ph/cm2/s

======================================================================
Image
Pre-slew 15.0-350.0 keV image (Event data)
#   RAcent    DECcent   POSerr    Theta     Phi              Peak Cts       SNR   Name
  300.3106   -28.0556   0.0130    29.7794   112.8747         3.1830718     14.814 TRIG_01062336

Foreground time interval of the image:
 -0.780  25.496 (delta_t =  26.276 [sec])
Background time interval of the image:
-17.299  -0.780 (delta_t =  16.519 [sec])
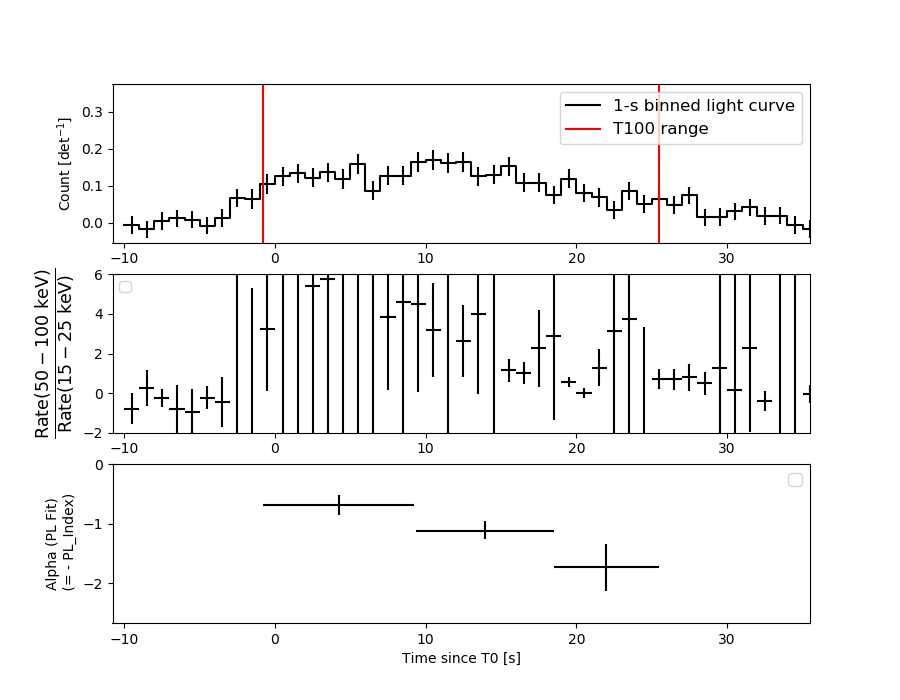
Light Curves
Note: The mask-weighted lightcurves have units of either count/det or counts/sec/det, where a det is 0.4 x 0.4 = 0.16 sq cm.
Full-time range; 1 s binning
Other quick-look light curves:
- 64 ms binning (zoomed)
- 16 ms binning (zoomed)
- 8 ms binning (zoomed)
- 2 ms binning (zoomed)
- SN=5 or 10 s binning (full-time range)
- Raw light curve
Spectra
- 64 ms binning (zoomed)
- 16 ms binning (zoomed)
- 8 ms binning (zoomed)
- 2 ms binning (zoomed)
- SN=5 or 10 s binning (full-time range)
- Raw light curve
Spectra
Notes:
- 1) The fitting includes the systematic errors.
- 2) When the burst includes telescope slew time periods, the fitting uses an average response file made from multiple 5-s response files through out the slew time plus single time preiod for the non-slew times, and weighted by the total counts in the corresponding time period using addrmf. An average response file is needed becuase a spectral fit using the pre-slew DRM will introduce some errors in both a spectral shape and a normalization if the PHA file contains a lot of the slew/post-slew time interval.
- 3) For fits to more complicated models (e.g. a power-law over a cutoff power-law), the BAT team has decided to require a chi-square improvement of more than 6 for each extra dof.
Time averaged spectrum fit using the average DRM
Power-law model
Time interval is from   -0.780 sec. to   25.496 sec.

Spectral model in power-law:
------------------------------------------------------------
Parameters  : value       lower 90%   higher 90%
Photon index: -1.01115     ( -0.108505   0.111184 )
Norm@50keV  : 8.37368E-03    ( -0.000554792   0.000552079 )
------------------------------------------------------------
#Fit statistic  : Chi-Squared                   67.96     using 59 bins.
 Reduced chi-squared = 1.19228
# Null hypothesis probability of 1.52e-01 with 57 degrees of freedom

Photon flux (15-150 keV)    in 26.28 sec: 0.964643 ( -0.065708  0.066027 ) ph/cm2/s
Energy fluence (15-150 keV)             : 2.37053e-06 ( -1.54756e-07  1.55191e-07 ) ergs/cm2
Cutoff power-law model
Time interval is from   -0.780 sec. to   25.496 sec.
Spectral model in the cutoff power-law:
------------------------------------------------------------
Parameters  : value       lower 90%   higher 90%
Photon index: 0.248924     ( -0.552825   0.635167 )
Epeak [keV] : 106.543      ( -17.0036 36.585 )
Norm@50keV  : 2.82316E-02    ( -0.0113646   0.0220546 )
------------------------------------------------------------
#Fit statistic  : Chi-Squared                   50.28     using 59 bins.
 Reduced chi-squared = 0.897857
# Null hypothesis probability of 6.90e-01 with 56 degrees of freedom

Photon flux (15-150 keV)    in 26.28 sec: 0.905799 ( -0.069365  0.069868 ) ph/cm2/s
Energy fluence (15-150 keV)             : 2.24448e-06 ( -1.682e-07  1.67678e-07 ) ergs/cm2
1-s peak spectrum fit
Power-law model
Time interval is from   11.280 sec. to   12.280 sec.

Spectral model in power-law:
------------------------------------------------------------
Parameters  : value       lower 90%   higher 90%
Photon index: -1.0125     ( -0.325192   0.353015 )
Norm@50keV  : 1.39483E-02    ( -0.00290277   0.00286056 )
------------------------------------------------------------
#Fit statistic  : Chi-Squared                   51.79     using 59 bins.
 Reduced chi-squared = 0.908596
# Null hypothesis probability of 6.70e-01 with 57 degrees of freedom

Photon flux (15-150 keV)    in 1 sec: 1.60699 ( -0.33943  0.34336 ) ph/cm2/s
Energy fluence (15-150 keV)             : 1.50183e-07 ( -3.06824e-08  3.08051e-08 ) ergs/cm2
Cutoff power-law model
Time interval is from   11.280 sec. to   12.280 sec.
Spectral model in the cutoff power-law:
------------------------------------------------------------
Parameters  : value       lower 90%   higher 90%
Photon index: 0.049304     ( -1.20019   1.93904 )
Epeak [keV] : 111.751      ( -40.6356 -111.751 )
Norm@50keV  : 4.07843E-02    ( -0.0407842   0.214433 )
------------------------------------------------------------
#Fit statistic  : Chi-Squared                   50.16     using 59 bins.
 Reduced chi-squared = 0.895714
# Null hypothesis probability of 6.94e-01 with 56 degrees of freedom

Photon flux (15-150 keV)    in 1 sec: 1.54424 ( -0.34605  0.35254 ) ph/cm2/s
Energy fluence (15-150 keV)             : 1.43777e-07 ( -3.26985e-08  3.24449e-08 ) ergs/cm2
Time-resolved spectra
Distribution
T90 vs. Hardness ratio plot
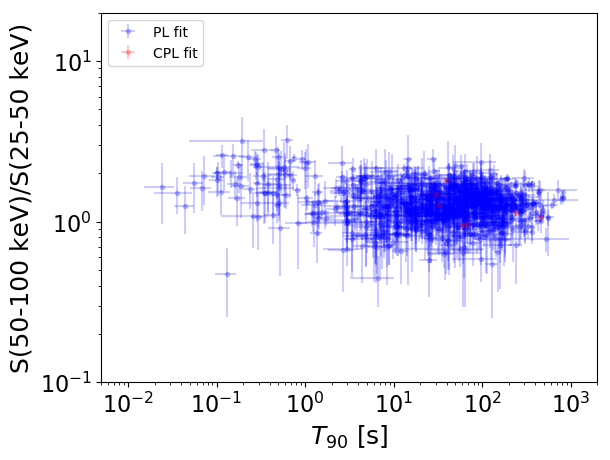
T90                                   = N/A sec.
Hardness ratio (energy fluence ratio) = N/A
S(15-50 keV) vs. S(50-150 keV) plot
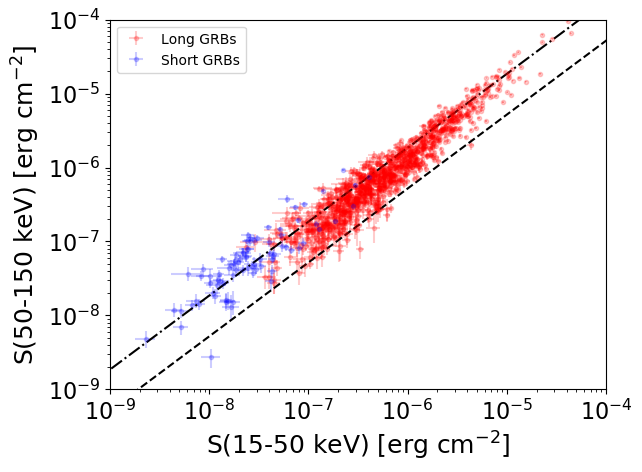
S(15-50 keV)  = N/A
S(50-150 keV) = N/A
The dash-dotted line and the dashed line traces the fluences calculated from the Band function with Epeak = 15 and 150 keV, respectively. Both lines assume a canonical values of alpha = -1 and beta = -2.5.
Mask shadow pattern
IMX = -2.224347900185051E-01, IMY = -5.272262623408568E-01
Spacecraft aspect plot
Bright source in the pre-burst/pre-slew/post-slew images
Pre-burst image of 15-350 keV band
Time interval of the image:
-17.299400 -0.780000

# RAcent  DECcent POSerr Theta    Phi  PeakCts   SNR AngSep     Name
#  [deg]    [deg]    ['] [deg]  [deg]                   [']
245.0286 -15.6260    0.8  23.8  -44.2   1.0822  14.9    3.0	Sco X-1
256.1980 -37.9638    2.9  12.4 -123.1   0.2415   3.9   12.3	4U 1700-377
256.5922 -36.4602    3.5  11.1 -118.6   0.2022   3.3    7.9	GX 349+2
262.8915 -24.9287    0.0   5.1  -22.2   0.0260   0.4   12.7	GX 1+4
264.5729 -44.3273   34.9  15.4 -158.9   0.0192   0.3   10.4	4U 1735-44
268.5482  -1.5584    0.0  27.5   21.0   0.1343   1.8   12.5	SW J1753.5-0127
270.1102 -25.0792   67.6   5.1   57.7  -0.0105  -0.2    9.5	GX 5-1
270.3510 -25.7624  129.1   4.8   65.0   0.0055   0.1    2.9	GRS 1758-258
274.0392 -14.1724 2517.1  16.4   43.5  -0.0002  -0.0    8.4	GX 17+2
276.0254 -30.1737    0.0   8.5  116.9  -0.0819  -1.3   12.7	H1820-303
285.2513 -24.9871    0.0  17.3   97.4   0.0341   0.5   12.4	HT1900.1-2455
288.7814  10.8381    4.4  45.3   48.1  -0.6560  -2.6    6.5	GRS 1915+105
262.8717 -33.7053   35.2   5.6 -132.4   0.0205   0.3    9.7	GX 354-0
282.7521  14.0163    2.0  45.8   38.7   1.0354   5.7 ------	UNKNOWN
303.0898 -81.5334    2.4  54.4 -169.9   0.9141   4.9 ------	UNKNOWN
221.7301 -13.7908    2.5  43.9  -63.3   1.1653   4.7 ------	UNKNOWN
Pre-slew background subtracted image of 15-350 keV band
Time interval of the image:
-0.780000 25.496000

# RAcent  DECcent POSerr Theta    Phi  PeakCts   SNR AngSep     Name
#  [deg]    [deg]    ['] [deg]  [deg]                   [']
244.9531 -15.7143    3.3  23.7  -44.4   0.4856   3.5    4.7	Sco X-1
255.8419 -37.7903    4.3  12.4 -121.8   0.3244   2.7    7.6	4U 1700-377
256.6526 -36.5411    7.8  11.1 -119.3  -0.1776  -1.5   12.6	GX 349+2
262.8467 -24.7727    9.6   5.2  -21.0   0.1417   1.2    9.0	GX 1+4
264.6303 -44.4378    4.3  15.5 -159.2  -0.3073  -2.7    4.9	4U 1735-44
268.5296  -1.5633    6.8  27.5   21.1  -0.2685  -1.7   11.7	SW J1753.5-0127
270.4717 -25.1159    4.5   5.3   61.1  -0.3133  -2.6   10.4	GX 5-1
270.3832 -25.8767    6.2   4.7   66.7  -0.2258  -1.9    9.1	GRS 1758-258
274.0163 -14.1493    6.3  16.4   43.6   0.2468   1.8    6.8	GX 17+2
276.0253 -30.1736    0.0   8.5  116.8   0.2167   1.7   12.7	H1820-303
285.2513 -24.9871    0.0  17.3   97.5  -0.1137  -0.8   12.4	HT1900.1-2455
288.8651  10.9641    6.4  45.5   48.1   0.9684   1.8    4.1	GRS 1915+105
263.1323 -33.9504    2.7   5.7 -136.0  -0.5296  -4.3   10.0	GX 354-0
300.3106 -28.0556    0.8  29.8  112.9   3.1835  14.8 ------	UNKNOWN
270.0104 -44.9047    2.4  16.2 -173.1   0.5764   4.9 ------	UNKNOWN
Post-slew image of 15-350 keV band
Time interval of the image:
190.100590 423.300000

# RAcent  DECcent POSerr Theta    Phi  PeakCts   SNR AngSep     Name
#  [deg]    [deg]    ['] [deg]  [deg]                   [']
256.0712 -37.8643    7.6  38.0  -74.1 -18.9916  -1.5    4.2	4U 1700-377
256.4764 -36.5416    9.6  37.6  -72.0  15.6055   1.2    7.4	GX 349+2
262.8538 -24.7698    5.2  33.5  -50.7 -16.4750  -2.2    8.6	GX 1+4
264.9267 -44.3728    6.8  32.5  -87.2  18.4896   1.7    9.1	4U 1735-44
268.3775  -1.4184    7.0  40.5  -12.0  12.4708   1.7    2.1	SW J1753.5-0127
270.0821 -25.0273    0.0  27.1  -48.2  13.9579   2.1   11.4	GX 5-1
270.4467 -25.6822   14.2  26.6  -49.4   5.4618   0.8    8.6	GRS 1758-258
273.9330 -14.1844    5.6  28.1  -23.4 -13.4551  -2.1    9.8	GX 17+2
275.8308 -30.3581   15.2  21.4  -59.6   5.0378   0.8    4.9	H1820-303
285.1689 -25.0159   16.2  13.8  -38.3  -3.4103  -0.7    9.2	HT1900.1-2455
288.7912  11.1170    0.0  40.7   25.0  -0.2884  -0.0   10.3	GRS 1915+105
262.8609 -33.7420    5.1  32.4  -67.1 -20.2052  -2.3    8.5	GX 354-0
300.8581  14.1389    3.4  42.2   43.3  36.1607   3.4 ------	UNKNOWN
327.7990 -24.4993    2.6  24.9  130.6  24.8964   4.4 ------	UNKNOWN
267.2446  13.0680    2.8  52.1    0.2  48.0326   4.1 ------	UNKNOWN
262.7807  10.6194    2.7  53.0   -6.0  55.5230   4.3 ------	UNKNOWN
259.7651 -52.2321    3.1  38.5  -97.8  65.9333   3.7 ------	UNKNOWN