Analysis Summary
Notes:
- 1) No attempt has been made to eliminate the non-significant decimal places.
- 2) This batgrbproduct analysis is done using the HEASARC data.
- 3) This batgrbproduct analysis is using the flight position for the mask-weighting calculation.
======================================================================
                  BAT GRB EVENT DATA PROCESSING REPORT
    Process Script Ver: batgrbproduct v2.48
    Process Start Time: Fri Jul 29 22:34:12 EDT 2022
             Host Name: batproc1
   Current Working Dir: /local/data/bat1/alien/Swift_3rdBATcatalog/event/batevent_reproc/trigger1064221
======================================================================

  Trigger: 01064221      Segment: 000

  BAT Trigger Time: 650023448   [s; MET]
      Trigger Stop: 650023560   [s; MET]
               UTC: 2021-08-07T10:03:40.494060    [includes UTCF correction]
       Where From?: TDRSS position message

  BAT
    RA: 76.6773872559415   Dec: 58.2452268281704  [deg; J2000]

     Catalogged Source?: NO
     Point Source?:      YES
     GRB Indicated?:     YES    [ by BAT flight software ]
     Image S/N Ratio:    12.28
     Image Trigger?:     YES
     Rate S/N Ratio:     0  [ if not an image trigger ]
     Image S/N Ratio:    12.28

  Analysis Position:   [ source = BAT ]
    RA: 76.6773872559415   Dec: 58.2452268281704  [deg; J2000]

  Refined Position:   [ source = BAT pre-slew burst ]
    RA: 76.7173235115483   Dec: 58.2595832256889  [deg; J2000]
        { 05h 06m 52.2s , +58d 15' 34.5" }
         +/- 2.661542925371 [arcmin] (estimated 90% radius based on SNR)
         +/- 1.22023049267872 [arcmin] (formal 1-sigma fit error)
    SNR: 7.5125062178386

  Angular difference between the analysis and refined position is 1.526970 arcmin

  Partial Coding Fraction: 0.28125    [ including projection effects ]

  Duration
     T90: 143.664000034332 +/- 45.6177621579512
        Measured from: 15.1599999666214
                   to: 158.824000000954     [s; relative to TRIGTIME]
     T50: 62.1599999666214 +/- 5.15888353618346
        Measured from: 72.2480000257492
                   to: 134.407999992371     [s; relative to TRIGTIME]


  Fluence
     Peak Flux  (peak 1 second)
        Measured from: 70.5240000486374
                   to: 71.5240000486374     [s; relative to TRIGTIME]
     Total Fluence
        Measured from: -9.44799995422363
                   to: 170.968000054359     [s; relative to TRIGTIME]

             Band 1     Band 2     Band 3     Band 4
              15-25      25-50     50-100    100-350     keV
 Total     2.126463   3.878168   4.038354   1.822641
           0.157738   0.165909   0.150414   0.131000 [error]
 Peak      0.046485   0.040886   0.108815   0.053549
           0.012805   0.014727   0.013785   0.011853 [error]

     [ fluence units of on-axis counts / fully illuminated detector ]

======================================================================


====== Table of the duration information =============================

        Value   tstart    tstop
T100  180.416   -9.448  170.968
T90   143.664   15.160  158.824
T50    62.160   72.248  134.408
Peak    1.000   70.524   71.524


====== Spectral Analysis Summary =====================================

Model      : spectral model: simple power-law (PL) and cutoff power-law (CPL)
Ph_index   : photon index: E^{Ph_index}
Ph_90err   : 90% error of the photon index
Epeak      : Epeak in keV
Epeak_90err: 90% error of Epeak
Norm       : normalization at 50 keV in both the PL model and CPL model
Nomr_90err : 90% error of the normalization
chi2       : Chi-Squared
dof        : degree of freedo

=== Time-averaged spectral analysis ===
(Best model with acceptable fit: N/A)

Model Ph_index Ph_90err_low Ph_90err_hi  Epeak  Epeak_90err_low  Epeak_90err_hi  Norm       Nomr_90err_low    Norm_90err_hi    chi2    dof
PL      -1.133    -0.076      0.077       -           -               -         4.63e-03     -2.04e-04          2.03e-04      53.420   57
CPL     -1.033    -0.134      0.316      585.119    -585.119      -585.119      5.10e-03     -6.07e-04          1.76e-03      53.100   56


=== 1-s peak spectral analysis ===
(Best model with acceptable fit: N/A)

Model Ph_index Ph_90err_low Ph_90err_hi  Epeak  Epeak_90err_low  Epeak_90err_hi  Norm       Nomr_90err_low    Norm_90err_hi    chi2    dof
PL      -0.764     -0.317     0.361       -           -               -         1.58e-02     -3.44e-03          3.25e-03      53.220   57
CPL     -0.724     -0.655     1.144     9899.820    -9899.820      -9899.820      1.58e-02     -3.26e-03          -1.58e-02      53.240   56


=== Fluence/Peak Flux Summary ===

              Model    Band1     Band2     Band3     Band4     Band5     Total
                       15-25     25-50    50-100    100-350    15-150    15-350    keV
Fluence         PL   7.57e-07  1.74e-06  3.18e-06  1.38e-05  8.64e-06  1.95e-05   erg/cm2
      90%_error_low -7.03e-08 -9.81e-08 -1.42e-07 -1.39e-06 -3.70e-07 -1.44e-06   erg/cm2
      90%_error_hi   7.29e-08  9.75e-08  1.41e-07  1.50e-06  3.70e-07  1.53e-06   erg/cm2
Peak flux       PL   3.23e-01  5.06e-01  5.96e-01  1.36e+00  1.82e+00  2.78e+00   ph/cm2/s
      90%_error_low -1.36e-01 -1.47e-01 -1.01e-01 -4.36e-01 -3.61e-01 -4.92e-01   ph/cm2/s
      90%_error_hi   1.66e-01  1.46e-01  1.01e-01  5.78e-01  3.68e-01  5.17e-01   ph/cm2/s

Fluence        CPL   7.35e-07  1.75e-06  3.22e-06  1.22e-05  8.61e-06  1.79e-05   erg/cm2
      90%_error_low -9.34e-08 -1.00e-07 -1.59e-07 -3.64e-06 -3.80e-07 -3.60e-06   erg/cm2
      90%_error_hi   8.18e-08  1.01e-07  1.83e-07  1.12e-06  3.75e-07  2.93e-06   erg/cm2
Peak flux      CPL   3.13e-01  5.03e-01  6.10e-01  1.19e+00  1.81e+00  2.75e+00   ph/cm2/s
      90%_error_low -3.13e-01 -1.66e-01 -1.13e-01 -7.15e-01 -3.85e-01 -1.06e+00   ph/cm2/s
      90%_error_hi   1.26e-01  1.50e-01  1.51e-01  7.50e-01  3.61e-01  5.06e-01   ph/cm2/s

======================================================================
Image
Pre-slew 15.0-350.0 keV image (Event data)
#   RAcent    DECcent   POSerr    Theta     Phi              Peak Cts       SNR   Name
   76.7173    58.2596   0.0255    49.3168     3.8274        17.0093023      7.513 TRIG_01064221

Foreground time interval of the image:
 -9.448 121.301 (delta_t = 130.749 [sec])
Background time interval of the image:
-11.099  -9.448 (delta_t =   1.651 [sec])
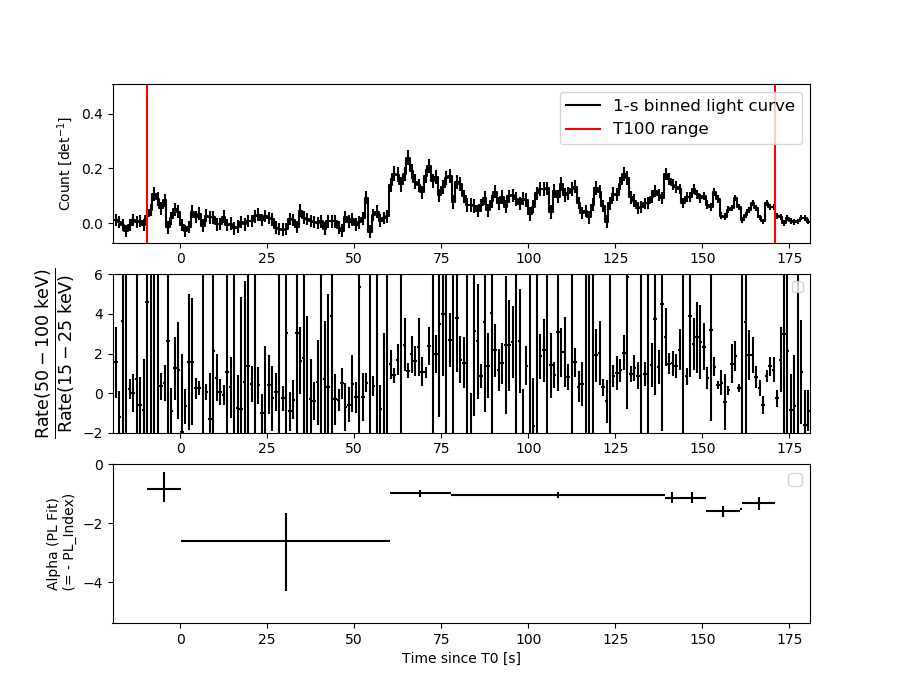
Light Curves
Note: The mask-weighted lightcurves have units of either count/det or counts/sec/det, where a det is 0.4 x 0.4 = 0.16 sq cm.
Full-time range; 1 s binning
Other quick-look light curves:
- 64 ms binning (zoomed)
- 16 ms binning (zoomed)
- 8 ms binning (zoomed)
- 2 ms binning (zoomed)
- SN=5 or 10 s binning (full-time range)
- Raw light curve
Spectra
- 64 ms binning (zoomed)
- 16 ms binning (zoomed)
- 8 ms binning (zoomed)
- 2 ms binning (zoomed)
- SN=5 or 10 s binning (full-time range)
- Raw light curve
Spectra
Notes:
- 1) The fitting includes the systematic errors.
- 2) When the burst includes telescope slew time periods, the fitting uses an average response file made from multiple 5-s response files through out the slew time plus single time preiod for the non-slew times, and weighted by the total counts in the corresponding time period using addrmf. An average response file is needed becuase a spectral fit using the pre-slew DRM will introduce some errors in both a spectral shape and a normalization if the PHA file contains a lot of the slew/post-slew time interval.
- 3) For fits to more complicated models (e.g. a power-law over a cutoff power-law), the BAT team has decided to require a chi-square improvement of more than 6 for each extra dof.
Time averaged spectrum fit using the average DRM
Power-law model
Time interval is from   -9.448 sec. to  170.968 sec.

Spectral model in power-law:
------------------------------------------------------------
Parameters  : value       lower 90%   higher 90%
Photon index: -1.13343     ( -0.0762066   0.0773062 )
Norm@50keV  : 4.62820E-03    ( -0.000203613   0.000202747 )
------------------------------------------------------------
#Fit statistic  : Chi-Squared                   53.42     using 59 bins.
 Reduced chi-squared = 0.937193
# Null hypothesis probability of 6.10e-01 with 57 degrees of freedom

Photon flux (15-150 keV)    in 180.4 sec: 0.538714 ( -0.025409  0.025509 ) ph/cm2/s
Energy fluence (15-150 keV)             : 8.63946e-06 ( -3.70206e-07  3.70365e-07 ) ergs/cm2
Cutoff power-law model
Time interval is from   -9.448 sec. to  170.968 sec.
Spectral model in the cutoff power-law:
------------------------------------------------------------
Parameters  : value       lower 90%   higher 90%
Photon index: -1.03274     ( -0.133686   0.316164 )
Epeak [keV] : 585.119      ( -586.314 -586.314 )
Norm@50keV  : 5.10088E-03    ( -0.000605712   0.00175694 )
------------------------------------------------------------
#Fit statistic  : Chi-Squared                   53.10     using 59 bins.
 Reduced chi-squared = 0.948214
# Null hypothesis probability of 5.86e-01 with 56 degrees of freedom

Photon flux (15-150 keV)    in 180.4 sec: 0.535756 ( -0.026789  0.026824 ) ph/cm2/s
Energy fluence (15-150 keV)             : 8.61284e-06 ( -3.79866e-07  3.75441e-07 ) ergs/cm2
1-s peak spectrum fit
Power-law model
Time interval is from   70.524 sec. to   71.524 sec.

Spectral model in power-law:
------------------------------------------------------------
Parameters  : value       lower 90%   higher 90%
Photon index: -0.763834     ( -0.317443   0.360923 )
Norm@50keV  : 1.58297E-02    ( -0.00343821   0.00325134 )
------------------------------------------------------------
#Fit statistic  : Chi-Squared                   53.22     using 59 bins.
 Reduced chi-squared = 0.933684
# Null hypothesis probability of 6.18e-01 with 57 degrees of freedom

Photon flux (15-150 keV)    in 1 sec: 1.82217 ( -0.36144  0.36844 ) ph/cm2/s
Energy fluence (15-150 keV)             : 1.87875e-07 ( -3.19197e-08  3.19059e-08 ) ergs/cm2
Cutoff power-law model

Time interval is from   70.524 sec. to   71.524 sec.
Spectral model in the cutoff power-law:
------------------------------------------------------------
Parameters  : value       lower 90%   higher 90%
Photon index: -0.755175     ( -0.65528   1.14402 )
Epeak [keV] : 10000.00      ( -10000 -10000 )
Norm@50keV  : 1.59436E-02    ( -0.00345108   -0.0159436 )
------------------------------------------------------------
#Fit statistic  : Chi-Squared                   53.22     using 59 bins.
 Reduced chi-squared = 0.950357
# Null hypothesis probability of 5.81e-01 with 56 degrees of freedom

Photon flux (15-150 keV)    in 1 sec: 1.80599 ( -0.38496  0.36071 ) ph/cm2/s
Energy fluence (15-150 keV)             : 1.87655e-07 ( -3.20907e-08  3.19893e-08 ) ergs/cm2
Time-resolved spectra
Distribution
T90 vs. Hardness ratio plot
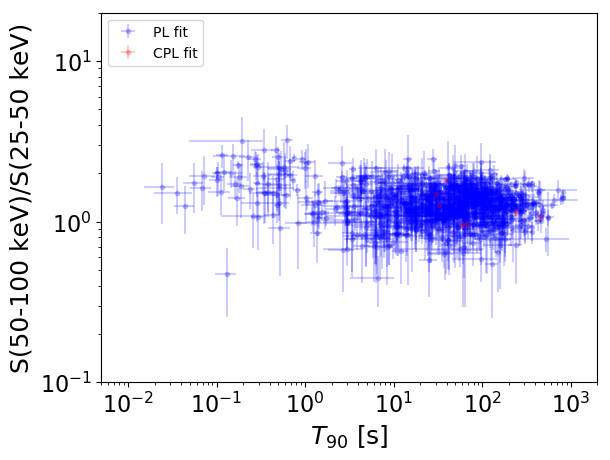
T90                                   = N/A sec.
Hardness ratio (energy fluence ratio) = N/A
S(15-50 keV) vs. S(50-150 keV) plot
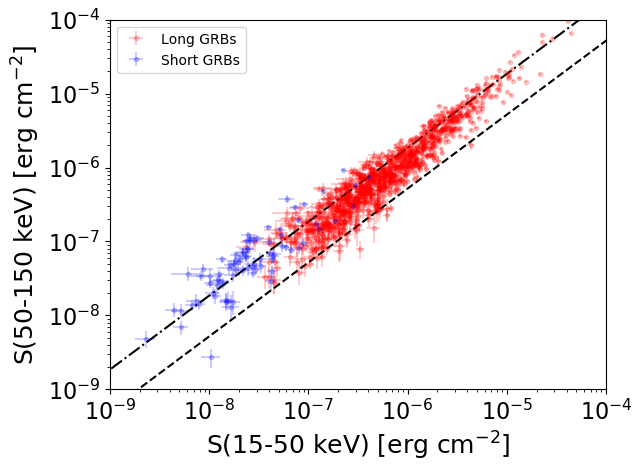
S(15-50 keV)  = N/A
S(50-150 keV) = N/A
The dash-dotted line and the dashed line traces the fluences calculated from the Band function with Epeak = 15 and 150 keV, respectively. Both lines assume a canonical values of alpha = -1 and beta = -2.5.
Mask shadow pattern
IMX = 1.160703420316407E+00, IMY = -7.765187250656860E-02
Spacecraft aspect plot
Bright source in the pre-burst/pre-slew/post-slew images
Pre-burst image of 15-350 keV band
Time interval of the image:
-11.099410 -9.448000

# RAcent  DECcent POSerr Theta    Phi  PeakCts   SNR AngSep     Name
#  [deg]    [deg]    ['] [deg]  [deg]                   [']
239.6778  68.7333    2.0  29.4   87.5   0.1202   5.7 ------	UNKNOWN
119.8248  30.0539    2.8  47.9  -51.2   0.2726   4.2 ------	UNKNOWN
148.4250  21.7630    2.6  40.9  -88.9   0.2246   4.4 ------	UNKNOWN
Pre-slew background subtracted image of 15-350 keV band
Time interval of the image:
-9.448000 121.300600

# RAcent  DECcent POSerr Theta    Phi  PeakCts   SNR AngSep     Name
#  [deg]    [deg]    ['] [deg]  [deg]                   [']
177.6206  69.8889    2.4  13.5   46.2   5.1837   4.8 ------	UNKNOWN
 76.7173  58.2596    1.5  49.3    3.8  17.0140   7.5 ------	UNKNOWN
 84.1320  42.3141    3.1  57.8  -14.0  17.3356   3.7 ------	UNKNOWN
Post-slew image of 15-350 keV band
Time interval of the image:
190.700600 697.400620

# RAcent  DECcent POSerr Theta    Phi  PeakCts   SNR AngSep     Name
#  [deg]    [deg]    ['] [deg]  [deg]                   [']
 83.6323  22.0170    0.4  36.5  -27.2  20.5930  32.8    0.2	Crab
 44.1117  48.7028    2.6  21.3   61.4   2.2407   4.5 ------	UNKNOWN
218.9646  76.6809    3.8  43.0  175.5   2.6408   3.1 ------	UNKNOWN
 62.1238   9.8364    3.0  49.6    2.6   3.5704   3.8 ------	UNKNOWN
 76.5556  58.2646    2.0   0.1  106.1   2.4386   5.7 ------	UNKNOWN