Analysis Summary
Notes:
- 1) No attempt has been made to eliminate the non-significant decimal places.
- 2) This batgrbproduct analysis is done using the HEASARC data.
- 3) This batgrbproduct analysis is using the flight position for the mask-weighting calculation.
======================================================================
                  BAT GRB EVENT DATA PROCESSING REPORT
    Process Script Ver: batgrbproduct v2.48
    Process Start Time: Fri Jul 29 22:31:29 EDT 2022
             Host Name: batproc1
   Current Working Dir: /local/data/bat1/alien/Swift_3rdBATcatalog/event/batevent_reproc/trigger1064421
======================================================================

  Trigger: 01064421      Segment: 000

  BAT Trigger Time: 650069856   [s; MET]
      Trigger Stop: 650069944   [s; MET]
               UTC: 2021-08-07T22:57:08.490960    [includes UTCF correction]
       Where From?: TDRSS position message

  BAT
    RA: 143.55062714072   Dec: -51.4089533078798  [deg; J2000]

     Catalogged Source?: NO
     Point Source?:      YES
     GRB Indicated?:     YES    [ by BAT flight software ]
     Image S/N Ratio:    19.28
     Image Trigger?:     YES
     Rate S/N Ratio:     0  [ if not an image trigger ]
     Image S/N Ratio:    19.28

  Analysis Position:   [ source = BAT ]
    RA: 143.55062714072   Dec: -51.4089533078798  [deg; J2000]

  Refined Position:   [ source = BAT pre-slew burst ]
    RA: 143.540327543634   Dec: -51.4091193162504  [deg; J2000]
        { 09h 34m 09.7s , -51d 24' 32.8" }
         +/- 1.00344536502634 [arcmin] (estimated 90% radius based on SNR)
         +/- 0.415408455740732 [arcmin] (formal 1-sigma fit error)
    SNR: 30.2680524715879

  Angular difference between the analysis and refined position is 0.385595 arcmin

  Partial Coding Fraction: 0.203125    [ including projection effects ]

  Duration
     T90: 89.9719998836517 +/- 6.25575875610908
        Measured from: -27.2319999933243
                   to: 62.7399998903275     [s; relative to TRIGTIME]
     T50: 44.9959999322891 +/- 3.2013647152701
        Measured from: -17.0599999427795
                   to: 27.9359999895096     [s; relative to TRIGTIME]


  Fluence
     Peak Flux  (peak 1 second)
        Measured from: -24.2239999771118
                   to: -23.2239999771118     [s; relative to TRIGTIME]
     Total Fluence
        Measured from: -31.3600000143051
                   to: 78.567999958992     [s; relative to TRIGTIME]

             Band 1     Band 2     Band 3     Band 4
              15-25      25-50     50-100    100-350     keV
 Total     4.397756   6.501672   4.933653   1.182200
           0.178077   0.187677   0.168393   0.147835 [error]
 Peak      0.110342   0.136057   0.174820   0.053133
           0.021201   0.023676   0.022788   0.018120 [error]

     [ fluence units of on-axis counts / fully illuminated detector ]

======================================================================


====== Table of the duration information =============================

        Value   tstart    tstop
T100  109.928  -31.360   78.568
T90    89.972  -27.232   62.740
T50    44.996  -17.060   27.936
Peak    1.000  -24.224  -23.224


====== Spectral Analysis Summary =====================================

Model      : spectral model: simple power-law (PL) and cutoff power-law (CPL)
Ph_index   : photon index: E^{Ph_index}
Ph_90err   : 90% error of the photon index
Epeak      : Epeak in keV
Epeak_90err: 90% error of Epeak
Norm       : normalization at 50 keV in both the PL model and CPL model
Nomr_90err : 90% error of the normalization
chi2       : Chi-Squared
dof        : degree of freedo

=== Time-averaged spectral analysis ===
(Best model with acceptable fit: N/A)

Model Ph_index Ph_90err_low Ph_90err_hi  Epeak  Epeak_90err_low  Epeak_90err_hi  Norm       Nomr_90err_low    Norm_90err_hi    chi2    dof
PL      -1.657    -0.063      0.063       -           -               -         1.17e-02     -4.06e-04          4.06e-04      62.180   57
CPL     -1.370    -0.253      0.268      118.953     -33.049       376.907      1.59e-02     -3.71e-03          5.17e-03      58.410   56


=== 1-s peak spectral analysis ===
(Best model with acceptable fit: N/A)

Model Ph_index Ph_90err_low Ph_90err_hi  Epeak  Epeak_90err_low  Epeak_90err_hi  Norm       Nomr_90err_low    Norm_90err_hi    chi2    dof
PL      -1.516     -0.283     0.276       -           -               -         3.26e-02     -5.21e-03          5.19e-03      60.470   57
CPL     -1.485     -2.568     0.951      898.236    -898.236      -898.236      3.38e-02     -6.32e-03          -3.38e-02      60.500   56


=== Fluence/Peak Flux Summary ===

              Model    Band1     Band2     Band3     Band4     Band5     Total
                       15-25     25-50    50-100    100-350    15-150    15-350    keV
Fluence         PL   1.90e-06  3.18e-06  4.03e-06  1.02e-05  1.20e-05  1.93e-05   erg/cm2
      90%_error_low -1.23e-07 -1.23e-07 -1.75e-07 -9.51e-07 -4.28e-07 -1.07e-06   erg/cm2
      90%_error_hi   1.27e-07  1.23e-07  1.74e-07  1.01e-06  4.28e-07  1.11e-06   erg/cm2
Peak flux       PL   1.36e+00  1.36e+00  9.50e-01  1.05e+00  4.09e+00  4.72e+00   ph/cm2/s
      90%_error_low -3.76e-01 -2.43e-01 -1.87e-01 -3.74e-01 -6.81e-01 -7.48e-01   ph/cm2/s
      90%_error_hi   4.11e-01  2.38e-01  1.82e-01  4.71e-01  6.85e-01  7.49e-01   ph/cm2/s

Fluence        CPL   1.78e-06  3.24e-06  4.14e-06  7.10e-06  1.18e-05  1.63e-05   erg/cm2
      90%_error_low -1.58e-07 -1.36e-07 -1.98e-07 -1.87e-06 -4.64e-07 -1.91e-06   erg/cm2
      90%_error_hi   1.62e-07  1.37e-07  2.00e-07  2.70e-06  4.62e-07  2.70e-06   erg/cm2
Peak flux      CPL   1.40e+00  1.34e+00  9.33e-01  1.05e+00  4.11e+00  4.87e+00   ph/cm2/s
      90%_error_low     N/A       N/A   -2.19e-01     N/A       N/A   -1.33e+00   ph/cm2/s
      90%_error_hi      N/A       N/A    2.85e-01     N/A       N/A    7.10e-01   ph/cm2/s

======================================================================
Image
Pre-slew 15.0-350.0 keV image (Event data)

#   RAcent    DECcent   POSerr    Theta     Phi              Peak Cts       SNR   Name
  143.5403   -51.4091   0.0064    50.8200  -150.6191        13.2219866     30.268 TRIG_01064421

Foreground time interval of the image:
-14.299  78.568 (delta_t =  92.867 [sec])
Background time interval of the image:
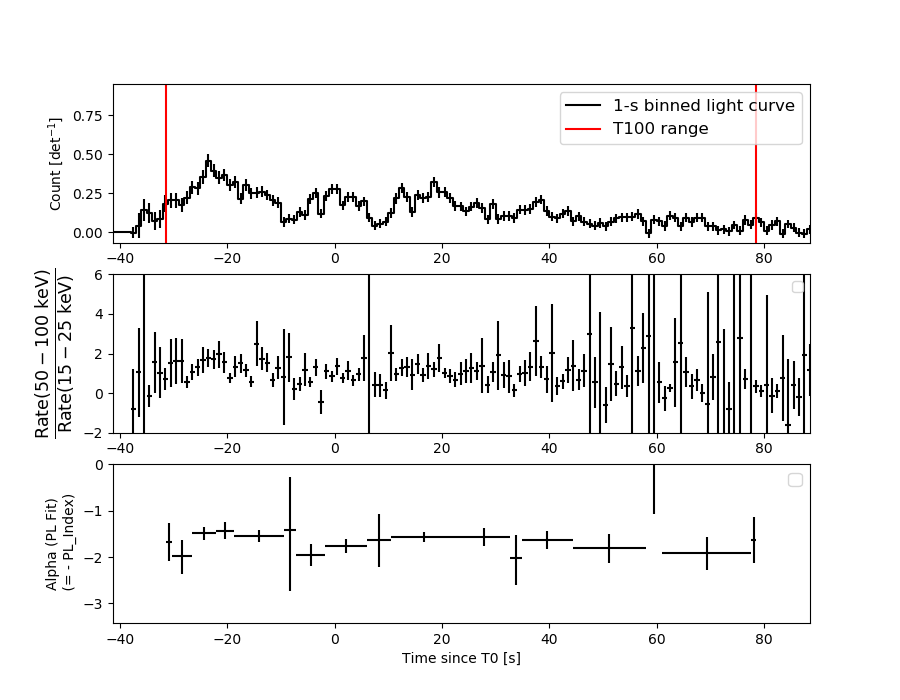
Light Curves
Note: The mask-weighted lightcurves have units of either count/det or counts/sec/det, where a det is 0.4 x 0.4 = 0.16 sq cm.
Full-time range; 1 s binning
Other quick-look light curves:
- 64 ms binning (zoomed)
- 16 ms binning (zoomed)
- 8 ms binning (zoomed)
- 2 ms binning (zoomed)
- SN=5 or 10 s binning (full-time range)
- Raw light curve
Spectra
- 64 ms binning (zoomed)
- 16 ms binning (zoomed)
- 8 ms binning (zoomed)
- 2 ms binning (zoomed)
- SN=5 or 10 s binning (full-time range)
- Raw light curve
Spectra
Notes:
- 1) The fitting includes the systematic errors.
- 2) When the burst includes telescope slew time periods, the fitting uses an average response file made from multiple 5-s response files through out the slew time plus single time preiod for the non-slew times, and weighted by the total counts in the corresponding time period using addrmf. An average response file is needed becuase a spectral fit using the pre-slew DRM will introduce some errors in both a spectral shape and a normalization if the PHA file contains a lot of the slew/post-slew time interval.
- 3) For fits to more complicated models (e.g. a power-law over a cutoff power-law), the BAT team has decided to require a chi-square improvement of more than 6 for each extra dof.
Time averaged spectrum fit using the average DRM
Power-law model

Time interval is from  -31.360 sec. to   78.568 sec.

Spectral model in power-law:
------------------------------------------------------------
Parameters  : value       lower 90%   higher 90%
Photon index: -1.65711     ( -0.0632785   0.0630279 )
Norm@50keV  : 1.17101E-02    ( -0.000405997   0.000405848 )
------------------------------------------------------------
#Fit statistic  : Chi-Squared                   62.18     using 59 bins.
 Reduced chi-squared = 1.09088
# Null hypothesis probability of 2.97e-01 with 57 degrees of freedom

Photon flux (15-150 keV)    in 109.9 sec: 1.53271 ( -0.05914  0.05938 ) ph/cm2/s
Energy fluence (15-150 keV)             : 1.19624e-05 ( -4.28189e-07  4.28357e-07 ) ergs/cm2
Cutoff power-law model
Time interval is from  -31.360 sec. to   78.568 sec.
Spectral model in the cutoff power-law:
------------------------------------------------------------
Parameters  : value       lower 90%   higher 90%
Photon index: -1.37034     ( -0.252537   0.267529 )
Epeak [keV] : 118.953      ( -33.0485 376.907 )
Norm@50keV  : 1.59428E-02    ( -0.0037114   0.00517238 )
------------------------------------------------------------
#Fit statistic  : Chi-Squared                   58.41     using 59 bins.
 Reduced chi-squared = 1.04304
# Null hypothesis probability of 3.87e-01 with 56 degrees of freedom

Photon flux (15-150 keV)    in 109.9 sec: 1.50221 ( -0.0643  0.06463 ) ph/cm2/s
Energy fluence (15-150 keV)             : 1.17668e-05 ( -4.6419e-07  4.62416e-07 ) ergs/cm2
1-s peak spectrum fit
Power-law model

Time interval is from  -24.224 sec. to  -23.224 sec.

Spectral model in power-law:
------------------------------------------------------------
Parameters  : value       lower 90%   higher 90%
Photon index: -1.51635     ( -0.282851   0.276246 )
Norm@50keV  : 3.25942E-02    ( -0.00521319   0.00519354 )
------------------------------------------------------------
#Fit statistic  : Chi-Squared                   60.47     using 59 bins.
 Reduced chi-squared = 1.06088
# Null hypothesis probability of 3.52e-01 with 57 degrees of freedom

Photon flux (15-150 keV)    in 1 sec: 4.08729 ( -0.68112  0.68474 ) ph/cm2/s
Energy fluence (15-150 keV)             : 3.08432e-07 ( -5.25734e-08  5.27948e-08 ) ergs/cm2
Cutoff power-law model
Time interval is from  -24.224 sec. to  -23.224 sec.
Spectral model in the cutoff power-law:
------------------------------------------------------------
Parameters  : value       lower 90%   higher 90%
Photon index: -1.51375     ( -2.56651   0.952569 )
Epeak [keV] : 1.00000E+04      ( -10000 -10000 )
Norm@50keV  : 3.26904E-02    ( -0.00523856   -0.0326911 )
------------------------------------------------------------
#Fit statistic  : Chi-Squared                   60.48     using 59 bins.
 Reduced chi-squared = 1.08
# Null hypothesis probability of 3.17e-01 with 56 degrees of freedom

Photon flux (15-150 keV)    in 1 sec: 4.10773 (    ) ph/cm2/s
Energy fluence (15-150 keV)             : 3.08852e-07 ( -5.39343e-08  4.73038e-08 ) ergs/cm2
Time-resolved spectra
Distribution
T90 vs. Hardness ratio plot

T90                                   = N/A sec.
Hardness ratio (energy fluence ratio) = N/A
S(15-50 keV) vs. S(50-150 keV) plot
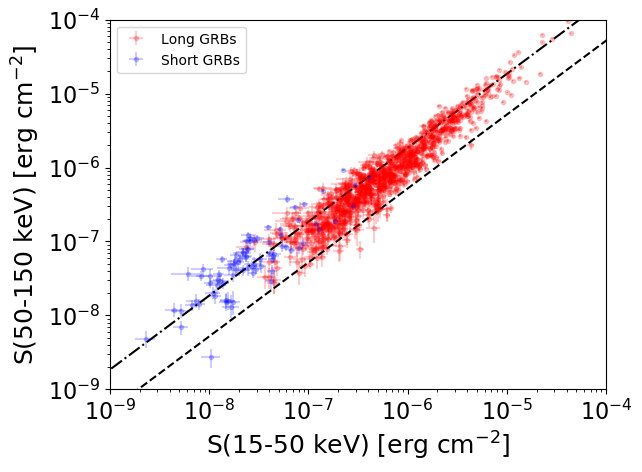
S(15-50 keV)  = N/A
S(50-150 keV) = N/A
The dash-dotted line and the dashed line traces the fluences calculated from the Band function with Epeak = 15 and 150 keV, respectively. Both lines assume a canonical values of alpha = -1 and beta = -2.5.
Mask shadow pattern

IMX = -1.069176960702829E+00, IMY = 6.019817123666598E-01
Spacecraft aspect plot

Bright source in the pre-burst/pre-slew/post-slew images
Pre-burst image of 15-350 keV band
Time interval of the image:
Pre-slew background subtracted image of 15-350 keV band
Time interval of the image:
-14.299400 78.568000

# RAcent  DECcent POSerr Theta    Phi  PeakCts   SNR AngSep     Name
#  [deg]    [deg]    ['] [deg]  [deg]                   [']
170.5024 -60.6978    3.8  38.9 -169.0   0.6005   3.0    7.1	Cen X-3
186.2983 -62.8012    5.6  35.2  179.7   0.3816   2.1   10.0	GX 301-2
244.9650 -15.6316    1.0  37.4   58.7   3.8250  11.6    1.0	Sco X-1
256.1088 -37.8268    4.0  40.6   97.4  -1.5234  -2.9    5.9	4U 1700-377
257.1389 -40.5103    2.2  41.3  101.5   2.8998   5.3 ------	UNKNOWN
241.5435 -80.2842    2.1  51.9  156.2   2.9791   5.4 ------	UNKNOWN
202.3189 -60.0677    3.3  30.0  168.2   0.5982   3.5 ------	UNKNOWN
218.0932  17.5754    2.2  49.0   -3.2   1.5167   5.3 ------	UNKNOWN
206.1004  13.2670    3.4  43.6  -18.6   0.7709   3.4 ------	UNKNOWN
141.6244 -56.3441    2.7  51.9 -156.9   1.8700   4.3 ------	UNKNOWN
143.5403 -51.4091    0.4  50.8 -150.6  13.2210  30.3 ------	UNKNOWN
187.9653  17.6718    3.1  51.5  -40.7   2.4557   3.7 ------	UNKNOWN
Post-slew image of 15-350 keV band
Time interval of the image:
166.300630 963.069700

# RAcent  DECcent POSerr Theta    Phi  PeakCts   SNR AngSep     Name
#  [deg]    [deg]    ['] [deg]  [deg]                   [']
135.5068 -40.5535    0.7  12.2 -114.5  10.5009  17.1    1.0	Vela X-1
170.3075 -60.6555    1.3  17.4   48.3   6.2429   8.7    2.0	Cen X-3
186.6728 -62.5573    0.0  25.3   48.5   0.8341   1.0   12.8	GX 301-2
 58.5518 -55.3616    2.5  47.6  145.9  10.2165   4.5 ------	UNKNOWN
211.9866 -35.0583    2.3  50.4   15.0   8.2846   5.0 ------	UNKNOWN
 73.7760 -44.2186    2.7  45.6  166.1   6.8324   4.3 ------	UNKNOWN
156.3716 -19.1304    2.6  33.8  -62.1   4.5580   4.5 ------	UNKNOWN
109.2909 -13.3169    3.3  47.1 -132.6   8.2930   3.5 ------	UNKNOWN
133.8383 -10.9348    2.8  41.3  -98.7  15.8338   4.1 ------	UNKNOWN