Analysis Summary
Notes:
- 1) No attempt has been made to eliminate the non-significant decimal places.
- 2) This batgrbproduct analysis is done using the HEASARC data.
- 3) This batgrbproduct analysis is using the flight position for the mask-weighting calculation.
======================================================================
                  BAT GRB EVENT DATA PROCESSING REPORT
    Process Script Ver: batgrbproduct v2.48
    Process Start Time: Mon Oct 24 00:43:37 EDT 2022
             Host Name: batproc1
   Current Working Dir: /local/data/bat1/alien/Swift_3rdBATcatalog/event/batevent_reproc/trigger1069169
======================================================================

  Trigger: 01069169      Segment: 000

  BAT Trigger Time: 650941355.764   [s; MET]
      Trigger Stop: 650941355.828   [s; MET]
               UTC: 2021-08-18T01:02:08.196640    [includes UTCF correction]
       Where From?: (*SHORT BURST*) TDRSS scaled map message

  BAT
    RA: 149.131388407691   Dec: -87.0315890774405  [deg; J2000]

     Catalogged Source?: NO
     Point Source?:      YES
     GRB Indicated?:     YES    [ by BAT flight software ]
     Image S/N Ratio:    9.11
     Image Trigger?:     NO
     Rate S/N Ratio:     96.4779767615387  [ if not an image trigger ]
     Image S/N Ratio:    9.11

  Analysis Position:   [ source = BAT ]
    RA: 149.131388407691   Dec: -87.0315890774405  [deg; J2000]

  Refined Position:   [ source = BAT pre-slew burst ]
    RA: 148.945138048474   Dec: -87.0293546195953  [deg; J2000]
        { 09h 55m 46.8s , -87d 01' 45.7" }
         +/- 0.480171292478529 [arcmin] (estimated 90% radius based on SNR)
         +/- 0.151994301457393 [arcmin] (formal 1-sigma fit error)
    SNR: 86.7494395053673

  Angular difference between the analysis and refined position is 0.594241 arcmin

  Partial Coding Fraction: 0.9765625    [ including projection effects ]

  Duration
     T90: 73.5599999427795 +/- 1.60419951668982
        Measured from: 1.66799998283386
                   to: 75.2279999256134     [s; relative to TRIGTIME]
     T50: 32.2759999036789 +/- 0.520999059636014
        Measured from: 9.37199997901917
                   to: 41.6479998826981     [s; relative to TRIGTIME]


  Fluence
     Peak Flux  (peak 1 second)
        Measured from: 1.19599997997284
                   to: 2.19599997997284     [s; relative to TRIGTIME]
     Total Fluence
        Measured from: -0.688000082969666
                   to: 129.043999910355     [s; relative to TRIGTIME]

             Band 1     Band 2     Band 3     Band 4
              15-25      25-50     50-100    100-350     keV
 Total     9.272668  13.665817  12.193476   4.122670
           0.086746   0.095001   0.090114   0.076836 [error]
 Peak      0.226309   0.460371   0.558132   0.252321
           0.010662   0.013942   0.015751   0.014367 [error]

     [ fluence units of on-axis counts / fully illuminated detector ]

======================================================================


====== Table of the duration information =============================

        Value   tstart    tstop
T100  129.732   -0.688  129.044
T90    73.560    1.668   75.228
T50    32.276    9.372   41.648
Peak    1.000    1.196    2.196


====== Spectral Analysis Summary =====================================

Model      : spectral model: simple power-law (PL) and cutoff power-law (CPL)
Ph_index   : photon index: E^{Ph_index}
Ph_90err   : 90% error of the photon index
Epeak      : Epeak in keV
Epeak_90err: 90% error of Epeak
Norm       : normalization at 50 keV in both the PL model and CPL model
Nomr_90err : 90% error of the normalization
chi2       : Chi-Squared
dof        : degree of freedo

=== Time-averaged spectral analysis ===
(Best model with acceptable fit: N/A)

Model Ph_index Ph_90err_low Ph_90err_hi  Epeak  Epeak_90err_low  Epeak_90err_hi  Norm       Nomr_90err_low    Norm_90err_hi    chi2    dof
PL      -1.215    -0.026      0.026       -           -               -         1.98e-02     -2.81e-04          2.80e-04      47.960   57
CPL     -1.161    -0.076     -0.022      996.594    -996.594      -996.594      2.08e-02     -1.17e-03          -6.39e-04      56.450   56


=== 1-s peak spectral analysis ===
(Best model with acceptable fit: N/A)

Model Ph_index Ph_90err_low Ph_90err_hi  Epeak  Epeak_90err_low  Epeak_90err_hi  Norm       Nomr_90err_low    Norm_90err_hi    chi2    dof
PL      -0.733     -0.061     0.062       -           -               -         9.67e-02     -3.23e-03          3.22e-03      62.650   57
CPL     -0.726     -0.061     0.063     9999.170    -9999.170      -9999.170      9.75e-02     -3.21e-03          1.24e-02      62.780   56


=== Fluence/Peak Flux Summary ===

              Model    Band1     Band2     Band3     Band4     Band5     Total
                       15-25     25-50    50-100    100-350    15-150    15-350    keV
Fluence         PL   2.51e-06  5.49e-06  9.46e-06  3.78e-05  2.59e-05  5.52e-05   erg/cm2
      90%_error_low -8.22e-08 -1.06e-07 -1.27e-07 -1.26e-06 -3.33e-07 -1.26e-06   erg/cm2
      90%_error_hi   8.35e-08  1.06e-07  1.26e-07  1.29e-06  3.33e-07  1.28e-06   erg/cm2
Peak flux       PL   1.92e+00  3.06e+00  3.68e+00  8.66e+00  1.12e+01  1.73e+01   ph/cm2/s
      90%_error_low -1.41e-01 -1.35e-01 -1.27e-01 -6.75e-01 -3.61e-01 -7.11e-01   ph/cm2/s
      90%_error_hi   1.45e-01  1.34e-01  1.26e-01  7.14e-01  3.62e-01  7.30e-01   ph/cm2/s

Fluence        CPL   2.50e-06  5.50e-06  9.37e-06  3.97e-05  2.60e-05  5.29e-05   erg/cm2
      90%_error_low -8.23e-08    N/A    -2.67e-08    N/A    -4.33e-07    N/A      erg/cm2
      90%_error_hi   8.36e-08    N/A     2.27e-07    N/A     2.32e-07    N/A      erg/cm2
Peak flux      CPL   1.89e-01  1.76e-04  6.73e-03  5.40e+00  5.17e-02  5.41e+00   ph/cm2/s
      90%_error_low -1.89e-01 -1.76e-04 -6.73e-03 -5.40e+00 -5.17e-02 -5.41e+00   ph/cm2/s
      90%_error_hi   2.63e-01  8.03e-04  9.92e-03  5.67e+00  1.03e-01  4.29e+00   ph/cm2/s

======================================================================
Image
Pre-slew 15.0-350.0 keV image (Event data)
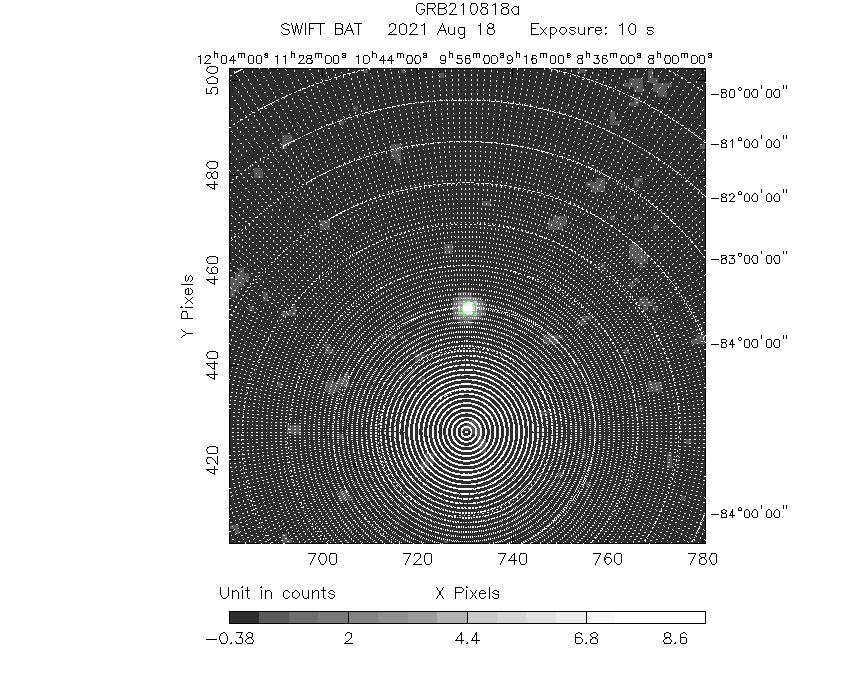
#   RAcent    DECcent   POSerr    Theta     Phi              Peak Cts       SNR   Name
  148.9451   -87.0294   0.0022    17.5998     9.3842         9.7062994     86.749 TRIG_01069169

Foreground time interval of the image:
 -0.688   9.137 (delta_t =   9.825 [sec])
Background time interval of the image:
-239.764  -0.688 (delta_t = 239.076 [sec])
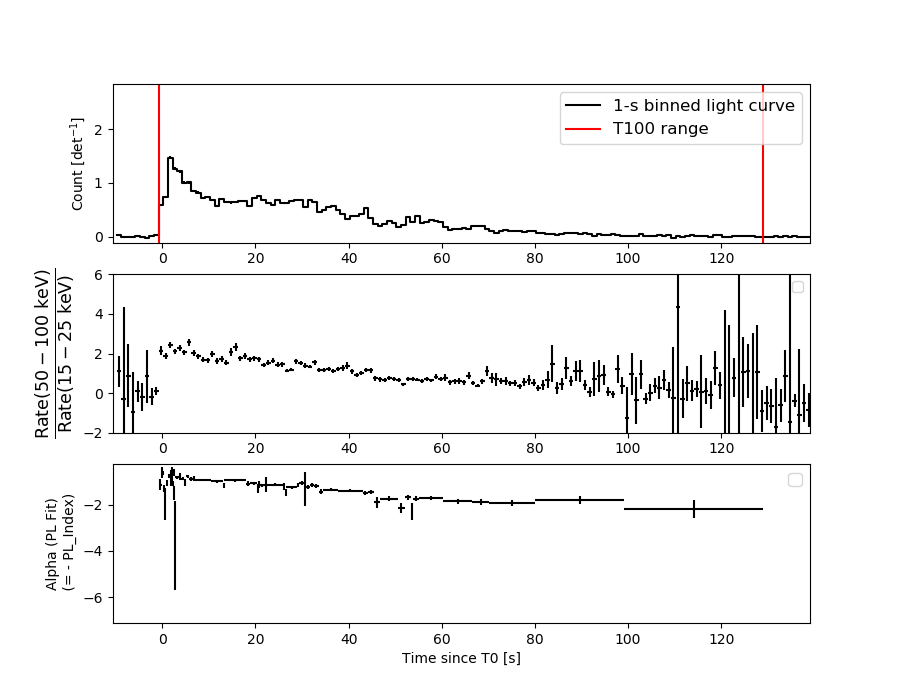
Light Curves
Note: The mask-weighted lightcurves have units of either count/det or counts/sec/det, where a det is 0.4 x 0.4 = 0.16 sq cm.
Full-time range; 1 s binning
Other quick-look light curves:
- 64 ms binning (zoomed)
- 16 ms binning (zoomed)
- 8 ms binning (zoomed)
- 2 ms binning (zoomed)
- SN=5 or 10 s binning (full-time range)
- Raw light curve
Spectra
- 64 ms binning (zoomed)
- 16 ms binning (zoomed)
- 8 ms binning (zoomed)
- 2 ms binning (zoomed)
- SN=5 or 10 s binning (full-time range)
- Raw light curve
Spectra
Notes:
- 1) The fitting includes the systematic errors.
- 2) When the burst includes telescope slew time periods, the fitting uses an average response file made from multiple 5-s response files through out the slew time plus single time preiod for the non-slew times, and weighted by the total counts in the corresponding time period using addrmf. An average response file is needed becuase a spectral fit using the pre-slew DRM will introduce some errors in both a spectral shape and a normalization if the PHA file contains a lot of the slew/post-slew time interval.
- 3) For fits to more complicated models (e.g. a power-law over a cutoff power-law), the BAT team has decided to require a chi-square improvement of more than 6 for each extra dof.
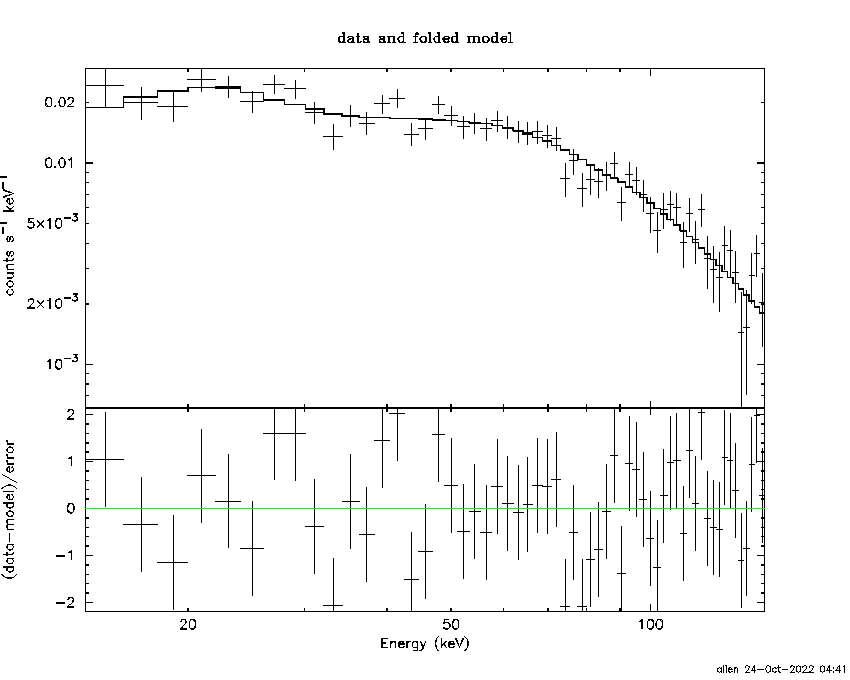
Time averaged spectrum fit using the average DRM
Power-law model
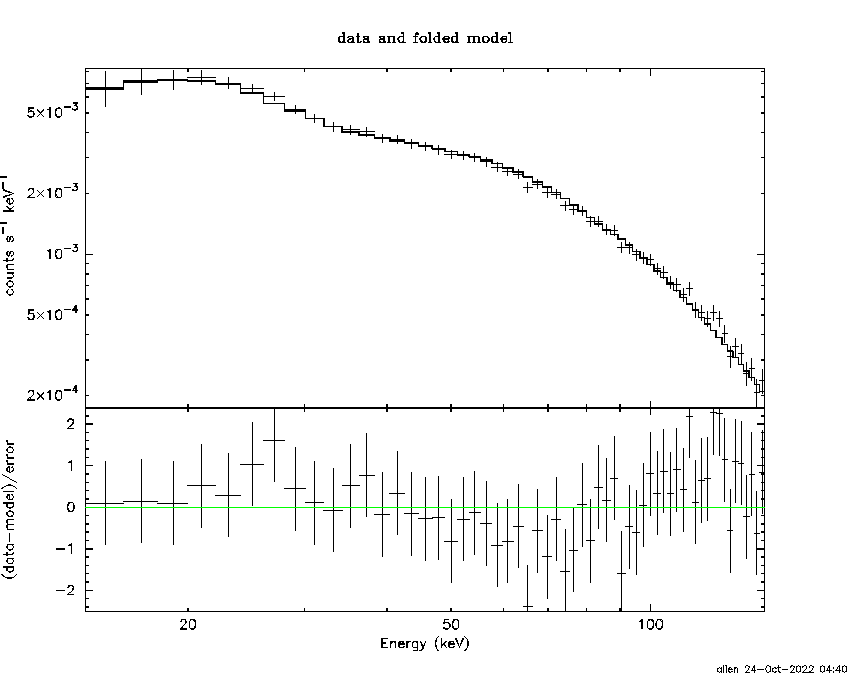
Time interval is from   -0.688 sec. to  129.044 sec.

Spectral model in power-law:
------------------------------------------------------------
Parameters  : value       lower 90%   higher 90%
Photon index: -1.21467     ( -0.026152   0.0262563 )
Norm@50keV  : 1.97727E-02    ( -0.00028093   0.000279583 )
------------------------------------------------------------
#Fit statistic  : Chi-Squared                   47.96     using 59 bins.
 Reduced chi-squared = 0.841404
# Null hypothesis probability of 7.98e-01 with 57 degrees of freedom

Photon flux (15-150 keV)    in 129.7 sec: 2.32583 ( -0.03754  0.03783 ) ph/cm2/s
Energy fluence (15-150 keV)             : 2.59143e-05 ( -3.33175e-07  3.33303e-07 ) ergs/cm2
Cutoff power-law model
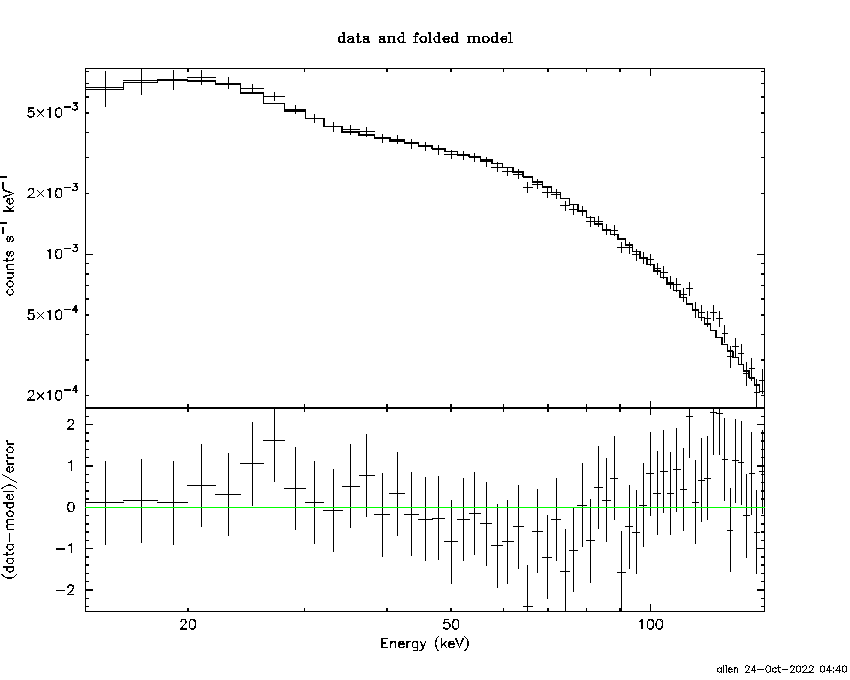
Time interval is from   -0.688 sec. to  129.044 sec.
Spectral model in the cutoff power-law:
------------------------------------------------------------
Parameters  : value       lower 90%   higher 90%
Photon index: -1.20969     ( -0.0292208   0.0241601 )
Epeak [keV] : 1.00000E+04      ( -10000 -10000 )
Norm@50keV  : 1.98632E-02    ( -0.000280598   0.000254421 )
------------------------------------------------------------
#Fit statistic  : Chi-Squared                   48.69     using 59 bins.
 Reduced chi-squared = 0.869464
# Null hypothesis probability of 7.45e-01 with 56 degrees of freedom

Photon flux (15-150 keV)    in 129.7 sec: 1.19807 ( -0.07586  0.08115 ) ph/cm2/s
Energy fluence (15-150 keV)             : 2.60087e-05 ( -4.32897e-07  2.3163e-07 ) ergs/cm2
1-s peak spectrum fit
Power-law model
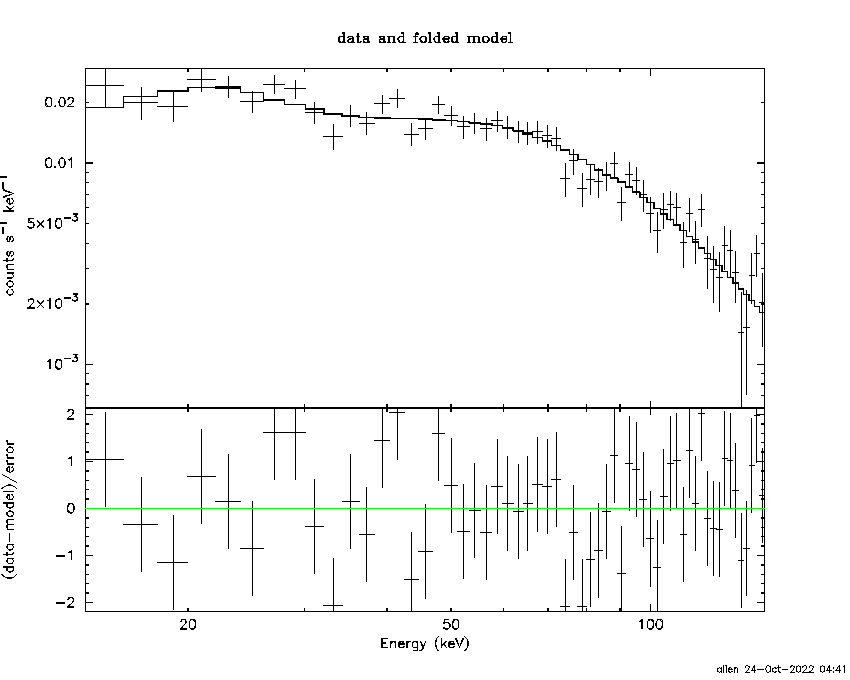
Time interval is from    1.196 sec. to    2.196 sec.

Spectral model in power-law:
------------------------------------------------------------
Parameters  : value       lower 90%   higher 90%
Photon index: -0.733085     ( -0.061079   0.0616865 )
Norm@50keV  : 9.67342E-02    ( -0.00323446   0.00321871 )
------------------------------------------------------------
#Fit statistic  : Chi-Squared                   62.65     using 59 bins.
 Reduced chi-squared = 1.09912
# Null hypothesis probability of 2.83e-01 with 57 degrees of freedom

Photon flux (15-150 keV)    in 1 sec: 11.1550 ( -0.3615  0.3617 ) ph/cm2/s
Energy fluence (15-150 keV)             : 1.16359e-06 ( -4.23205e-08  4.24452e-08 ) ergs/cm2
Cutoff power-law model
Time interval is from    1.196 sec. to    2.196 sec.
Spectral model in the cutoff power-law:
------------------------------------------------------------
Parameters  : value       lower 90%   higher 90%
Photon index: -0.726244     ( -0.060844   0.0629117 )
Epeak [keV] : 9999.17      ( -9999.28 -9999.28 )
Norm@50keV  : 9.74724E-02    ( -0.00320398   0.0123974 )
------------------------------------------------------------
#Fit statistic  : Chi-Squared                   62.78     using 59 bins.
 Reduced chi-squared = 1.12107
# Null hypothesis probability of 2.49e-01 with 56 degrees of freedom

Photon flux (15-150 keV)    in 1 sec: 5.17409E-02 ( -0.0517409  0.103378 ) ph/cm2/s
Energy fluence (15-150 keV)             : 1.16915e-06 ( -4.8371e-08  3.63855e-08 ) ergs/cm2
Time-resolved spectra
Distribution
T90 vs. Hardness ratio plot
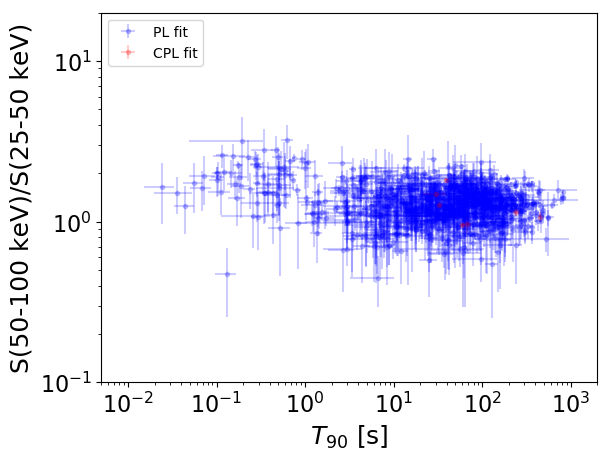
T90                                   = N/A sec.
Hardness ratio (energy fluence ratio) = N/A
S(15-50 keV) vs. S(50-150 keV) plot
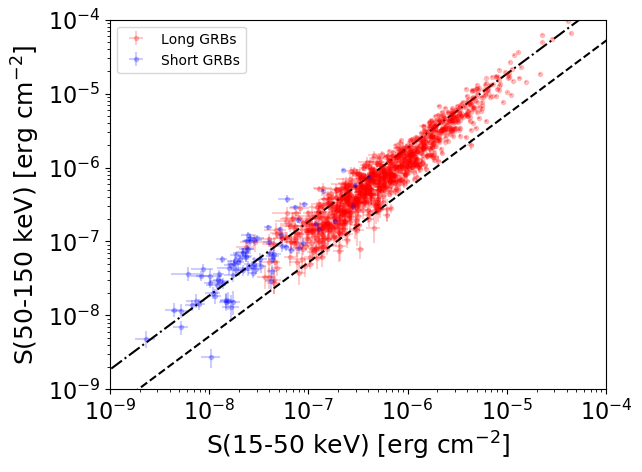
S(15-50 keV)  = N/A
S(50-150 keV) = N/A
The dash-dotted line and the dashed line traces the fluences calculated from the Band function with Epeak = 15 and 150 keV, respectively. Both lines assume a canonical values of alpha = -1 and beta = -2.5.
Mask shadow pattern
IMX = 3.129689356339096E-01, IMY = -5.172311293449179E-02
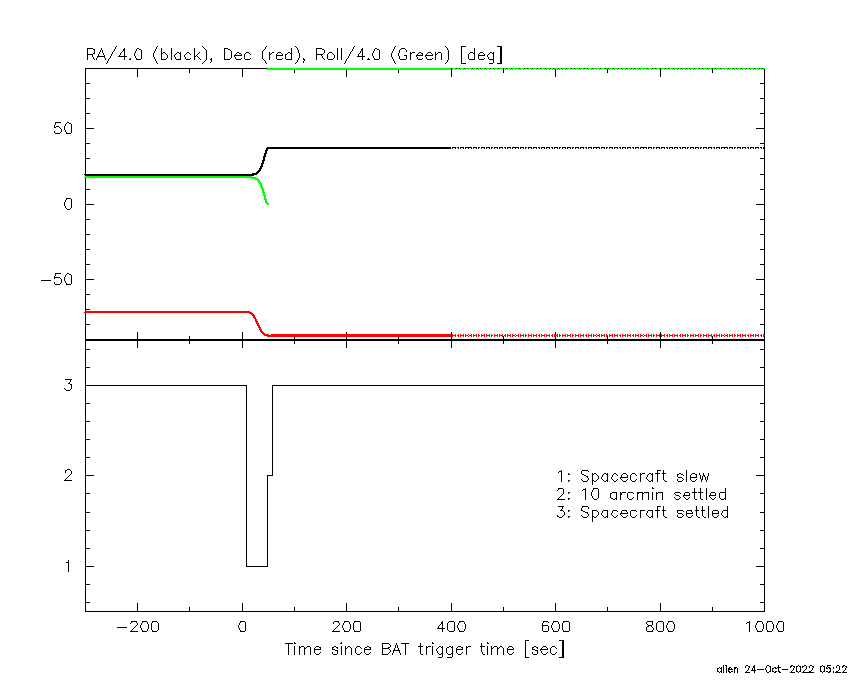
Spacecraft aspect plot
Bright source in the pre-burst/pre-slew/post-slew images
Pre-burst image of 15-350 keV band
Time interval of the image:
-239.764000 -0.688000

# RAcent  DECcent POSerr Theta    Phi  PeakCts   SNR AngSep     Name
#  [deg]    [deg]    ['] [deg]  [deg]                   [']
170.1409 -60.6253    2.7  34.9  -40.3   1.3845   4.3    5.1	Cen X-3
186.7055 -62.6155   63.7  37.3  -27.1  -0.0644  -0.2    9.4	GX 301-2
 26.8144 -34.6540    2.5  45.3  135.0   4.9730   4.6 ------	UNKNOWN
173.1466 -69.8485    2.3  28.3  -27.6   1.3566   5.0 ------	UNKNOWN
 79.9833 -14.0015    2.8  57.7 -158.6   5.3444   4.2 ------	UNKNOWN
Pre-slew background subtracted image of 15-350 keV band
Time interval of the image:
-0.688000 9.136600

# RAcent  DECcent POSerr Theta    Phi  PeakCts   SNR AngSep     Name
#  [deg]    [deg]    ['] [deg]  [deg]                   [']
170.4940 -60.4687    0.0  35.1  -40.2   0.3906   2.4   10.6	Cen X-3
186.9697 -62.7188  136.9  37.3  -26.9  -0.0137  -0.1    9.1	GX 301-2
 25.4776 -43.4424    2.3  37.5  128.6   1.3961   4.9 ------	UNKNOWN
 44.1316 -28.0545    2.2  47.3  157.3   1.7855   5.2 ------	UNKNOWN
276.2072 -68.7389    2.2  39.1   29.3   1.1000   5.3 ------	UNKNOWN
 55.6491 -82.4281    2.4  11.6   32.9   0.5134   4.7 ------	UNKNOWN
148.9451 -87.0294    0.1  17.6    9.4   9.7063  86.7 ------	UNKNOWN
199.0465 -72.8303    2.4  30.8  -10.7   0.6119   4.7 ------	UNKNOWN
 71.2248 -35.2610    2.4  36.6 -170.0   0.7181   4.8 ------	UNKNOWN
202.3256 -57.1202    1.9  45.6  -19.9   1.2711   6.2 ------	UNKNOWN
 83.5600 -33.5296    2.3  38.3 -153.3   0.8152   4.9 ------	UNKNOWN
Post-slew image of 15-350 keV band
Time interval of the image:
48.136600 962.365800

# RAcent  DECcent POSerr Theta    Phi  PeakCts   SNR AngSep     Name
#  [deg]    [deg]    ['] [deg]  [deg]                   [']
170.3096 -60.6608    2.8  26.6  -65.0   4.5965   4.1    2.3	Cen X-3
187.1199 -62.7931    0.0  24.9  -46.4  -1.7846  -2.0   12.8	GX 301-2
256.0606 -37.8384    5.2  53.1   20.8   7.6194   2.2    3.5	4U 1700-377
256.4317 -36.4258   78.8  54.5   21.0   0.6388   0.1    0.2	GX 349+2
264.9322 -44.4375   12.0  46.9   30.0  -1.9075  -1.0    8.1	4U 1735-44
307.1107 -52.6760    3.4  40.1   71.0   9.6477   3.5 ------	UNKNOWN
 27.8886 -42.3191    3.4  49.3  148.2  10.8879   3.4 ------	UNKNOWN
 34.6163 -37.6351    3.3  53.7  155.2  16.0339   3.5 ------	UNKNOWN
246.7144 -34.8392    5.4  55.6   11.3   8.4138   2.1 ------	UNKNOWN
149.5553 -87.0374    1.0   0.0   39.8   8.8477  12.0 ------	UNKNOWN
157.7259 -78.6619    3.8   8.4  -76.8   2.0599   3.1 ------	UNKNOWN
217.9650 -29.5525    3.5  59.4  -17.9  14.9604   3.3 ------	UNKNOWN
 81.7920 -34.4842    2.5  54.4 -157.6  12.9603   4.5 ------	UNKNOWN
210.2548 -34.4449    2.2  54.2  -25.3  14.2791   5.2 ------	UNKNOWN