Analysis Summary
Notes:
- 1) No attempt has been made to eliminate the non-significant decimal places.
- 2) This batgrbproduct analysis is done using the HEASARC data.
- 3) This batgrbproduct analysis is using the flight position for the mask-weighting calculation.
======================================================================
                  BAT GRB EVENT DATA PROCESSING REPORT
    Process Script Ver: batgrbproduct v2.48
    Process Start Time: Mon Oct 24 00:41:44 EDT 2022
             Host Name: batproc1
   Current Working Dir: /local/data/bat1/alien/Swift_3rdBATcatalog/event/batevent_reproc/trigger1069551
======================================================================

  Trigger: 01069551      Segment: 000

  BAT Trigger Time: 651173908.288   [s; MET]
      Trigger Stop: 651173924.672   [s; MET]
               UTC: 2021-08-20T17:38:00.705080    [includes UTCF correction]
       Where From?: TDRSS position message

  BAT
    RA: 20.6292412647972   Dec: 4.6320288630948  [deg; J2000]

     Catalogged Source?: NO
     Point Source?:      YES
     GRB Indicated?:     YES    [ by BAT flight software ]
     Image S/N Ratio:    7.81
     Image Trigger?:     NO
     Rate S/N Ratio:     8.54400374531753  [ if not an image trigger ]
     Image S/N Ratio:    7.81

  Analysis Position:   [ source = BAT ]
    RA: 20.6292412647972   Dec: 4.6320288630948  [deg; J2000]

  Refined Position:   [ source = BAT pre-slew burst ]
    RA: 20.6248078067617   Dec: 4.64680426486546  [deg; J2000]
        { 01h 22m 30.0s , +04d 38' 48.5" }
         +/- 3.53054236971341 [arcmin] (estimated 90% radius based on SNR)
         +/- 1.87938676250928 [arcmin] (formal 1-sigma fit error)
    SNR: 5.01750447916738

  Angular difference between the analysis and refined position is 0.925323 arcmin

  Partial Coding Fraction: 0.484375    [ including projection effects ]

  Duration
     T90: 151.740000009537 +/- 20.5578972184932
        Measured from: 2.55599999427795
                   to: 154.296000003815     [s; relative to TRIGTIME]
     T50: 97.0640000104904 +/- 29.6545492491494
        Measured from: 13
                   to: 110.06400001049     [s; relative to TRIGTIME]


  Fluence
     Peak Flux  (peak 1 second)
        Measured from: 10.9160000085831
                   to: 11.9160000085831     [s; relative to TRIGTIME]
     Total Fluence
        Measured from: 0.759999990463257
                   to: 160.203999996185     [s; relative to TRIGTIME]

             Band 1     Band 2     Band 3     Band 4
              15-25      25-50     50-100    100-350     keV
 Total     0.904807   1.169292   0.261529  -0.053940
           0.101732   0.105902   0.096918   0.097045 [error]
 Peak      0.051975   0.024133   0.013158   0.005917
           0.009879   0.010161   0.009042   0.008952 [error]

     [ fluence units of on-axis counts / fully illuminated detector ]

======================================================================


====== Table of the duration information =============================

        Value   tstart    tstop
T100  159.444    0.760  160.204
T90   151.740    2.556  154.296
T50    97.064   13.000  110.064
Peak    1.000   10.916   11.916


====== Spectral Analysis Summary =====================================

Model      : spectral model: simple power-law (PL) and cutoff power-law (CPL)
Ph_index   : photon index: E^{Ph_index}
Ph_90err   : 90% error of the photon index
Epeak      : Epeak in keV
Epeak_90err: 90% error of Epeak
Norm       : normalization at 50 keV in both the PL model and CPL model
Nomr_90err : 90% error of the normalization
chi2       : Chi-Squared
dof        : degree of freedo

=== Time-averaged spectral analysis ===
(Best model with acceptable fit: N/A)

Model Ph_index Ph_90err_low Ph_90err_hi  Epeak  Epeak_90err_low  Epeak_90err_hi  Norm       Nomr_90err_low    Norm_90err_hi    chi2    dof
PL      -2.097    -0.228      0.211       -           -               -         8.54e-04     -1.42e-04          1.40e-04      49.830   57
CPL      0.720    -1.356      1.790       35.805      -4.537         5.064      4.60e-02     -4.60e-02          5.54e-01      34.440   56


=== 1-s peak spectral analysis ===
(Best model with acceptable fit: N/A)

Model Ph_index Ph_90err_low Ph_90err_hi  Epeak  Epeak_90err_low  Epeak_90err_hi  Norm       Nomr_90err_low    Norm_90err_hi    chi2    dof
PL      -2.193     -0.991     0.699       -           -               -         5.04e-03     -2.83e-03          2.39e-03      71.140   57
CPL     -2.110     -0.723     0.872       47.025      N/A           N/A         4.48e-03        N/A               N/A         70.870   56


=== Fluence/Peak Flux Summary ===

              Model    Band1     Band2     Band3     Band4     Band5     Total
                       15-25     25-50    50-100    100-350    15-150    15-350    keV
Fluence         PL   3.05e-07  3.91e-07  3.65e-07  6.01e-07  1.26e-06  1.66e-06   erg/cm2
      90%_error_low -4.54e-08 -4.87e-08 -7.93e-08 -2.17e-07 -1.87e-07 -3.28e-07   erg/cm2
      90%_error_hi   4.62e-08  4.84e-08  8.33e-08  2.88e-07  1.94e-07  3.86e-07   erg/cm2
Peak flux       PL   4.06e-01  2.72e-01  1.19e-01  7.14e-02  8.31e-01  8.68e-01   ph/cm2/s
      90%_error_low -1.70e-01 -9.85e-02 -1.19e-01 -7.14e-02 -2.42e-01 -2.62e-01   ph/cm2/s
      90%_error_hi   1.74e-01  8.37e-02  8.57e-02  1.45e-01  2.42e-01  2.66e-01   ph/cm2/s

Fluence        CPL   2.61e-07  5.14e-07  2.49e-07  1.56e-08  1.04e-06  1.04e-06   erg/cm2
      90%_error_low -5.42e-08 -7.32e-08 -9.64e-08 -1.35e-08 -1.48e-07 -1.49e-07   erg/cm2
      90%_error_hi   5.37e-08  7.44e-08  1.09e-07  5.92e-08  1.68e-07  1.74e-07   erg/cm2
Peak flux      CPL   3.46e-01  2.37e-01  1.11e-01  8.70e-02  7.40e-01  7.96e-01   ph/cm2/s
      90%_error_low -1.71e-01 -2.37e-01 -1.11e-01 -8.70e-02 -5.60e-01 -6.29e-01   ph/cm2/s
      90%_error_hi   1.87e-01  3.21e-03  -1.61e-02  -2.51e-02  5.26e-02  1.73e-02   ph/cm2/s

======================================================================
Image
Pre-slew 15.0-350.0 keV image (Event data)
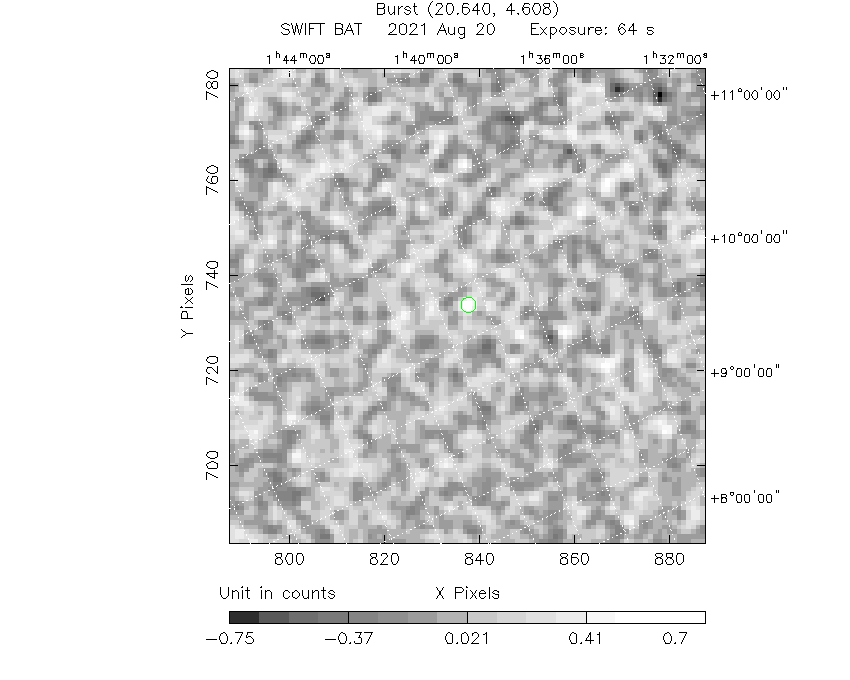
#   RAcent    DECcent   POSerr    Theta     Phi              Peak Cts       SNR   Name
   20.6248     4.6468   0.0383    28.6928   -80.7352         0.8242906      5.018 TRIG_01069551

Foreground time interval of the image:
  0.760  64.613 (delta_t =  63.853 [sec])
Background time interval of the image:
-239.288   0.760 (delta_t = 240.048 [sec])
Light Curves
Note: The mask-weighted lightcurves have units of either count/det or counts/sec/det, where a det is 0.4 x 0.4 = 0.16 sq cm.
Full-time range; 1 s binning
Other quick-look light curves:
- 64 ms binning (zoomed)
- 16 ms binning (zoomed)
- 8 ms binning (zoomed)
- 2 ms binning (zoomed)
- SN=5 or 10 s binning (full-time range)
- Raw light curve
Spectra
- 64 ms binning (zoomed)
- 16 ms binning (zoomed)
- 8 ms binning (zoomed)
- 2 ms binning (zoomed)
- SN=5 or 10 s binning (full-time range)
- Raw light curve
Spectra
Notes:
- 1) The fitting includes the systematic errors.
- 2) When the burst includes telescope slew time periods, the fitting uses an average response file made from multiple 5-s response files through out the slew time plus single time preiod for the non-slew times, and weighted by the total counts in the corresponding time period using addrmf. An average response file is needed becuase a spectral fit using the pre-slew DRM will introduce some errors in both a spectral shape and a normalization if the PHA file contains a lot of the slew/post-slew time interval.
- 3) For fits to more complicated models (e.g. a power-law over a cutoff power-law), the BAT team has decided to require a chi-square improvement of more than 6 for each extra dof.
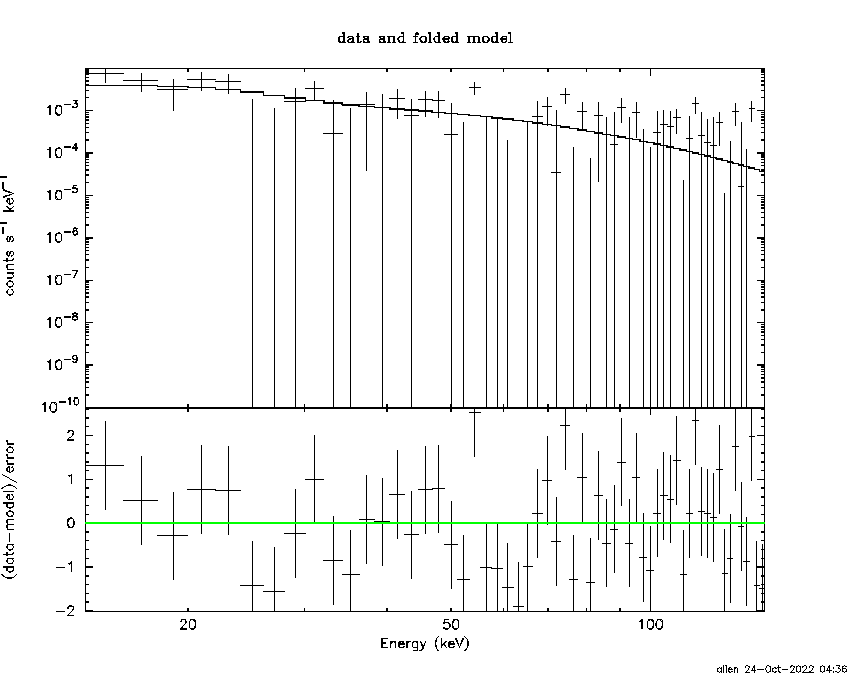
Time averaged spectrum fit using the average DRM
Power-law model
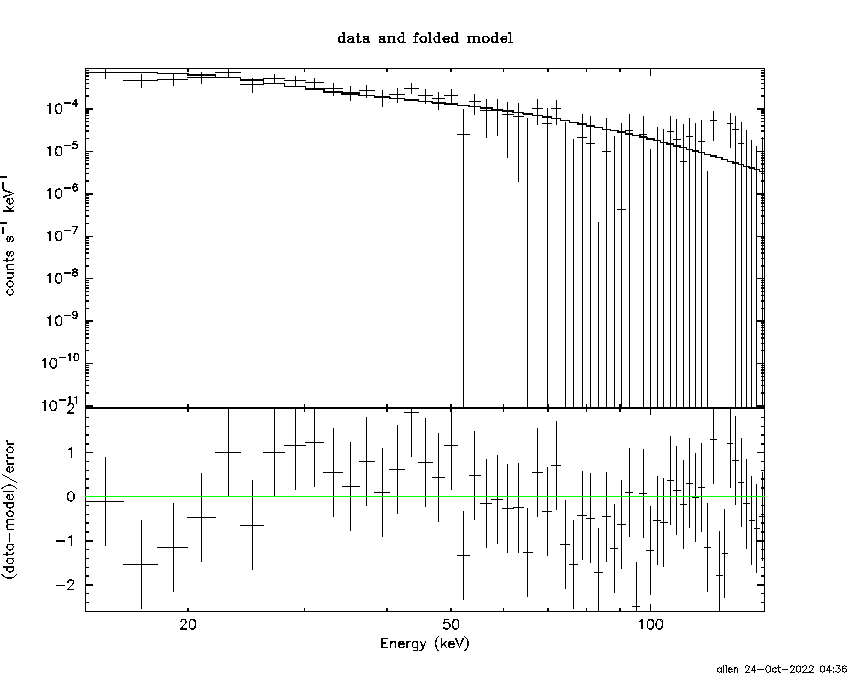
Time interval is from    0.760 sec. to  160.204 sec.

Spectral model in power-law:
------------------------------------------------------------
Parameters  : value       lower 90%   higher 90%
Photon index: -2.09686     ( -0.227318   0.211691 )
Norm@50keV  : 8.53766E-04    ( -0.000141413   0.000139686 )
------------------------------------------------------------
#Fit statistic  : Chi-Squared                   49.83     using 59 bins.
 Reduced chi-squared = 0.874211
# Null hypothesis probability of 7.39e-01 with 57 degrees of freedom

Photon flux (15-150 keV)    in 159.4 sec: 0.134122 ( -0.015879  0.015886 ) ph/cm2/s
Energy fluence (15-150 keV)             : 1.26412e-06 ( -1.87212e-07  1.9405e-07 ) ergs/cm2
Cutoff power-law model
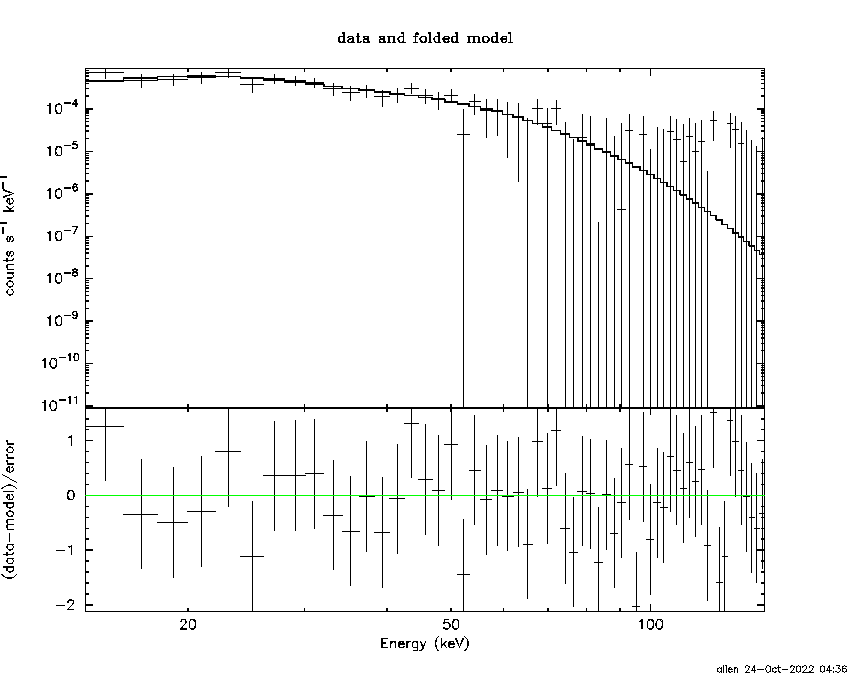
Time interval is from    0.760 sec. to  160.204 sec.
Spectral model in the cutoff power-law:
------------------------------------------------------------
Parameters  : value       lower 90%   higher 90%
Photon index: 0.720458     ( -1.3724   1.77316 )
Epeak [keV] : 35.8048      ( -4.54293 5.05782 )
Norm@50keV  : 4.59707E-02    ( -0.0477179   0.55274 )
------------------------------------------------------------
#Fit statistic  : Chi-Squared                   34.44     using 59 bins.
 Reduced chi-squared = 0.615
# Null hypothesis probability of 9.90e-01 with 56 degrees of freedom

Photon flux (15-150 keV)    in 159.4 sec: 0.125754 ( -0.015555  0.015685 ) ph/cm2/s
Energy fluence (15-150 keV)             : 1.03803e-06 ( -1.4848e-07  1.68393e-07 ) ergs/cm2
1-s peak spectrum fit
Power-law model
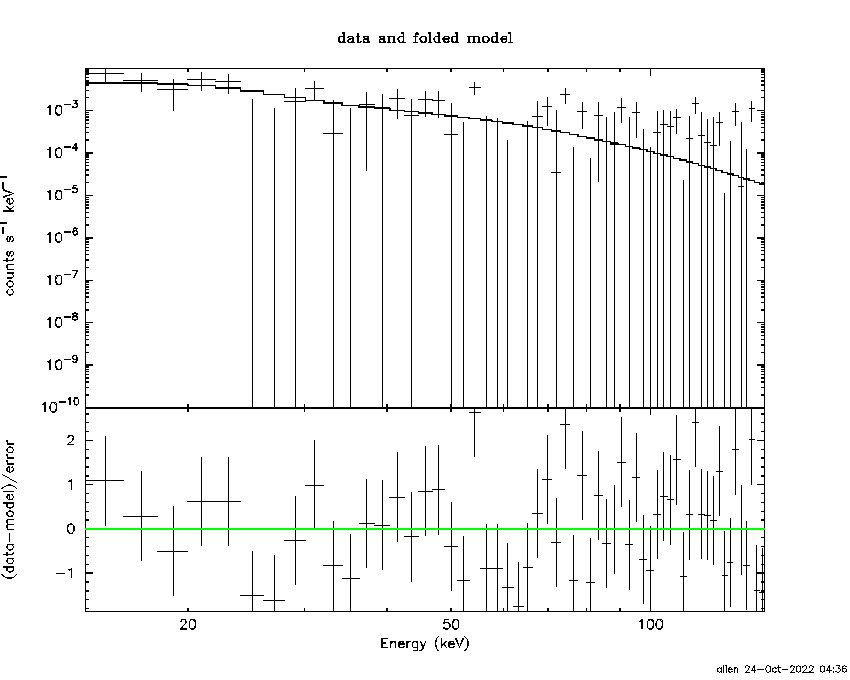
Time interval is from   10.916 sec. to   11.916 sec.

Spectral model in power-law:
------------------------------------------------------------
Parameters  : value       lower 90%   higher 90%
Photon index: -2.19324     ( -0.990184   0.700131 )
Norm@50keV  : 5.03925E-03    ( -0.00282273   0.0023934 )
------------------------------------------------------------
#Fit statistic  : Chi-Squared                   71.14     using 59 bins.
 Reduced chi-squared = 1.24807
# Null hypothesis probability of 9.86e-02 with 57 degrees of freedom

Photon flux (15-150 keV)    in 1 sec: 0.831338 ( -0.242276  0.242092 ) ph/cm2/s
Energy fluence (15-150 keV)             : 4.73086e-08 ( -1.95748e-08  2.12197e-08 ) ergs/cm2
Cutoff power-law model
Time interval is from   10.916 sec. to   11.916 sec.
Spectral model in the cutoff power-law:
------------------------------------------------------------
Parameters  : value       lower 90%   higher 90%
Photon index: -2.11012     ( -0.722953   0.872007 )
Epeak [keV] : 47.0245      (   )
Norm@50keV  : 4.48488E-03    (     )
------------------------------------------------------------
#Fit statistic  : Chi-Squared                   70.87     using 59 bins.
 Reduced chi-squared = 1.26554
# Null hypothesis probability of 8.71e-02 with 56 degrees of freedom

Photon flux (15-150 keV)    in 1 sec: 0.739584 ( -0.560162  0.052621 ) ph/cm2/s
Energy fluence (15-150 keV)             : 1.49101e-08 ( -9.86535e-09  2.59915e-08 ) ergs/cm2
Time-resolved spectra
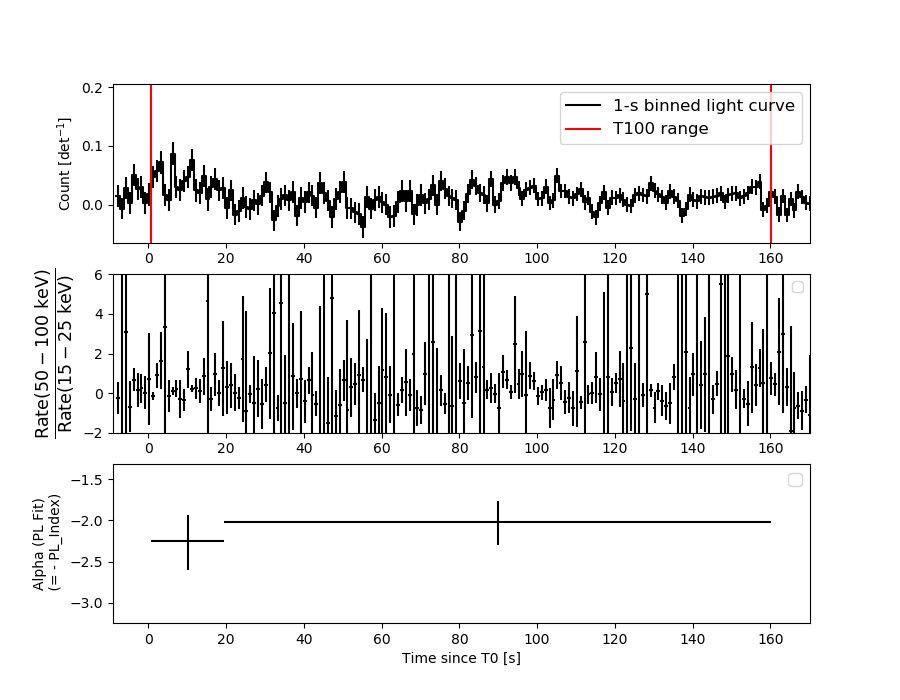
Distribution
T90 vs. Hardness ratio plot
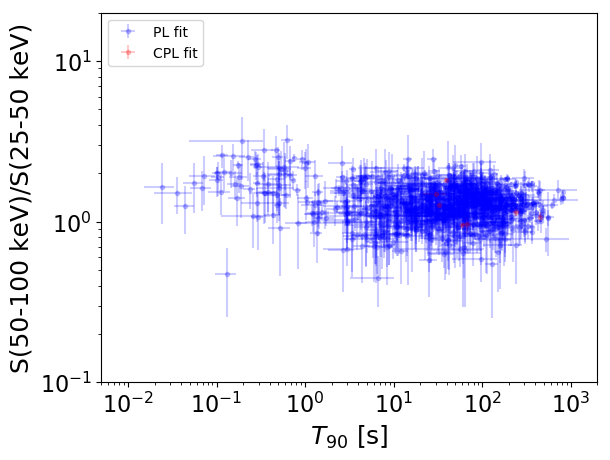
T90                                   = N/A sec.
Hardness ratio (energy fluence ratio) = N/A
S(15-50 keV) vs. S(50-150 keV) plot
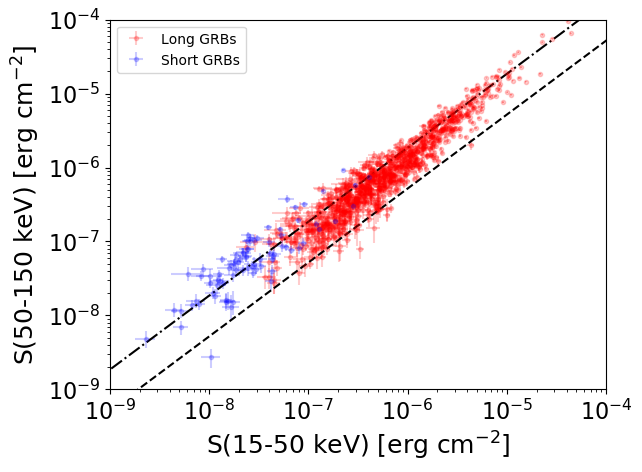
S(15-50 keV)  = N/A
S(50-150 keV) = N/A
The dash-dotted line and the dashed line traces the fluences calculated from the Band function with Epeak = 15 and 150 keV, respectively. Both lines assume a canonical values of alpha = -1 and beta = -2.5.
Mask shadow pattern
IMX = 8.811704475905083E-02, IMY = 5.401816746833300E-01
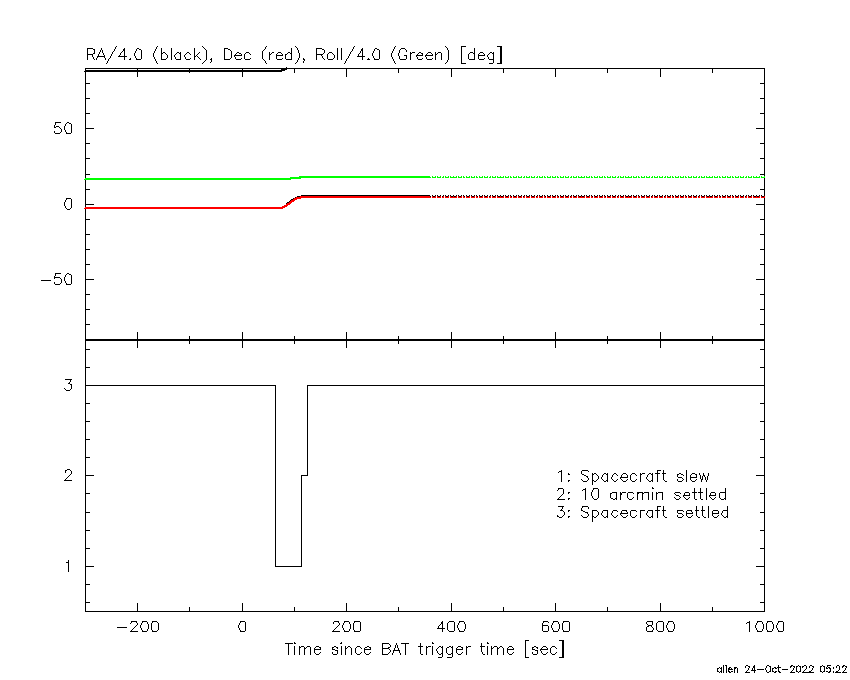
Spacecraft aspect plot
Bright source in the pre-burst/pre-slew/post-slew images
Pre-burst image of 15-350 keV band
Time interval of the image:
-239.288000 0.760000

# RAcent  DECcent POSerr Theta    Phi  PeakCts   SNR AngSep     Name
#  [deg]    [deg]    ['] [deg]  [deg]                   [']
326.0353  38.3040   13.4  48.0  175.7   0.6751   0.9    6.5	Cyg X-2
 30.0871 -34.1680    2.8  46.7  -19.2   2.1233   4.2 ------	UNKNOWN
  7.2471  36.6296    3.0  41.6 -138.4   2.0655   3.9 ------	UNKNOWN
 33.5500 -18.4036    2.7  42.8  -41.4   2.2187   4.2 ------	UNKNOWN
Pre-slew background subtracted image of 15-350 keV band
Time interval of the image:
0.760000 64.612600

# RAcent  DECcent POSerr Theta    Phi  PeakCts   SNR AngSep     Name
#  [deg]    [deg]    ['] [deg]  [deg]                   [']
326.0616  38.2695    6.7  47.9  175.7  -0.4779  -1.7    6.1	Cyg X-2
330.2114  35.6836    2.3  43.9  177.3   1.0221   5.0 ------	UNKNOWN
 20.6241   4.6451    2.3  28.7  -80.7   0.8336   5.1 ------	UNKNOWN
 21.6564  33.8732    2.0  45.6 -121.8   2.6920   5.7 ------	UNKNOWN
Post-slew image of 15-350 keV band
Time interval of the image:
114.412620 662.878000
720.712000 723.464900
725.712000 733.205700
735.712000 743.530000
745.712000 753.463100
754.712000 763.632000
764.712000 786.372000
787.712000 796.032600
797.712000 816.882000
818.712000 962.752000

# RAcent  DECcent POSerr Theta    Phi  PeakCts   SNR AngSep     Name
#  [deg]    [deg]    ['] [deg]  [deg]                   [']
  0.7903   8.3271    3.3  20.0  121.0   2.6306   3.6  501.9	UNKNOWN
 32.2002  14.1510    2.8  14.9 -111.4   2.5176   4.1 ------	UNKNOWN
 55.0617  37.2172    2.7  45.3 -121.4  12.4474   4.3 ------	UNKNOWN
 59.4050  21.7621    3.9  41.3  -98.9  10.9023   2.9 ------	UNKNOWN