Analysis Summary
Notes:
- 1) No attempt has been made to eliminate the non-significant decimal places.
- 2) This batgrbproduct analysis is done using the HEASARC data.
- 3) This batgrbproduct analysis is using the flight position for the mask-weighting calculation.
======================================================================
                  BAT GRB EVENT DATA PROCESSING REPORT
    Process Script Ver: batgrbproduct v2.48
    Process Start Time: Mon Oct 24 00:39:55 EDT 2022
             Host Name: batproc1
   Current Working Dir: /local/data/bat1/alien/Swift_3rdBATcatalog/event/batevent_reproc/trigger1069788
======================================================================

  Trigger: 01069788      Segment: 000

  BAT Trigger Time: 651316725.76   [s; MET]
      Trigger Stop: 651316725.888   [s; MET]
               UTC: 2021-08-22T09:18:18.167540    [includes UTCF correction]
       Where From?: TDRSS position message

  BAT
    RA: 304.47624416316   Dec: 5.26505347483776  [deg; J2000]

     Catalogged Source?: NO
     Point Source?:      YES
     GRB Indicated?:     YES    [ by BAT flight software ]
     Image S/N Ratio:    18.75
     Image Trigger?:     NO
     Rate S/N Ratio:     157.565859246221  [ if not an image trigger ]
     Image S/N Ratio:    18.75

  Analysis Position:   [ source = BAT ]
    RA: 304.47624416316   Dec: 5.26505347483776  [deg; J2000]

  Refined Position:   [ source = BAT pre-slew burst ]
    RA: 304.461317380082   Dec: 5.26528435689814  [deg; J2000]
        { 20h 17m 50.7s , +05d 15' 55.0" }
         +/- 0.528399845286337 [arcmin] (estimated 90% radius based on SNR)
         +/- 0.129632829285487 [arcmin] (formal 1-sigma fit error)
    SNR: 75.6634217164567

  Angular difference between the analysis and refined position is 0.891936 arcmin

  Partial Coding Fraction: 0.640625    [ including projection effects ]

  Duration
     T90: 185.675999879837 +/- 46.6320496684671
        Measured from: 0.25600004196167
                   to: 185.931999921799     [s; relative to TRIGTIME]
     T50: 8.49199998378754 +/- 0.488262233614078
        Measured from: 2.53999996185303
                   to: 11.0319999456406     [s; relative to TRIGTIME]


  Fluence
     Peak Flux  (peak 1 second)
        Measured from: 0.00400006771087646
                   to: 1.00400006771088     [s; relative to TRIGTIME]
     Total Fluence
        Measured from: -0.363999962806702
                   to: 402.603999972343     [s; relative to TRIGTIME]

             Band 1     Band 2     Band 3     Band 4
              15-25      25-50     50-100    100-350     keV
 Total     7.394147  10.328298   9.027857   2.958630
           0.146039   0.150357   0.133026   0.110703 [error]
 Peak      0.579425   1.182879   1.284664   0.423638
           0.018473   0.024564   0.026957   0.020274 [error]

     [ fluence units of on-axis counts / fully illuminated detector ]

======================================================================


====== Table of the duration information =============================

        Value   tstart    tstop
T100  402.968   -0.364  402.604
T90   185.676    0.256  185.932
T50     8.492    2.540   11.032
Peak    1.000    0.004    1.004


====== Spectral Analysis Summary =====================================

Model      : spectral model: simple power-law (PL) and cutoff power-law (CPL)
Ph_index   : photon index: E^{Ph_index}
Ph_90err   : 90% error of the photon index
Epeak      : Epeak in keV
Epeak_90err: 90% error of Epeak
Norm       : normalization at 50 keV in both the PL model and CPL model
Nomr_90err : 90% error of the normalization
chi2       : Chi-Squared
dof        : degree of freedo

=== Time-averaged spectral analysis ===
(Best model with acceptable fit: N/A)

Model Ph_index Ph_90err_low Ph_90err_hi  Epeak  Epeak_90err_low  Epeak_90err_hi  Norm       Nomr_90err_low    Norm_90err_hi    chi2    dof
PL      -1.297    -0.038      0.038       -           -               -         4.96e-03     -9.63e-05          9.60e-05      47.400   57
CPL     -1.251    -0.080     -0.002      999.673    -999.673      -999.673      5.18e-03     -2.96e-04          -1.06e-04      50.790   56


=== 1-s peak spectral analysis ===
(Best model with acceptable fit: N/A)

Model Ph_index Ph_90err_low Ph_90err_hi  Epeak  Epeak_90err_low  Epeak_90err_hi  Norm       Nomr_90err_low    Norm_90err_hi    chi2    dof
PL      -0.991     -0.044     0.044       -           -               -         2.41e-01     -6.03e-03          6.02e-03      68.220   57
CPL     -0.562     -0.182     0.190      198.155     -42.803        98.522      3.69e-01     -5.96e-02          7.40e-02      51.200   56


=== Fluence/Peak Flux Summary ===

              Model    Band1     Band2     Band3     Band4     Band5     Total
                       15-25     25-50    50-100    100-350    15-150    15-350    keV
Fluence         PL   2.10e-06  4.38e-06  7.13e-06  2.61e-05  1.97e-05  3.97e-05   erg/cm2
      90%_error_low -9.33e-08 -1.11e-07 -1.50e-07 -1.35e-06 -3.81e-07 -1.39e-06   erg/cm2
      90%_error_hi   9.53e-08  1.11e-07  1.50e-07  1.40e-06  3.81e-07  1.43e-06   erg/cm2
Peak flux       PL   6.10e+00  8.32e+00  8.37e+00  1.53e+01  2.77e+01  3.81e+01   ph/cm2/s
      90%_error_low -3.14e-01 -2.61e-01 -2.27e-01 -8.87e-01 -7.05e-01 -1.05e+00   ph/cm2/s
      90%_error_hi   3.21e-01  2.60e-01  2.26e-01  9.23e-01  7.06e-01  1.06e+00   ph/cm2/s

Fluence        CPL   2.10e-06  4.38e-06  7.07e-06  2.75e-05  1.98e-05  3.82e-05   erg/cm2
      90%_error_low -9.34e-08 -1.09e-07 -8.38e-08    N/A    -4.78e-07 1.89e-07   erg/cm2
      90%_error_hi   9.54e-08  1.14e-07  2.17e-07    N/A     2.83e-07  2.80e-06   erg/cm2
Peak flux      CPL   5.40e+00  8.46e+00  8.81e+00  1.03e+01  2.72e+01  3.29e+01   ph/cm2/s
      90%_error_low -4.08e-01 -2.77e-01 -2.91e-01 -1.51e+00 -7.34e-01 -1.69e+00   ph/cm2/s
      90%_error_hi   4.17e-01  2.78e-01  2.93e-01  1.83e+00  7.34e-01  1.96e+00   ph/cm2/s

======================================================================
Image
Pre-slew 15.0-350.0 keV image (Event data)
#   RAcent    DECcent   POSerr    Theta     Phi              Peak Cts       SNR   Name
  304.4613     5.2653   0.0025    24.3356    49.4761        18.9650989     75.663 TRIG_01069788

Foreground time interval of the image:
 -0.364   9.341 (delta_t =   9.705 [sec])
Background time interval of the image:
-239.760  -0.364 (delta_t = 239.396 [sec])
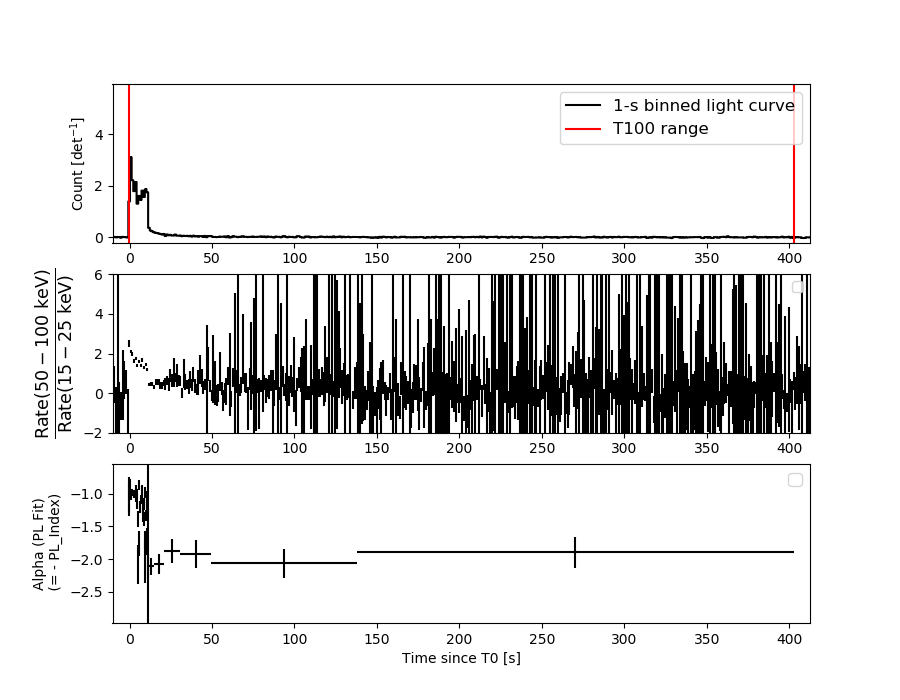
Light Curves
Note: The mask-weighted lightcurves have units of either count/det or counts/sec/det, where a det is 0.4 x 0.4 = 0.16 sq cm.
Full-time range; 1 s binning
Other quick-look light curves:
- 64 ms binning (zoomed)
- 16 ms binning (zoomed)
- 8 ms binning (zoomed)
- 2 ms binning (zoomed)
- SN=5 or 10 s binning (full-time range)
- Raw light curve
Spectra
- 64 ms binning (zoomed)
- 16 ms binning (zoomed)
- 8 ms binning (zoomed)
- 2 ms binning (zoomed)
- SN=5 or 10 s binning (full-time range)
- Raw light curve
Spectra
Notes:
- 1) The fitting includes the systematic errors.
- 2) When the burst includes telescope slew time periods, the fitting uses an average response file made from multiple 5-s response files through out the slew time plus single time preiod for the non-slew times, and weighted by the total counts in the corresponding time period using addrmf. An average response file is needed becuase a spectral fit using the pre-slew DRM will introduce some errors in both a spectral shape and a normalization if the PHA file contains a lot of the slew/post-slew time interval.
- 3) For fits to more complicated models (e.g. a power-law over a cutoff power-law), the BAT team has decided to require a chi-square improvement of more than 6 for each extra dof.
Time averaged spectrum fit using the average DRM
Power-law model
Multiple GTIs in the spectrum
tstart tstop
-0.364000 134.234900
135.240000 402.604000

Spectral model in power-law:
------------------------------------------------------------
Parameters  : value       lower 90%   higher 90%
Photon index: -1.29656     ( -0.0383534   0.038475 )
Norm@50keV  : 4.95665E-03    ( -9.62896e-05   9.60239e-05 )
------------------------------------------------------------
#Fit statistic  : Chi-Squared                   47.40     using 59 bins.
 Reduced chi-squared = 0.831579
# Null hypothesis probability of 8.14e-01 with 57 degrees of freedom

Photon flux (15-150 keV)    in 402 sec: 0.590975 ( -0.013108  0.01316 ) ph/cm2/s
Energy fluence (15-150 keV)             : 1.97091e-05 ( -3.80649e-07  3.80765e-07 ) ergs/cm2
Cutoff power-law model
Multiple GTIs in the spectrum
tstart tstop
-0.364000 134.234900
135.240000 402.604000
Spectral model in the cutoff power-law:
------------------------------------------------------------
Parameters  : value       lower 90%   higher 90%
Photon index: -1.29239     ( -0.039136   0.0386185 )
Epeak [keV] : 1.00000E+04      ( -10000 -10000 )
Norm@50keV  : 4.97707E-03    ( -9.63281e-05   9.34535e-05 )
------------------------------------------------------------
#Fit statistic  : Chi-Squared                   47.70     using 59 bins.
 Reduced chi-squared = 0.851786
# Null hypothesis probability of 7.77e-01 with 56 degrees of freedom

Photon flux (15-150 keV)    in 402 sec: 0.590761 ( -0.013104  0.013168 ) ph/cm2/s
Energy fluence (15-150 keV)             : 1.9801e-05 ( -4.77886e-07  2.83318e-07 ) ergs/cm2
1-s peak spectrum fit
Power-law model
Time interval is from    0.004 sec. to    1.004 sec.

Spectral model in power-law:
------------------------------------------------------------
Parameters  : value       lower 90%   higher 90%
Photon index: -0.990991     ( -0.0438857   0.0440298 )
Norm@50keV  : 0.240860    ( -0.00602664   0.00602261 )
------------------------------------------------------------
#Fit statistic  : Chi-Squared                   68.22     using 59 bins.
 Reduced chi-squared = 1.19684
# Null hypothesis probability of 1.47e-01 with 57 degrees of freedom

Photon flux (15-150 keV)    in 1 sec: 27.7172 ( -0.7053  0.7057 ) ph/cm2/s
Energy fluence (15-150 keV)             : 2.61318e-06 ( -7.11539e-08  7.12371e-08 ) ergs/cm2
Cutoff power-law model
Time interval is from    0.004 sec. to    1.004 sec.
Spectral model in the cutoff power-law:
------------------------------------------------------------
Parameters  : value       lower 90%   higher 90%
Photon index: -0.562384     ( -0.181999   0.189764 )
Epeak [keV] : 198.155      ( -42.8029 98.5218 )
Norm@50keV  : 0.368779    ( -0.0595513   0.0740188 )
------------------------------------------------------------
#Fit statistic  : Chi-Squared                   51.20     using 59 bins.
 Reduced chi-squared = 0.914286
# Null hypothesis probability of 6.57e-01 with 56 degrees of freedom

Photon flux (15-150 keV)    in 1 sec: 27.2032 ( -0.7339  0.7344 ) ph/cm2/s
Energy fluence (15-150 keV)             : 2.5672e-06 ( -7.51887e-08  7.49654e-08 ) ergs/cm2
Time-resolved spectra
Distribution
T90 vs. Hardness ratio plot
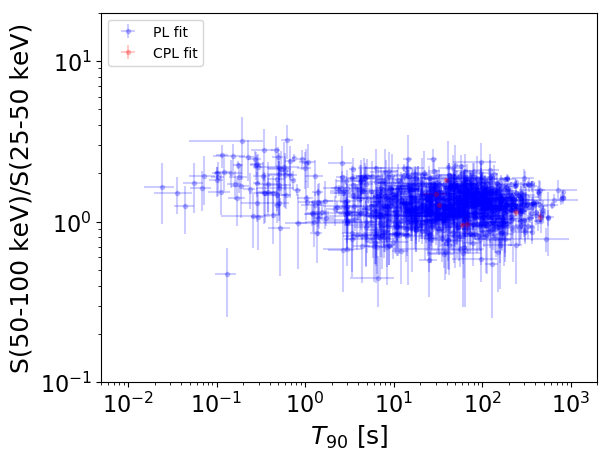
T90                                   = N/A sec.
Hardness ratio (energy fluence ratio) = N/A
S(15-50 keV) vs. S(50-150 keV) plot
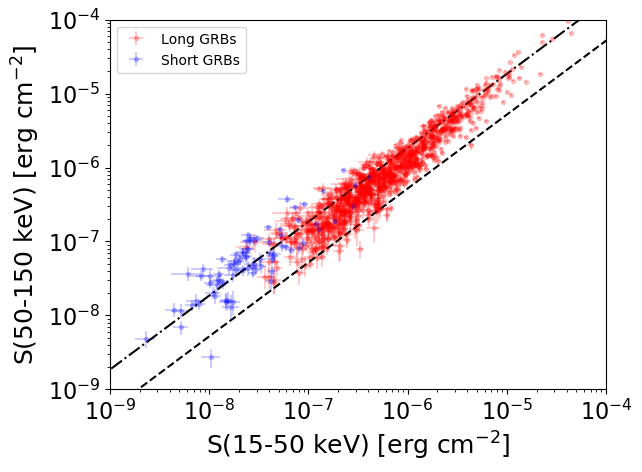
S(15-50 keV)  = N/A
S(50-150 keV) = N/A
The dash-dotted line and the dashed line traces the fluences calculated from the Band function with Epeak = 15 and 150 keV, respectively. Both lines assume a canonical values of alpha = -1 and beta = -2.5.
Mask shadow pattern
IMX = 2.938665141621376E-01, IMY = -3.437827128703871E-01
Spacecraft aspect plot
Bright source in the pre-burst/pre-slew/post-slew images
Pre-burst image of 15-350 keV band
Time interval of the image:
-239.760000 -0.364000

# RAcent  DECcent POSerr Theta    Phi  PeakCts   SNR AngSep     Name
#  [deg]    [deg]    ['] [deg]  [deg]                   [']
244.9526 -15.6088    1.0  38.8 -114.5   6.9869  12.0    2.4	Sco X-1
254.5714  35.3469   10.4  51.1  -39.9   1.2700   1.1    5.6	Her X-1
255.9766 -37.8451    8.1  39.3 -153.5   0.6670   1.4    0.5	4U 1700-377
256.5812 -36.3192    7.4  37.9 -152.2   0.6595   1.5    9.4	GX 349+2
262.9210 -24.7710    6.6  26.3 -142.1   0.4747   1.8    5.0	GX 1+4
264.6492 -44.5837    5.5  40.5 -168.0   0.8122   2.1    9.0	4U 1735-44
268.4893  -1.6161   70.9  16.4  -78.2  -0.0467  -0.2   12.2	SW J1753.5-0127
270.1878 -25.1051   10.0  21.8 -154.0   0.3165   1.2    5.5	GX 5-1
270.3528 -25.6569    3.7  22.1 -155.2   0.8998   3.3    5.8	GRS 1758-258
274.1534 -14.0793    9.5  11.4 -134.1   0.2994   1.2    9.0	GX 17+2
275.7957 -30.3306    4.3  23.9 -171.8   0.6927   2.7    7.0	H1820-303
285.0351 -24.9216  524.1  17.3  167.1  -0.0059  -0.0    0.1	HT1900.1-2455
288.8021  11.0969    5.8  19.4    5.9  -0.5101  -2.0    9.1	GRS 1915+105
299.6435  35.1865    0.8  45.4    9.2   7.1053  15.0    2.8	Cyg X-1
308.0813  40.9973    5.4  53.5   13.6  -2.1579  -2.2    3.0	Cyg X-3
262.8313 -33.8210    5.1  32.5 -155.5  -0.7468  -2.3    7.9	GX 354-0
308.1132  37.6621    2.7  50.7   15.9   2.9985   4.2 ------	UNKNOWN
255.7205 -60.7931    3.2  57.1 -173.2   4.0976   3.6 ------	UNKNOWN
266.7868 -15.1125    3.4  18.2 -124.7   0.9629   3.5 ------	UNKNOWN
278.2124  42.6019    2.0  50.5  -14.4   3.1244   5.9 ------	UNKNOWN
238.6895 -55.4330    4.0  59.6 -161.3   7.0220   2.9 ------	UNKNOWN
Pre-slew background subtracted image of 15-350 keV band
Time interval of the image:
-0.364000 9.340600

# RAcent  DECcent POSerr Theta    Phi  PeakCts   SNR AngSep     Name
#  [deg]    [deg]    ['] [deg]  [deg]                   [']
245.1210 -15.5663  224.1  38.6 -114.5   0.0222   0.1    9.3	Sco X-1
254.5060  35.4785   14.7  51.2  -39.8   0.7681   0.8    8.5	Her X-1
256.1138 -37.9514    5.7  39.3 -153.7  -0.6284  -2.0    8.8	4U 1700-377
256.3653 -36.4416    5.6  38.1 -152.2   0.6210   2.0    3.6	GX 349+2
263.1239 -24.9313    0.0  26.2 -142.7   0.5214   2.3   12.8	GX 1+4
264.9086 -44.4561    7.2  40.3 -168.2  -0.5085  -1.6    7.1	4U 1735-44
268.1984  -1.5420    7.5  16.7  -78.4   0.3373   1.5   11.5	SW J1753.5-0127
270.4281 -25.1491    9.1  21.7 -154.5   0.2755   1.3    8.9	GX 5-1
270.1719 -25.6129    8.2  22.2 -154.8  -0.3413  -1.6   10.5	GRS 1758-258
274.0115 -14.1890   11.7  11.6 -134.2  -0.1945  -1.0    9.2	GX 17+2
276.1040 -30.2921   11.1  23.8 -172.4   0.2409   1.0   10.3	H1820-303
284.8970 -24.8023   20.5  17.2  167.5   0.1204   0.6   10.4	HT1900.1-2455
288.8994  10.9743   20.5  19.3    6.3  -0.1230  -0.6    6.2	GRS 1915+105
299.6056  35.3530   12.3  45.5    9.1  -0.4011  -0.9    9.1	Cyg X-1
307.9804  40.9251    4.3  53.4   13.6   2.3164   2.7    6.1	Cyg X-3
262.8239 -33.8708   17.4  32.6 -155.6  -0.1674  -0.7    8.5	GX 354-0
310.0510  38.1361    2.0  51.9   17.2   3.9407   5.6 ------	UNKNOWN
304.4613   5.2653    0.2  24.3   49.5  18.9652  75.7 ------	UNKNOWN
238.8806 -21.1673    3.3  45.4 -121.4   2.9849   3.5 ------	UNKNOWN
Post-slew image of 15-350 keV band
Time interval of the image:
63.140600 134.234900
135.240000 520.099400
522.240000 584.215000
585.240000 612.852600
615.240000 899.653800
921.240000 962.360600

# RAcent  DECcent POSerr Theta    Phi  PeakCts   SNR AngSep     Name
#  [deg]    [deg]    ['] [deg]  [deg]                   [']
263.0189 -24.7595    4.4  50.3 -160.5   6.3036   2.6    1.0	GX 1+4
268.3748  -1.4436  160.6  36.7 -131.5  -0.1027  -0.1    0.7	SW J1753.5-0127
270.3254 -25.0906    4.1  45.0 -165.9   4.7119   2.8    2.3	GX 5-1
270.3117 -25.8593    3.3  45.5 -166.8   6.2244   3.5    7.0	GRS 1758-258
274.0214 -13.9733    3.2  35.8 -154.7   3.8992   3.6    3.9	GX 17+2
275.8589 -30.2655    6.5  44.9 -176.0   2.7897   1.8    7.0	H1820-303
284.9950 -24.9339    7.3  35.7  179.3   1.7551   1.6    2.4	HT1900.1-2455
288.9791  10.9558    9.5  16.3 -100.6   1.0330   1.2   10.7	GRS 1915+105
299.5845  35.1982    0.4  30.2  -39.8  27.6428  26.3    0.3	Cyg X-1
308.3543  40.9782    7.1  35.9  -26.9   1.8685   1.6   11.2	Cyg X-3
326.1675  38.2217    6.1  38.4   -4.0   2.6629   1.9    6.0	Cyg X-2
262.9973 -33.8544 1867.9  55.4 -170.0   0.0177   0.0    1.2	GX 354-0
351.0870  11.0563    4.0  46.5   47.9  10.3643   2.9 ------	UNKNOWN
353.8351  19.5900    3.6  50.1   36.9  16.0074   3.2 ------	UNKNOWN
299.8488 -40.9831    3.7  46.5  152.9   8.6839   3.1 ------	UNKNOWN
304.4678   5.2787    1.8   0.0  114.4   5.6990   6.5 ------	UNKNOWN
272.0228 -31.2130    2.6  47.9 -173.7   7.5265   4.5 ------	UNKNOWN
298.4130  11.2799    4.7   8.5  -76.5   1.7928   2.5 ------	UNKNOWN
289.6963   7.8290    2.4  14.9 -111.3   3.7368   4.8 ------	UNKNOWN
308.0697  37.6346    0.8  32.5  -26.6  14.7214  14.0 ------	UNKNOWN
281.1001  -1.9721    2.6  24.4 -138.6   3.9042   4.4 ------	UNKNOWN