Analysis Summary
Notes:
- 1) No attempt has been made to eliminate the non-significant decimal places.
- 2) This batgrbproduct analysis is done using the HEASARC data.
- 3) This batgrbproduct analysis is using the flight position for the mask-weighting calculation.
======================================================================
                  BAT GRB EVENT DATA PROCESSING REPORT
    Process Script Ver: batgrbproduct v2.48
    Process Start Time: Mon Oct 24 00:36:20 EDT 2022
             Host Name: batproc1
   Current Working Dir: /local/data/bat1/alien/Swift_3rdBATcatalog/event/batevent_reproc/trigger1070157
======================================================================

  Trigger: 01070157      Segment: 000

  BAT Trigger Time: 651471029.248   [s; MET]
      Trigger Stop: 651471033.344   [s; MET]
               UTC: 2021-08-24T04:10:01.645220    [includes UTCF correction]
       Where From?: TDRSS position message

  BAT
    RA: 232.132177220809   Dec: 11.1352220237674  [deg; J2000]

     Catalogged Source?: NO
     Point Source?:      YES
     GRB Indicated?:     YES    [ by BAT flight software ]
     Image S/N Ratio:    11.96
     Image Trigger?:     NO
     Rate S/N Ratio:     14.0356688476182  [ if not an image trigger ]
     Image S/N Ratio:    11.96

  Analysis Position:   [ source = BAT ]
    RA: 232.132177220809   Dec: 11.1352220237674  [deg; J2000]

  Refined Position:   [ source = BAT pre-slew burst ]
    RA: 232.11208509043   Dec: 11.1697401317395  [deg; J2000]
        { 15h 28m 26.9s , +11d 10' 11.1" }
         +/- 1.24663814299732 [arcmin] (estimated 90% radius based on SNR)
         +/- 0.479043336749218 [arcmin] (formal 1-sigma fit error)
    SNR: 22.1996621271105

  Angular difference between the analysis and refined position is 2.385021 arcmin

  Partial Coding Fraction: 0.6015625    [ including projection effects ]

  Duration
     T90: 77.6319998502731 +/- 16.6819471971961
        Measured from: -6.99199998378754
                   to: 70.6399998664856     [s; relative to TRIGTIME]
     T50: 25.9199998378754 +/- 9.66463573495682
        Measured from: 3.05599999427795
                   to: 28.9759998321533     [s; relative to TRIGTIME]


  Fluence
     Peak Flux  (peak 1 second)
        Measured from: 0.924000024795532
                   to: 1.92400002479553     [s; relative to TRIGTIME]
     Total Fluence
        Measured from: -12.8799999952316
                   to: 100.016000032425     [s; relative to TRIGTIME]

             Band 1     Band 2     Band 3     Band 4
              15-25      25-50     50-100    100-350     keV
 Total     0.921986   1.175692   0.852342   0.280992
           0.090984   0.094056   0.083501   0.072992 [error]
 Peak      0.036666   0.050711   0.058430   0.023236
           0.008466   0.009500   0.008343   0.007701 [error]

     [ fluence units of on-axis counts / fully illuminated detector ]

======================================================================


====== Table of the duration information =============================

        Value   tstart    tstop
T100  112.896  -12.880  100.016
T90    77.632   -6.992   70.640
T50    25.920    3.056   28.976
Peak    1.000    0.924    1.924


====== Spectral Analysis Summary =====================================

Model      : spectral model: simple power-law (PL) and cutoff power-law (CPL)
Ph_index   : photon index: E^{Ph_index}
Ph_90err   : 90% error of the photon index
Epeak      : Epeak in keV
Epeak_90err: 90% error of Epeak
Norm       : normalization at 50 keV in both the PL model and CPL model
Nomr_90err : 90% error of the normalization
chi2       : Chi-Squared
dof        : degree of freedo

=== Time-averaged spectral analysis ===
(Best model with acceptable fit: N/A)

Model Ph_index Ph_90err_low Ph_90err_hi  Epeak  Epeak_90err_low  Epeak_90err_hi  Norm       Nomr_90err_low    Norm_90err_hi    chi2    dof
PL      -1.483    -0.152      0.151       -           -               -         1.83e-03     -1.65e-04          1.64e-04      46.970   57
CPL     -1.158    -0.404      0.676      123.105     -55.091      -123.105      2.72e-03     -1.02e-03          3.39e-03      46.110   56


=== 1-s peak spectral analysis ===
(Best model with acceptable fit: N/A)

Model Ph_index Ph_90err_low Ph_90err_hi  Epeak  Epeak_90err_low  Epeak_90err_hi  Norm       Nomr_90err_low    Norm_90err_hi    chi2    dof
PL      -1.026     -0.318     0.339       -           -               -         1.06e-02     -1.80e-03          1.78e-03      52.670   57
CPL     -1.032     -0.308     0.353     9999.360    -9999.360      -9999.360      1.07e-02     -1.77e-03          9.97e-03      52.690   56


=== Fluence/Peak Flux Summary ===

              Model    Band1     Band2     Band3     Band4     Band5     Total
                       15-25     25-50    50-100    100-350    15-150    15-350    keV
Fluence         PL   2.59e-07  4.82e-07  6.90e-07  2.09e-06  1.96e-06  3.52e-06   erg/cm2
      90%_error_low -3.73e-08 -4.37e-08 -8.12e-08 -4.76e-07 -1.95e-07 -5.50e-07   erg/cm2
      90%_error_hi   3.85e-08  4.35e-08  8.10e-08  5.67e-07  1.98e-07  6.24e-07   erg/cm2
Peak flux       PL   2.78e-01  3.72e-01  3.65e-01  6.44e-01  1.23e+00  1.66e+00   ph/cm2/s
      90%_error_low -9.75e-02 -8.30e-02 -6.82e-02 -2.37e-01 -2.11e-01 -2.98e-01   ph/cm2/s
      90%_error_hi   1.10e-01  7.94e-02  6.66e-02  3.25e-01  2.12e-01  3.19e-01   ph/cm2/s

Fluence        CPL   2.48e-07  5.01e-07  6.98e-07  1.22e-06  1.90e-06  2.66e-06   erg/cm2
      90%_error_low -4.28e-08 -5.51e-08 -8.55e-08 -7.24e-07 -2.27e-07 -7.57e-07   erg/cm2
      90%_error_hi   4.31e-08  5.73e-08  8.66e-08  1.02e-06  2.26e-07  1.09e-06   erg/cm2
Peak flux      CPL   2.79e-01  3.72e-01  3.66e-01  6.40e-01  1.23e+00  1.74e+00   ph/cm2/s
      90%_error_low     N/A   -8.31e-02     N/A       N/A   -2.12e-01 -4.82e-01   ph/cm2/s
      90%_error_hi      N/A    7.94e-02     N/A       N/A    2.12e-01  1.95e-01   ph/cm2/s

======================================================================
Image
Pre-slew 15.0-350.0 keV image (Event data)
#   RAcent    DECcent   POSerr    Theta     Phi              Peak Cts       SNR   Name
  232.1121    11.1697   0.0087    22.5397    81.1883         2.7260442     22.200 TRIG_01070157

Foreground time interval of the image:
-12.880  32.653 (delta_t =  45.533 [sec])
Background time interval of the image:
-239.248 -12.880 (delta_t = 226.368 [sec])
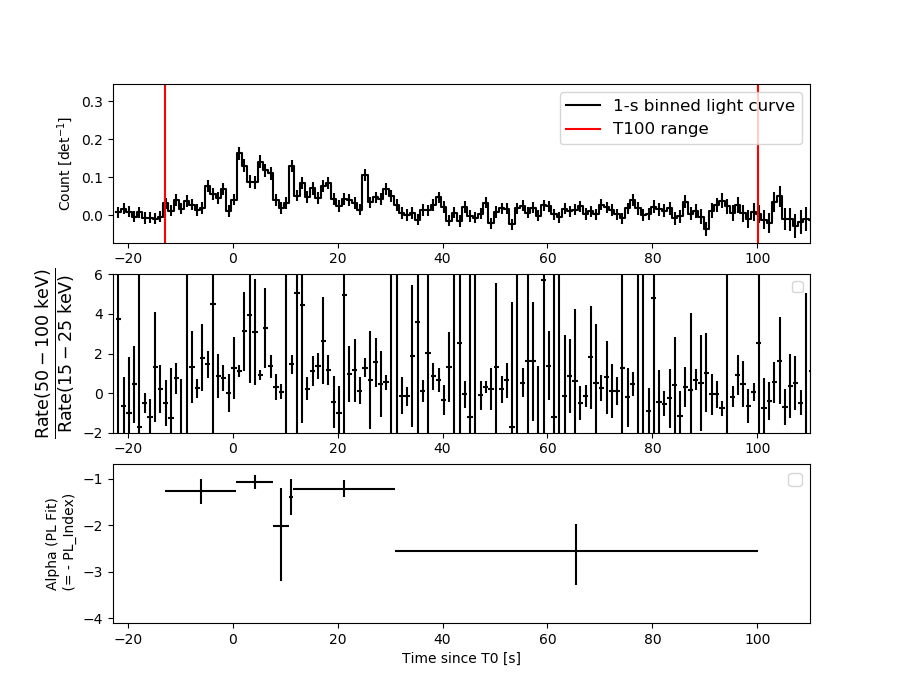
Light Curves
Note: The mask-weighted lightcurves have units of either count/det or counts/sec/det, where a det is 0.4 x 0.4 = 0.16 sq cm.
Full-time range; 1 s binning
Other quick-look light curves:
- 64 ms binning (zoomed)
- 16 ms binning (zoomed)
- 8 ms binning (zoomed)
- 2 ms binning (zoomed)
- SN=5 or 10 s binning (full-time range)
- Raw light curve
Spectra
- 64 ms binning (zoomed)
- 16 ms binning (zoomed)
- 8 ms binning (zoomed)
- 2 ms binning (zoomed)
- SN=5 or 10 s binning (full-time range)
- Raw light curve
Spectra
Notes:
- 1) The fitting includes the systematic errors.
- 2) When the burst includes telescope slew time periods, the fitting uses an average response file made from multiple 5-s response files through out the slew time plus single time preiod for the non-slew times, and weighted by the total counts in the corresponding time period using addrmf. An average response file is needed becuase a spectral fit using the pre-slew DRM will introduce some errors in both a spectral shape and a normalization if the PHA file contains a lot of the slew/post-slew time interval.
- 3) For fits to more complicated models (e.g. a power-law over a cutoff power-law), the BAT team has decided to require a chi-square improvement of more than 6 for each extra dof.
Time averaged spectrum fit using the average DRM
Power-law model
Time interval is from  -12.880 sec. to  100.016 sec.

Spectral model in power-law:
------------------------------------------------------------
Parameters  : value       lower 90%   higher 90%
Photon index: -1.48252     ( -0.151939   0.151333 )
Norm@50keV  : 1.82886E-03    ( -0.000165379   0.000164466 )
------------------------------------------------------------
#Fit statistic  : Chi-Squared                   46.97     using 59 bins.
 Reduced chi-squared = 0.824035
# Null hypothesis probability of 8.26e-01 with 57 degrees of freedom

Photon flux (15-150 keV)    in 112.9 sec: 0.227263 ( -0.020063  0.02008 ) ph/cm2/s
Energy fluence (15-150 keV)             : 1.96473e-06 ( -1.95258e-07  1.97609e-07 ) ergs/cm2
Cutoff power-law model
Time interval is from  -12.880 sec. to  100.016 sec.
Spectral model in the cutoff power-law:
------------------------------------------------------------
Parameters  : value       lower 90%   higher 90%
Photon index: -1.158     ( -0.404282   0.676487 )
Epeak [keV] : 123.105      ( -55.1353 -123.149 )
Norm@50keV  : 2.71842E-03    ( -0.00101955   0.00339179 )
------------------------------------------------------------
#Fit statistic  : Chi-Squared                   46.11     using 59 bins.
 Reduced chi-squared = 0.823393
# Null hypothesis probability of 8.24e-01 with 56 degrees of freedom

Photon flux (15-150 keV)    in 112.9 sec: 0.224256 ( -0.020904  0.020809 ) ph/cm2/s
Energy fluence (15-150 keV)             : 1.90355e-06 ( -2.26972e-07  2.25686e-07 ) ergs/cm2
1-s peak spectrum fit
Power-law model

Time interval is from    0.924 sec. to    1.924 sec.

Spectral model in power-law:
------------------------------------------------------------
Parameters  : value       lower 90%   higher 90%
Photon index: -1.02566     ( -0.318031   0.33856 )
Norm@50keV  : 1.06391E-02    ( -0.00179552   0.00178066 )
------------------------------------------------------------
#Fit statistic  : Chi-Squared                   52.67     using 59 bins.
 Reduced chi-squared = 0.924035
# Null hypothesis probability of 6.38e-01 with 57 degrees of freedom

Photon flux (15-150 keV)    in 1 sec: 1.22670 ( -0.21148  0.21219 ) ph/cm2/s
Energy fluence (15-150 keV)             : 1.1403e-07 ( -2.08742e-08  2.10746e-08 ) ergs/cm2
Cutoff power-law model
Time interval is from    0.924 sec. to    1.924 sec.
Spectral model in the cutoff power-law:
------------------------------------------------------------
Parameters  : value       lower 90%   higher 90%
Photon index: -1.03203     ( -0.309207   0.352536 )
Epeak [keV] : 9999.36      ( -9999.36 -9999.36 )
Norm@50keV  : 1.07101E-02    ( -0.00177265   0.00997529 )
------------------------------------------------------------
#Fit statistic  : Chi-Squared                   52.69     using 59 bins.
 Reduced chi-squared = 0.940893
# Null hypothesis probability of 6.01e-01 with 56 degrees of freedom

Photon flux (15-150 keV)    in 1 sec: 1.22646 ( -0.21156  0.21208 ) ph/cm2/s
Energy fluence (15-150 keV)             : 1.14525e-07 ( 0  0 ) ergs/cm2
Time-resolved spectra
Distribution
T90 vs. Hardness ratio plot

T90                                   = N/A sec.
Hardness ratio (energy fluence ratio) = N/A
S(15-50 keV) vs. S(50-150 keV) plot
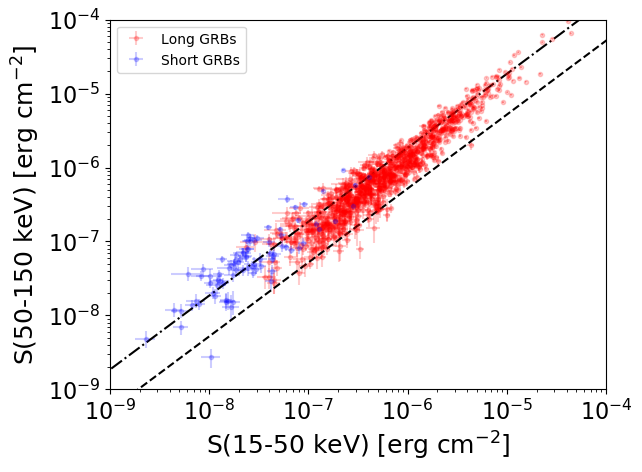
S(15-50 keV)  = N/A
S(50-150 keV) = N/A
The dash-dotted line and the dashed line traces the fluences calculated from the Band function with Epeak = 15 and 150 keV, respectively. Both lines assume a canonical values of alpha = -1 and beta = -2.5.
Mask shadow pattern
IMX = 6.357669069512054E-02, IMY = -4.101261862489640E-01
Spacecraft aspect plot
Bright source in the pre-burst/pre-slew/post-slew images
Pre-burst image of 15-350 keV band
Time interval of the image:
-239.248000 -12.880000

# RAcent  DECcent POSerr Theta    Phi  PeakCts   SNR AngSep     Name
#  [deg]    [deg]    ['] [deg]  [deg]                   [']
254.4338  35.2019   10.5  47.9   46.6  -1.1790  -1.1    8.5	Her X-1
214.2745 -41.8131    2.9  52.5  170.4   2.9341   3.9 ------	UNKNOWN
207.7517 -36.7888    2.8  47.3  176.7   2.4347   4.1 ------	UNKNOWN
187.0102 -40.8221    2.5  55.2 -164.5   3.4845   4.6 ------	UNKNOWN
168.8244 -10.6683    2.5  45.3 -121.4   4.6593   4.5 ------	UNKNOWN
Pre-slew background subtracted image of 15-350 keV band
Time interval of the image:
-12.880000 32.652600

# RAcent  DECcent POSerr Theta    Phi  PeakCts   SNR AngSep     Name
#  [deg]    [deg]    ['] [deg]  [deg]                   [']
254.3326  35.4610   69.8  47.9   46.3   0.0742   0.2    9.4	Her X-1
232.1121  11.1698    0.5  22.5   81.2   2.7260  22.2 ------	UNKNOWN
230.1933  28.4142    1.9  26.7   39.9   0.7183   6.0 ------	UNKNOWN
229.4525  62.7041    2.8  54.3    6.5   1.3651   4.1 ------	UNKNOWN
180.9339   2.2447    2.3  29.2 -109.2   0.6677   4.9 ------	UNKNOWN
168.8473 -11.5161    2.0  45.7 -122.5   2.3465   6.0 ------	UNKNOWN
Post-slew image of 15-350 keV band
Time interval of the image:
181.252600 193.652610

# RAcent  DECcent POSerr Theta    Phi  PeakCts   SNR AngSep     Name
#  [deg]    [deg]    ['] [deg]  [deg]                   [']
299.6717  35.1715    2.5  48.6  144.8   0.8624   4.6    4.4	Cyg X-1
308.0879  40.9613  633.6  40.1  141.5   0.0020   0.0    1.1	Cyg X-3
325.9914  38.4240    4.9  34.9  120.1  -0.2079  -2.4   10.5	Cyg X-2
 46.2453  17.4499    2.7  54.0    8.7   0.6831   4.2 ------	UNKNOWN
250.6698  50.2747    2.4  55.0 -166.6   0.6855   4.8 ------	UNKNOWN