Analysis Summary
Notes:
- 1) No attempt has been made to eliminate the non-significant decimal places.
- 2) This batgrbproduct analysis is done using the HEASARC data.
- 3) This batgrbproduct analysis is using the flight position for the mask-weighting calculation.
======================================================================
                  BAT GRB EVENT DATA PROCESSING REPORT
    Process Script Ver: batgrbproduct v2.48
    Process Start Time: Mon Oct 24 00:32:14 EDT 2022
             Host Name: batproc1
   Current Working Dir: /local/data/bat1/alien/Swift_3rdBATcatalog/event/batevent_reproc/trigger1071993
======================================================================

  Trigger: 01071993      Segment: 000

  BAT Trigger Time: 652493588.992   [s; MET]
      Trigger Stop: 652493591.04   [s; MET]
               UTC: 2021-09-05T00:12:41.320740    [includes UTCF correction]
       Where From?: TDRSS position message

  BAT
    RA: 309.061771074576   Dec: -44.4308232449456  [deg; J2000]

     Catalogged Source?: NO
     Point Source?:      YES
     GRB Indicated?:     YES    [ by BAT flight software ]
     Image S/N Ratio:    9.35
     Image Trigger?:     NO
     Rate S/N Ratio:     14.1774468787578  [ if not an image trigger ]
     Image S/N Ratio:    9.35

  Analysis Position:   [ source = BAT ]
    RA: 309.061771074576   Dec: -44.4308232449456  [deg; J2000]

  Refined Position:   [ source = BAT pre-slew burst ]
    RA: 309.053929954107   Dec: -44.422884520943  [deg; J2000]
        { 20h 36m 12.9s , -44d 25' 22.4" }
         +/- 1.39191504214578 [arcmin] (estimated 90% radius based on SNR)
         +/- 0.49779368804662 [arcmin] (formal 1-sigma fit error)
    SNR: 18.9651961891967

  Angular difference between the analysis and refined position is 0.582896 arcmin

  Partial Coding Fraction: 0.3398438    [ including projection effects ]

  Duration
     T90: 778.399999976158 +/- 388.456258305999
        Measured from: -24.1679999828339
                   to: 754.231999993324     [s; relative to TRIGTIME]
     T50: 778.399999976158 +/- 772.451878978645
        Measured from: -24.1679999828339
                   to: 754.231999993324     [s; relative to TRIGTIME]


  Fluence
     Peak Flux  (peak 1 second)
        Measured from: 0.860000014305115
                   to: 1.86000001430511     [s; relative to TRIGTIME]
     Total Fluence
        Measured from: -24.1679999828339
                   to: 754.231999993324     [s; relative to TRIGTIME]

             Band 1     Band 2     Band 3     Band 4
              15-25      25-50     50-100    100-350     keV
 Total     1.988747   2.460124   1.981204   0.592613
           0.253675   0.262208   0.233648   0.214448 [error]
 Peak      0.051211   0.073651   0.095822   0.038042
           0.013264   0.014568   0.012762   0.010112 [error]

     [ fluence units of on-axis counts / fully illuminated detector ]

======================================================================


====== Table of the duration information =============================

        Value   tstart    tstop
T100  778.400  -24.168  754.232
T90   778.400  -24.168  754.232
T50   778.400  -24.168  754.232
Peak    1.000    0.860    1.860


====== Spectral Analysis Summary =====================================

Model      : spectral model: simple power-law (PL) and cutoff power-law (CPL)
Ph_index   : photon index: E^{Ph_index}
Ph_90err   : 90% error of the photon index
Epeak      : Epeak in keV
Epeak_90err: 90% error of Epeak
Norm       : normalization at 50 keV in both the PL model and CPL model
Nomr_90err : 90% error of the normalization
chi2       : Chi-Squared
dof        : degree of freedo

=== Time-averaged spectral analysis ===
(Best model with acceptable fit: N/A)

Model Ph_index Ph_90err_low Ph_90err_hi  Epeak  Epeak_90err_low  Epeak_90err_hi  Norm       Nomr_90err_low    Norm_90err_hi    chi2    dof
PL      -1.512    -0.194      0.192       -           -               -         5.81e-04     -6.84e-05          6.79e-05      56.860   57
CPL     -0.974    -0.628      0.887       90.413     -32.022       -90.413      1.12e-03     -5.82e-04          2.11e-03      55.350   56


=== 1-s peak spectral analysis ===
(Best model with acceptable fit: N/A)

Model Ph_index Ph_90err_low Ph_90err_hi  Epeak  Epeak_90err_low  Epeak_90err_hi  Norm       Nomr_90err_low    Norm_90err_hi    chi2    dof
PL      -0.973     -0.299     0.323       -           -               -         1.58e-02     -2.88e-03          2.82e-03      49.080   57
CPL     -0.866     -0.404     1.143      645.377    -645.377      -645.377      1.75e-02     -4.33e-03          2.92e-02      49.120   56


=== Fluence/Peak Flux Summary ===

              Model    Band1     Band2     Band3     Band4     Band5     Total
                       15-25     25-50    50-100    100-350    15-150    15-350    keV
Fluence         PL   5.84e-07  1.07e-06  1.49e-06  4.39e-06  4.28e-06  7.53e-06   erg/cm2
      90%_error_low -1.05e-07 -1.24e-07 -2.28e-07 -1.26e-06 -5.50e-07 -1.47e-06   erg/cm2
      90%_error_hi   1.09e-07  1.23e-07  2.28e-07  1.56e-06  5.57e-07  1.73e-06   erg/cm2
Peak flux       PL   3.93e-01  5.43e-01  5.53e-01  1.03e+00  1.82e+00  2.51e+00   ph/cm2/s
      90%_error_low -1.42e-01 -1.31e-01 -9.63e-02 -3.44e-01 -3.34e-01 -4.39e-01   ph/cm2/s
      90%_error_hi   1.65e-01  1.28e-01  9.55e-02  4.47e-01  3.37e-01  4.53e-01   ph/cm2/s

Fluence        CPL   5.43e-07  1.13e-06  1.52e-06  1.92e-06  4.08e-06  5.12e-06   erg/cm2
      90%_error_low -1.22e-07 -1.56e-07 -2.48e-07 -1.24e-06 -6.15e-07 -1.40e-06   erg/cm2
      90%_error_hi   1.23e-07  1.62e-07  2.50e-07  2.95e-06  6.23e-07  3.04e-06   erg/cm2
Peak flux      CPL   3.95e-01  5.43e-01  5.53e-01  1.03e+00  1.82e+00  2.52e+00   ph/cm2/s
      90%_error_low -1.85e-01 -1.31e-01 -9.58e-02 -6.34e-01 -3.43e-01 -7.68e-01   ph/cm2/s
      90%_error_hi   1.15e-01  1.31e-01  1.25e-01  4.29e-01  3.36e-01  4.06e-01   ph/cm2/s

======================================================================
Image
Pre-slew 15.0-350.0 keV image (Event data)
#   RAcent    DECcent   POSerr    Theta     Phi              Peak Cts       SNR   Name
  309.0539   -44.4229   0.0101    32.9728    54.4855         3.8119101     18.965 TRIG_01071993

Foreground time interval of the image:
-24.168  27.309 (delta_t =  51.477 [sec])
Background time interval of the image:
-239.992 -24.168 (delta_t = 215.824 [sec])
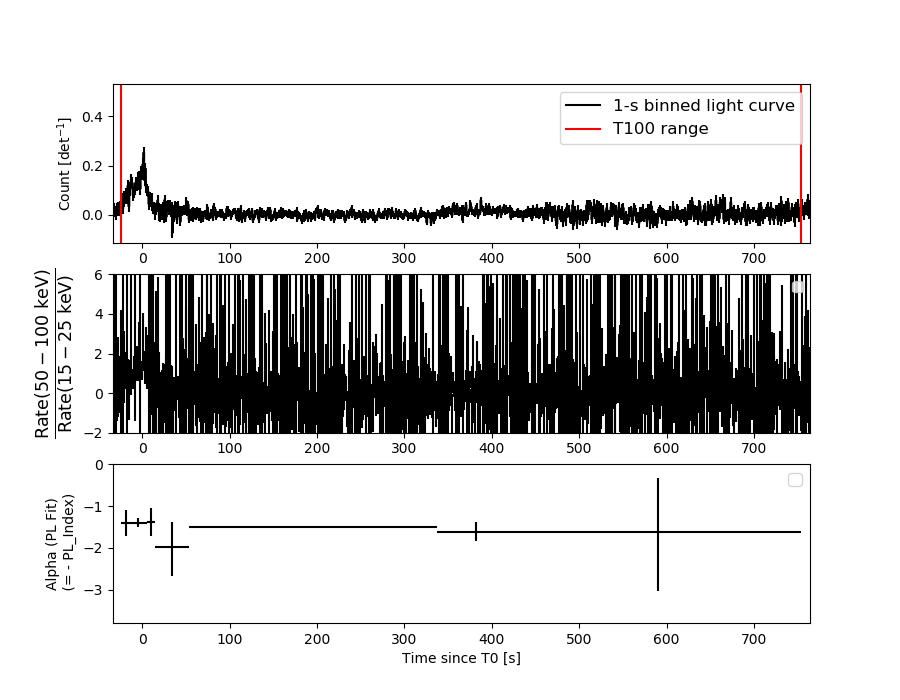
Light Curves
Note: The mask-weighted lightcurves have units of either count/det or counts/sec/det, where a det is 0.4 x 0.4 = 0.16 sq cm.
Full-time range; 1 s binning
Other quick-look light curves:
- 64 ms binning (zoomed)
- 16 ms binning (zoomed)
- 8 ms binning (zoomed)
- 2 ms binning (zoomed)
- SN=5 or 10 s binning (full-time range)
- Raw light curve
Spectra
- 64 ms binning (zoomed)
- 16 ms binning (zoomed)
- 8 ms binning (zoomed)
- 2 ms binning (zoomed)
- SN=5 or 10 s binning (full-time range)
- Raw light curve
Spectra
Notes:
- 1) The fitting includes the systematic errors.
- 2) When the burst includes telescope slew time periods, the fitting uses an average response file made from multiple 5-s response files through out the slew time plus single time preiod for the non-slew times, and weighted by the total counts in the corresponding time period using addrmf. An average response file is needed becuase a spectral fit using the pre-slew DRM will introduce some errors in both a spectral shape and a normalization if the PHA file contains a lot of the slew/post-slew time interval.
- 3) For fits to more complicated models (e.g. a power-law over a cutoff power-law), the BAT team has decided to require a chi-square improvement of more than 6 for each extra dof.
Time averaged spectrum fit using the average DRM
Power-law model
Time interval is from  -24.168 sec. to  754.232 sec.

Spectral model in power-law:
------------------------------------------------------------
Parameters  : value       lower 90%   higher 90%
Photon index: -1.51194     ( -0.193847   0.19203 )
Norm@50keV  : 5.80858E-04    ( -6.83971e-05   6.78568e-05 )
------------------------------------------------------------
#Fit statistic  : Chi-Squared                   56.86     using 59 bins.
 Reduced chi-squared = 0.997544
# Null hypothesis probability of 4.80e-01 with 57 degrees of freedom

Photon flux (15-150 keV)    in 778.4 sec: 7.27510E-02 ( -0.0082735  0.0082814 ) ph/cm2/s
Energy fluence (15-150 keV)             : 4.28157e-06 ( -5.49556e-07  5.56846e-07 ) ergs/cm2
Cutoff power-law model
Time interval is from  -24.168 sec. to  754.232 sec.
Spectral model in the cutoff power-law:
------------------------------------------------------------
Parameters  : value       lower 90%   higher 90%
Photon index: -0.974494     ( -0.628387   0.886903 )
Epeak [keV] : 90.4134      ( -32.0228 -90.4143 )
Norm@50keV  : 1.11878E-03    ( -0.000582038   0.00210867 )
------------------------------------------------------------
#Fit statistic  : Chi-Squared                   55.35     using 59 bins.
 Reduced chi-squared = 0.988393
# Null hypothesis probability of 5.00e-01 with 56 degrees of freedom

Photon flux (15-150 keV)    in 778.4 sec: 7.12245E-02 ( -0.0085652  0.0085508 ) ph/cm2/s
Energy fluence (15-150 keV)             : 4.07702e-06 ( -6.15211e-07  6.23144e-07 ) ergs/cm2
1-s peak spectrum fit
Power-law model

Time interval is from    0.860 sec. to    1.860 sec.

Spectral model in power-law:
------------------------------------------------------------
Parameters  : value       lower 90%   higher 90%
Photon index: -0.973056     ( -0.299061   0.322939 )
Norm@50keV  : 1.58033E-02    ( -0.0028848   0.00281555 )
------------------------------------------------------------
#Fit statistic  : Chi-Squared                   49.08     using 59 bins.
 Reduced chi-squared = 0.861053
# Null hypothesis probability of 7.63e-01 with 57 degrees of freedom

Photon flux (15-150 keV)    in 1 sec: 1.81712 ( -0.3337  0.33668 ) ph/cm2/s
Energy fluence (15-150 keV)             : 1.72568e-07 ( -3.00663e-08  3.01209e-08 ) ergs/cm2
Cutoff power-law model
Time interval is from    0.860 sec. to    1.860 sec.
Spectral model in the cutoff power-law:
------------------------------------------------------------
Parameters  : value       lower 90%   higher 90%
Photon index: -0.966644     ( -0.393493   1.15341 )
Epeak [keV] : 9998.71      ( -9998.71 -9998.71 )
Norm@50keV  : 1.59009E-02    ( -0.00270481   0.0308711 )
------------------------------------------------------------
#Fit statistic  : Chi-Squared                   49.08     using 59 bins.
 Reduced chi-squared = 0.876429
# Null hypothesis probability of 7.32e-01 with 56 degrees of freedom

Photon flux (15-150 keV)    in 1 sec: 1.81785 ( -0.34314  0.33566 ) ph/cm2/s
Energy fluence (15-150 keV)             : 2.21243e-08 ( 0  0 ) ergs/cm2
Time-resolved spectra
Distribution
T90 vs. Hardness ratio plot
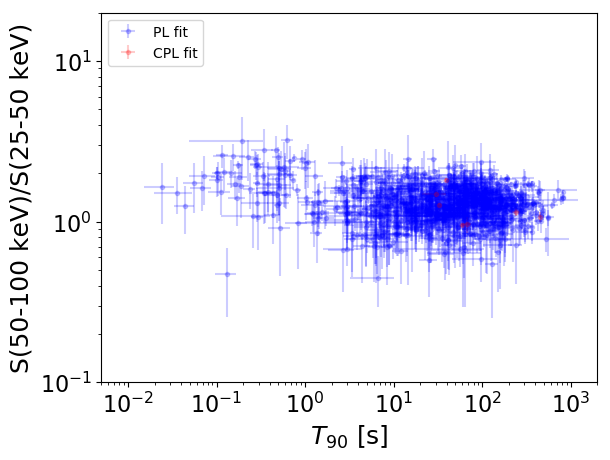
T90                                   = N/A sec.
Hardness ratio (energy fluence ratio) = N/A
S(15-50 keV) vs. S(50-150 keV) plot
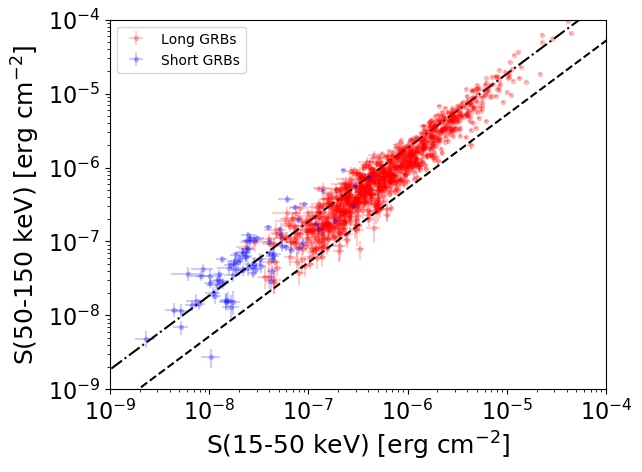
S(15-50 keV)  = N/A
S(50-150 keV) = N/A
The dash-dotted line and the dashed line traces the fluences calculated from the Band function with Epeak = 15 and 150 keV, respectively. Both lines assume a canonical values of alpha = -1 and beta = -2.5.
Mask shadow pattern
IMX = 3.768542499992261E-01, IMY = -5.280474768247337E-01
Spacecraft aspect plot
Bright source in the pre-burst/pre-slew/post-slew images
Pre-burst image of 15-350 keV band
Time interval of the image:
-239.992000 -24.168000

# RAcent  DECcent POSerr Theta    Phi  PeakCts   SNR AngSep     Name
#  [deg]    [deg]    ['] [deg]  [deg]                   [']
170.0713 -60.5961   14.2  38.3 -103.5   0.7185   0.8    7.4	Cen X-3
186.6478 -62.7684    0.8  33.6  -92.2   6.8538  13.7    0.3	GX 301-2
256.1290 -37.8431   33.2  42.5  -11.2   0.1334   0.3    6.7	4U 1700-377
256.3925 -36.4379    7.5  43.9  -10.5   0.6403   1.6    2.3	GX 349+2
263.0780 -24.6921   13.3  54.4   -0.3  -0.7140  -0.9    4.9	GX 1+4
264.9059 -44.3913    5.6  34.8   -3.0  -0.6328  -2.1    7.8	4U 1735-44
270.2333 -25.1158    5.2  53.2    7.6   1.8114   2.2    3.5	GX 5-1
270.2808 -25.7419    3.6  52.5    7.6   2.3344   3.2    1.2	GRS 1758-258
275.9810 -30.4144   13.6  47.3   13.4   0.4491   0.9    4.1	H1820-303
285.1952 -24.9315    6.9  52.2   24.7   1.8737   1.7    8.7	HT1900.1-2455
263.1193 -33.8529    5.3  45.4   -2.1  -1.0236  -2.2    6.6	GX 354-0
  3.5473 -52.0283    2.8  35.0  121.9   1.9714   4.1 ------	UNKNOWN
304.5839 -53.6105    2.9  23.5   50.2   1.1915   4.0 ------	UNKNOWN
 60.5213 -45.8321    3.3  52.6  170.5   3.0632   3.5 ------	UNKNOWN
Pre-slew background subtracted image of 15-350 keV band
Time interval of the image:
-24.168000 27.308600

# RAcent  DECcent POSerr Theta    Phi  PeakCts   SNR AngSep     Name
#  [deg]    [deg]    ['] [deg]  [deg]                   [']
170.5611 -60.6580    5.7  38.2 -103.2   0.5762   2.0    7.5	Cen X-3
186.8020 -62.6311    3.4  33.7  -92.0   0.6939   3.4    9.3	GX 301-2
256.0212 -37.6934    5.2  42.7  -11.3   0.3830   2.2    9.2	4U 1700-377
256.3516 -36.4816    4.6  43.8  -10.6  -0.4377  -2.5    5.4	GX 349+2
262.9171 -24.7798    4.8  54.4   -0.5  -0.9289  -2.4    5.4	GX 1+4
264.6775 -44.4998    4.0  34.7   -3.3  -0.4046  -2.9    4.1	4U 1735-44
270.1547 -25.0206    5.8  53.3    7.6   0.7599   2.0    7.9	GX 5-1
270.2465 -25.7506   27.0  52.5    7.6  -0.1521  -0.4    3.1	GRS 1758-258
276.0212 -30.4882    6.0  47.2   13.5  -0.4807  -1.9    8.8	H1820-303
284.9479 -24.9875    7.1  52.1   24.4   0.8212   1.6    6.3	HT1900.1-2455
263.0702 -33.9380    8.8  45.3   -2.2   0.2666   1.3    7.4	GX 354-0
309.0539 -44.4229    0.6  33.0   54.5   3.8120  19.0 ------	UNKNOWN
298.0850 -41.7917    2.0  35.1   39.9   1.1575   5.7 ------	UNKNOWN
269.9521 -56.0024    2.4  22.7   -1.9   0.5351   4.8 ------	UNKNOWN
253.0708 -21.6706    2.5  58.9  -10.5   3.1832   4.7 ------	UNKNOWN
239.5985 -47.9374    2.0  36.0  -33.9   0.9162   5.9 ------	UNKNOWN
Post-slew image of 15-350 keV band
Time interval of the image:
80.508590 408.508600

# RAcent  DECcent POSerr Theta    Phi  PeakCts   SNR AngSep     Name
#  [deg]    [deg]    ['] [deg]  [deg]                   [']
255.8049 -37.8900   12.3  39.9  -59.1   0.7669   0.9    9.0	4U 1700-377
256.4317 -36.3599   14.6  40.2  -56.6   0.6443   0.8    3.8	GX 349+2
262.9701 -24.6122   17.9  42.1  -37.0  -0.4362  -0.6    8.3	GX 1+4
264.9633 -44.5510    0.0  31.0  -65.4  -0.9024  -1.7   11.2	4U 1735-44
268.2693  -1.4194    6.0  56.1  -11.3  -2.2286  -1.9    6.2	SW J1753.5-0127
270.4505 -25.1707    0.0  36.6  -30.6   0.2121   0.4   10.6	GX 5-1
270.3901 -25.8647   24.6  36.2  -31.6   0.2366   0.5    8.7	GRS 1758-258
273.9539 -14.0213    6.7  42.6  -14.9   0.9610   1.7    3.2	GX 17+2
276.0954 -30.3837    8.5  29.4  -32.1   0.6250   1.4    8.9	H1820-303
284.9445 -24.8394    9.2  27.7  -12.3  -0.4770  -1.3    7.0	HT1900.1-2455
263.1575 -33.8645   23.6  36.6  -48.7   0.3135   0.5    8.6	GX 354-0
 13.2436 -37.5502    3.3  47.7  145.8   4.5954   3.4 ------	UNKNOWN
263.7007  -6.7356    3.1  54.5  -19.6   4.2174   3.7 ------	UNKNOWN
242.4253 -62.6868    2.4  41.2  -99.7   7.1813   4.9 ------	UNKNOWN