Analysis Summary
Notes:
- 1) No attempt has been made to eliminate the non-significant decimal places.
- 2) This batgrbproduct analysis is done using the HEASARC data.
- 3) This batgrbproduct analysis is using the flight position for the mask-weighting calculation.
======================================================================
                  BAT GRB EVENT DATA PROCESSING REPORT
    Process Script Ver: batgrbproduct v2.48
    Process Start Time: Mon Oct 24 00:30:44 EDT 2022
             Host Name: batproc1
   Current Working Dir: /local/data/bat1/alien/Swift_3rdBATcatalog/event/batevent_reproc/trigger1072990
======================================================================

  Trigger: 01072990      Segment: 000

  BAT Trigger Time: 653137299.264   [s; MET]
      Trigger Stop: 653137299.776   [s; MET]
               UTC: 2021-09-12T11:01:11.549600    [includes UTCF correction]
       Where From?: TDRSS position message

  BAT
    RA: 129.768773811578   Dec: 79.1940996457089  [deg; J2000]

     Catalogged Source?: NO
     Point Source?:      YES
     GRB Indicated?:     YES    [ by BAT flight software ]
     Image S/N Ratio:    7.29
     Image Trigger?:     NO
     Rate S/N Ratio:     15.8429795177549  [ if not an image trigger ]
     Image S/N Ratio:    7.29

  Analysis Position:   [ source = BAT ]
    RA: 129.768773811578   Dec: 79.1940996457089  [deg; J2000]

  Refined Position:   [ source = BAT pre-slew burst ]
    RA: 129.872933703937   Dec: 79.2186019874407  [deg; J2000]
        { 08h 39m 29.5s , +79d 13' 07.0" }
         +/- 1.21388932001449 [arcmin] (estimated 90% radius based on SNR)
         +/- 0.43769455888611 [arcmin] (formal 1-sigma fit error)
    SNR: 23.0601716934487

  Angular difference between the analysis and refined position is 1.879120 arcmin

  Partial Coding Fraction: 1.03125    [ including projection effects ]

  Duration
     T90: 20.6959999799728 +/- 3.60535157017626
        Measured from: -14.8000000715256
                   to: 5.89599990844727     [s; relative to TRIGTIME]
     T50: 6.93999993801117 +/- 2.26649068239638
        Measured from: -4.48800003528595
                   to: 2.45199990272522     [s; relative to TRIGTIME]


  Fluence
     Peak Flux  (peak 1 second)
        Measured from: 0.21999990940094
                   to: 1.21999990940094     [s; relative to TRIGTIME]
     Total Fluence
        Measured from: -19.3600000143051
                   to: 7.10399997234344     [s; relative to TRIGTIME]

             Band 1     Band 2     Band 3     Band 4
              15-25      25-50     50-100    100-350     keV
 Total     0.442177   0.689354   0.452738   0.099385
           0.035136   0.037011   0.032812   0.028930 [error]
 Peak      0.049324   0.106541   0.054929   0.017654
           0.007673   0.008471   0.007351   0.006310 [error]

     [ fluence units of on-axis counts / fully illuminated detector ]

======================================================================


====== Table of the duration information =============================

        Value   tstart    tstop
T100   26.464  -19.360    7.104
T90    20.696  -14.800    5.896
T50     6.940   -4.488    2.452
Peak    1.000    0.220    1.220


====== Spectral Analysis Summary =====================================

Model      : spectral model: simple power-law (PL) and cutoff power-law (CPL)
Ph_index   : photon index: E^{Ph_index}
Ph_90err   : 90% error of the photon index
Epeak      : Epeak in keV
Epeak_90err: 90% error of Epeak
Norm       : normalization at 50 keV in both the PL model and CPL model
Nomr_90err : 90% error of the normalization
chi2       : Chi-Squared
dof        : degree of freedo

=== Time-averaged spectral analysis ===
(Best model with acceptable fit: N/A)

Model Ph_index Ph_90err_low Ph_90err_hi  Epeak  Epeak_90err_low  Epeak_90err_hi  Norm       Nomr_90err_low    Norm_90err_hi    chi2    dof
PL      -1.477    -0.114      0.113       -           -               -         3.99e-03     -2.70e-04          2.69e-04      63.730   57
CPL     -0.737    -0.487      0.553       82.522     -17.480        64.465      9.63e-03     -4.15e-03          8.73e-03      56.590   56


=== 1-s peak spectral analysis ===
(Best model with acceptable fit: N/A)

Model Ph_index Ph_90err_low Ph_90err_hi  Epeak  Epeak_90err_low  Epeak_90err_hi  Norm       Nomr_90err_low    Norm_90err_hi    chi2    dof
PL      -1.403     -0.169     0.168       -           -               -         1.37e-02     -1.54e-03          1.53e-03      74.590   57
CPL      0.755     -1.015     1.347       56.613      -8.437        15.018      2.11e-01     -2.11e-01          9.93e-01      57.700   56


=== Fluence/Peak Flux Summary ===

              Model    Band1     Band2     Band3     Band4     Band5     Total
                       15-25     25-50    50-100    100-350    15-150    15-350    keV
Fluence         PL   1.32e-07  2.46e-07  3.54e-07  1.08e-06  1.01e-06  1.81e-06   erg/cm2
      90%_error_low -1.42e-08 -1.66e-08 -3.13e-08 -1.90e-07 -7.53e-08 -2.17e-07   erg/cm2
      90%_error_hi   1.46e-08  1.65e-08  3.13e-08  2.16e-07  7.61e-08  2.39e-07   erg/cm2
Peak flux       PL   5.12e-01  5.46e-01  4.13e-01  5.08e-01  1.66e+00  1.98e+00   ph/cm2/s
      90%_error_low -8.61e-02 -6.22e-02 -5.66e-02 -1.23e-01 -1.82e-01 -2.25e-01   ph/cm2/s
      90%_error_hi   8.95e-02  6.20e-02  5.65e-02  1.46e-01  1.82e-01  2.28e-01   ph/cm2/s

Fluence        CPL   1.18e-07  2.65e-07  3.63e-07  3.79e-07  9.41e-07  1.13e-06   erg/cm2
      90%_error_low -1.70e-08 -2.09e-08 -3.47e-08 -1.72e-07 -8.57e-08 -1.91e-07   erg/cm2
      90%_error_hi   1.72e-08  2.15e-08  3.48e-08  3.44e-07  8.68e-08  3.47e-07   erg/cm2
Peak flux      CPL   3.95e-01  6.87e-01  4.24e-01  6.45e-02  1.56e+00  1.57e+00   ph/cm2/s
      90%_error_low -9.87e-02 -9.12e-02 -8.31e-02     N/A   -1.85e-01 -1.89e-01   ph/cm2/s
      90%_error_hi   1.03e-01  9.70e-02  7.53e-02     N/A    1.86e-01  1.96e-01   ph/cm2/s

======================================================================
Image
Pre-slew 15.0-350.0 keV image (Event data)
#   RAcent    DECcent   POSerr    Theta     Phi              Peak Cts       SNR   Name
  129.8729    79.2186   0.0083     7.6661  -153.7391         1.6569498     23.060 TRIG_01072990

Foreground time interval of the image:
-19.360   7.104 (delta_t =  26.464 [sec])
Background time interval of the image:
-239.264 -19.360 (delta_t = 219.904 [sec])
Light Curves
Note: The mask-weighted lightcurves have units of either count/det or counts/sec/det, where a det is 0.4 x 0.4 = 0.16 sq cm.
Full-time range; 1 s binning
Other quick-look light curves:
- 64 ms binning (zoomed)
- 16 ms binning (zoomed)
- 8 ms binning (zoomed)
- 2 ms binning (zoomed)
- SN=5 or 10 s binning (full-time range)
- Raw light curve
Spectra
- 64 ms binning (zoomed)
- 16 ms binning (zoomed)
- 8 ms binning (zoomed)
- 2 ms binning (zoomed)
- SN=5 or 10 s binning (full-time range)
- Raw light curve
Spectra
Notes:
- 1) The fitting includes the systematic errors.
- 2) When the burst includes telescope slew time periods, the fitting uses an average response file made from multiple 5-s response files through out the slew time plus single time preiod for the non-slew times, and weighted by the total counts in the corresponding time period using addrmf. An average response file is needed becuase a spectral fit using the pre-slew DRM will introduce some errors in both a spectral shape and a normalization if the PHA file contains a lot of the slew/post-slew time interval.
- 3) For fits to more complicated models (e.g. a power-law over a cutoff power-law), the BAT team has decided to require a chi-square improvement of more than 6 for each extra dof.
Time averaged spectrum fit using the average DRM
Power-law model
Time interval is from  -19.360 sec. to    7.104 sec.

Spectral model in power-law:
------------------------------------------------------------
Parameters  : value       lower 90%   higher 90%
Photon index: -1.47705     ( -0.114325   0.11344 )
Norm@50keV  : 3.99458E-03    ( -0.000269937   0.000268798 )
------------------------------------------------------------
#Fit statistic  : Chi-Squared                   63.73     using 59 bins.
 Reduced chi-squared = 1.11807
# Null hypothesis probability of 2.52e-01 with 57 degrees of freedom

Photon flux (15-150 keV)    in 26.46 sec: 0.495678 ( -0.03255  0.032573 ) ph/cm2/s
Energy fluence (15-150 keV)             : 1.0067e-06 ( -7.53351e-08  7.60791e-08 ) ergs/cm2
Cutoff power-law model
Time interval is from  -19.360 sec. to    7.104 sec.
Spectral model in the cutoff power-law:
------------------------------------------------------------
Parameters  : value       lower 90%   higher 90%
Photon index: -0.73652     ( -0.487048   0.552903 )
Epeak [keV] : 82.5220      ( -17.4804 64.4651 )
Norm@50keV  : 9.62503E-03    ( -0.00415399   0.00872724 )
------------------------------------------------------------
#Fit statistic  : Chi-Squared                   56.59     using 59 bins.
 Reduced chi-squared = 1.01054
# Null hypothesis probability of 4.53e-01 with 56 degrees of freedom

Photon flux (15-150 keV)    in 26.46 sec: 0.478293 ( -0.034464  0.03443 ) ph/cm2/s
Energy fluence (15-150 keV)             : 9.41045e-07 ( -8.5742e-08  8.68057e-08 ) ergs/cm2
1-s peak spectrum fit
Power-law model
Time interval is from    0.220 sec. to    1.220 sec.

Spectral model in power-law:
------------------------------------------------------------
Parameters  : value       lower 90%   higher 90%
Photon index: -1.40289     ( -0.169199   0.168271 )
Norm@50keV  : 1.36618E-02    ( -0.00153781   0.00153151 )
------------------------------------------------------------
#Fit statistic  : Chi-Squared                   74.59     using 59 bins.
 Reduced chi-squared = 1.3086
# Null hypothesis probability of 5.89e-02 with 57 degrees of freedom

Photon flux (15-150 keV)    in 1 sec: 1.66490 ( -0.18193  0.182 ) ph/cm2/s
Energy fluence (15-150 keV)             : 1.31941e-07 ( -1.63936e-08  1.66149e-08 ) ergs/cm2
Cutoff power-law model
Time interval is from    0.220 sec. to    1.220 sec.
Spectral model in the cutoff power-law:
------------------------------------------------------------
Parameters  : value       lower 90%   higher 90%
Photon index: 0.755416     ( -1.01545   1.34676 )
Epeak [keV] : 56.6132      ( -8.42759 15.0279 )
Norm@50keV  : 0.210544    ( -0.210856   0.992786 )
------------------------------------------------------------
#Fit statistic  : Chi-Squared                   57.70     using 59 bins.
 Reduced chi-squared = 1.03036
# Null hypothesis probability of 4.12e-01 with 56 degrees of freedom

Photon flux (15-150 keV)    in 1 sec: 1.56315 ( -0.18484  0.1862 ) ph/cm2/s
Energy fluence (15-150 keV)             : 1.08883e-07 ( -1.68741e-08  1.8479e-08 ) ergs/cm2
Time-resolved spectra
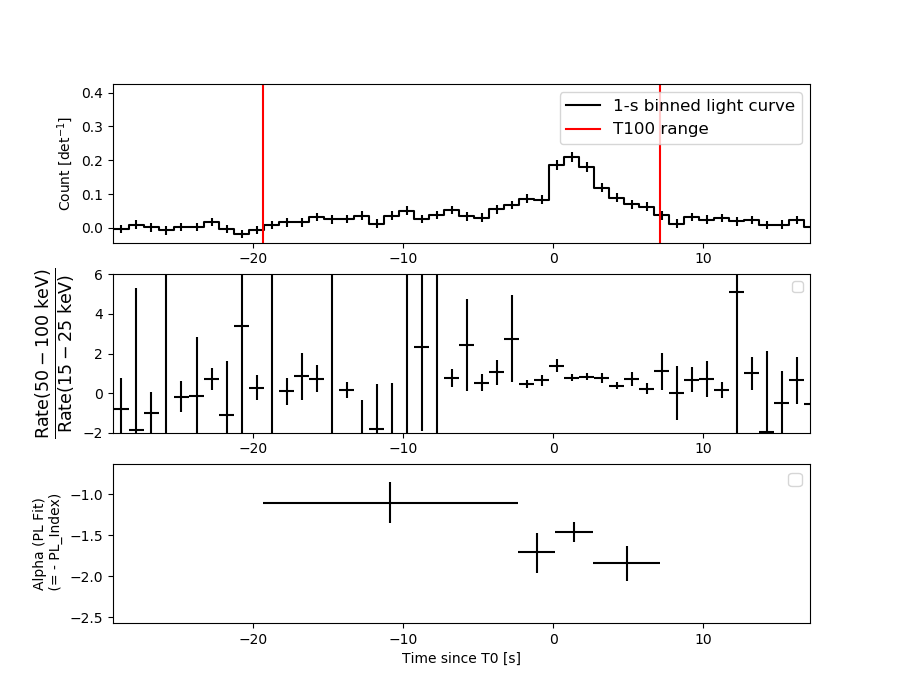
Distribution
T90 vs. Hardness ratio plot
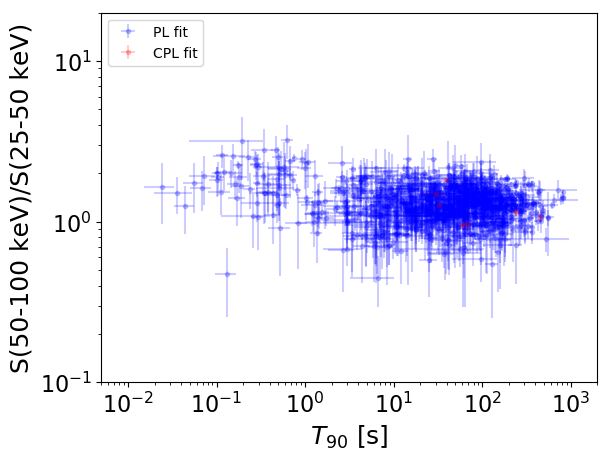
T90                                   = N/A sec.
Hardness ratio (energy fluence ratio) = N/A
S(15-50 keV) vs. S(50-150 keV) plot
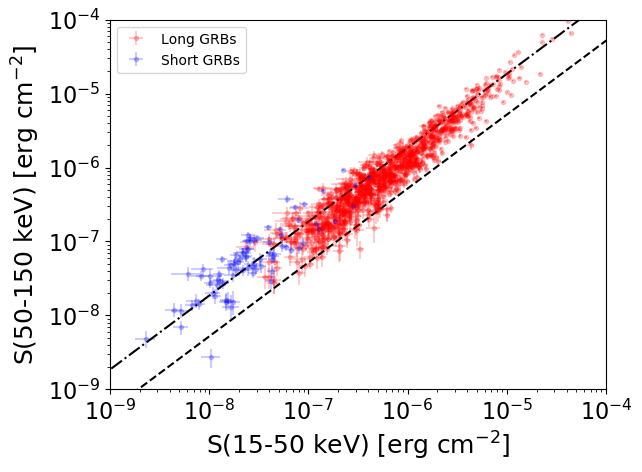
S(15-50 keV)  = N/A
S(50-150 keV) = N/A
The dash-dotted line and the dashed line traces the fluences calculated from the Band function with Epeak = 15 and 150 keV, respectively. Both lines assume a canonical values of alpha = -1 and beta = -2.5.
Mask shadow pattern
IMX = -1.207106120989392E-01, IMY = 5.955634539474253E-02
Spacecraft aspect plot
Bright source in the pre-burst/pre-slew/post-slew images
Pre-burst image of 15-350 keV band
Time interval of the image:
-239.264000 -19.360000

# RAcent  DECcent POSerr Theta    Phi  PeakCts   SNR AngSep     Name
#  [deg]    [deg]    ['] [deg]  [deg]                   [']
 83.6291  22.0059    1.6  53.4    9.5   7.1992   7.2    0.6	Crab
332.5040  57.8261    2.9  43.7  131.1   3.9779   4.0 ------	UNKNOWN
323.7671  57.4766    2.4  45.4  137.4   4.7195   4.7 ------	UNKNOWN
248.7316  45.8066    2.9  57.6 -165.4   5.2315   4.0 ------	UNKNOWN
175.9986  55.9388    3.2  32.6 -110.0   1.7869   3.6 ------	UNKNOWN
Pre-slew background subtracted image of 15-350 keV band
Time interval of the image:
-19.360000 7.104000

# RAcent  DECcent POSerr Theta    Phi  PeakCts   SNR AngSep     Name
#  [deg]    [deg]    ['] [deg]  [deg]                   [']
 83.7423  21.9611    8.9  53.5    9.3   0.3549   1.3    6.9	Crab
268.2583  55.2001    2.8  50.0  177.9   0.7665   4.1 ------	UNKNOWN
129.8730  79.2186    0.5   7.7 -153.7   1.6570  23.1 ------	UNKNOWN
237.7426  42.4577    2.3  59.3 -155.5   2.2358   5.1 ------	UNKNOWN
Post-slew image of 15-350 keV band
Time interval of the image:
41.036600 622.236600

# RAcent  DECcent POSerr Theta    Phi  PeakCts   SNR AngSep     Name
#  [deg]    [deg]    ['] [deg]  [deg]                   [']
355.9641  57.4708    2.5  40.7   95.7   7.6330   4.7 ------	UNKNOWN
277.6848  57.9601    3.2  41.6  157.3   3.8934   3.6 ------	UNKNOWN
265.5633  62.1002    3.1  36.4  165.6   2.7764   3.7 ------	UNKNOWN
240.5129  36.8428    2.9  57.6 -165.4  10.6867   4.0 ------	UNKNOWN
104.3884  25.8576    4.9  54.5  -19.6   4.0815   2.4 ------	UNKNOWN