Analysis Summary
Notes:
- 1) No attempt has been made to eliminate the non-significant decimal places.
- 2) This batgrbproduct analysis is done using the HEASARC data.
- 3) This batgrbproduct analysis is using the flight position for the mask-weighting calculation.
======================================================================
                  BAT GRB EVENT DATA PROCESSING REPORT
    Process Script Ver: batgrbproduct v2.48
    Process Start Time: Mon Oct 24 00:26:35 EDT 2022
             Host Name: batproc1
   Current Working Dir: /local/data/bat1/alien/Swift_3rdBATcatalog/event/batevent_reproc/trigger1075565
======================================================================

  Trigger: 01075565      Segment: 000

  BAT Trigger Time: 654662840   [s; MET]
      Trigger Stop: 654662904   [s; MET]
               UTC: 2021-09-30T02:46:52.183340    [includes UTCF correction]
       Where From?: TDRSS position message

  BAT
    RA: 197.435314036749   Dec: 48.6229469478518  [deg; J2000]

     Catalogged Source?: NO
     Point Source?:      YES
     GRB Indicated?:     YES    [ by BAT flight software ]
     Image S/N Ratio:    7.5
     Image Trigger?:     YES
     Rate S/N Ratio:     0  [ if not an image trigger ]
     Image S/N Ratio:    7.5

  Analysis Position:   [ source = BAT ]
    RA: 197.435314036749   Dec: 48.6229469478518  [deg; J2000]

  Refined Position:   [ source = BAT pre-slew burst ]
    RA: 197.414607591782   Dec: 48.6297429062774  [deg; J2000]
        { 13h 09m 39.5s , +48d 37' 47.1" }
         +/- 1.56526689105116 [arcmin] (estimated 90% radius based on SNR)
         +/- 0.659913758544728 [arcmin] (formal 1-sigma fit error)
    SNR: 16.037436610934

  Angular difference between the analysis and refined position is 0.916841 arcmin

  Partial Coding Fraction: 1    [ including projection effects ]

  Duration
     T90: 11.8119999170303 +/- 1.94082558518738
        Measured from: 6.52799999713898
                   to: 18.3399999141693     [s; relative to TRIGTIME]
     T50: 5.53999996185303 +/- 1.23482786623791
        Measured from: 8.73199999332428
                   to: 14.2719999551773     [s; relative to TRIGTIME]


  Fluence
     Peak Flux  (peak 1 second)
        Measured from: 8.39999997615814
                   to: 9.39999997615814     [s; relative to TRIGTIME]
     Total Fluence
        Measured from: 5.83599996566772
                   to: 19.2359999418259     [s; relative to TRIGTIME]

             Band 1     Band 2     Band 3     Band 4
              15-25      25-50     50-100    100-350     keV
 Total     0.204113   0.271806   0.161394   0.033417
           0.023288   0.024056   0.020767   0.017774 [error]
 Peak      0.036767   0.024888   0.022519   0.010085
           0.006672   0.006903   0.006052   0.004993 [error]

     [ fluence units of on-axis counts / fully illuminated detector ]

======================================================================


====== Table of the duration information =============================

        Value   tstart    tstop
T100   13.400    5.836   19.236
T90    11.812    6.528   18.340
T50     5.540    8.732   14.272
Peak    1.000    8.400    9.400


====== Spectral Analysis Summary =====================================

Model      : spectral model: simple power-law (PL) and cutoff power-law (CPL)
Ph_index   : photon index: E^{Ph_index}
Ph_90err   : 90% error of the photon index
Epeak      : Epeak in keV
Epeak_90err: 90% error of Epeak
Norm       : normalization at 50 keV in both the PL model and CPL model
Nomr_90err : 90% error of the normalization
chi2       : Chi-Squared
dof        : degree of freedo

=== Time-averaged spectral analysis ===
(Best model with acceptable fit: N/A)

Model Ph_index Ph_90err_low Ph_90err_hi  Epeak  Epeak_90err_low  Epeak_90err_hi  Norm       Nomr_90err_low    Norm_90err_hi    chi2    dof
PL      -1.578    -0.191      0.187       -           -               -         3.22e-03     -3.55e-04          3.51e-04      51.430   57
CPL     -1.536    -1.088      0.778      482.509    -482.509      -482.509      3.39e-03     -2.23e-03          5.15e-03      51.430   56


=== 1-s peak spectral analysis ===
(Best model with acceptable fit: N/A)

Model Ph_index Ph_90err_low Ph_90err_hi  Epeak  Epeak_90err_low  Epeak_90err_hi  Norm       Nomr_90err_low    Norm_90err_hi    chi2    dof
PL      -1.758     -0.518     0.447       -           -               -         5.27e-03     -1.54e-03          1.39e-03      47.640   57
CPL     -1.750     -0.527     0.443     9999.340    -9999.330      -9999.340      5.29e-03     -3.16e-03          1.53e-03      47.640   56


=== Fluence/Peak Flux Summary ===

              Model    Band1     Band2     Band3     Band4     Band5     Total
                       15-25     25-50    50-100    100-350    15-150    15-350    keV
Fluence         PL   5.93e-08  1.04e-07  1.39e-07  3.82e-07  4.05e-07  6.85e-07   erg/cm2
      90%_error_low -9.93e-09 -1.09e-08 -2.06e-08 -1.08e-07 -4.84e-08 -1.27e-07   erg/cm2
      90%_error_hi   1.03e-08  1.09e-08  2.06e-08  1.34e-07  4.90e-08  1.48e-07   erg/cm2
Peak flux       PL   2.78e-01  2.40e-01  1.42e-01  1.26e-01  7.15e-01  7.86e-01   ph/cm2/s
      90%_error_low -9.66e-02 -5.36e-02 -5.44e-02 -7.57e-02 -1.59e-01 -1.81e-01   ph/cm2/s
      90%_error_hi   1.05e-01  5.35e-02  5.26e-02  1.19e-01  1.59e-01  1.84e-01   ph/cm2/s

Fluence        CPL   5.90e-08  1.04e-07  1.39e-07  3.57e-07  4.03e-07  6.59e-07   erg/cm2
      90%_error_low -1.16e-08 -1.13e-08 -2.08e-08 -2.45e-07 -5.55e-08 -2.52e-07   erg/cm2
      90%_error_hi   9.12e-09  1.40e-08  2.14e-08  5.38e-08  5.00e-08  2.94e-07   erg/cm2
Peak flux      CPL   2.60e-01  1.63e-01  6.96e-02  4.81e-02  5.14e-01  5.43e-01   ph/cm2/s
      90%_error_low -1.12e-01 -1.63e-01 -6.96e-02 -4.81e-02 -3.40e-01 -2.38e-01   ph/cm2/s
      90%_error_hi   1.24e-01  7.55e-02  5.34e-02  5.67e-02  2.11e-01  2.68e-01   ph/cm2/s

======================================================================
Image
Pre-slew 15.0-350.0 keV image (Event data)
#   RAcent    DECcent   POSerr    Theta     Phi              Peak Cts       SNR   Name
  197.4146    48.6297   0.0121    19.0169  -159.4010         0.7158844     16.037 TRIG_01075565

Foreground time interval of the image:
  5.836  19.236 (delta_t =  13.400 [sec])
Background time interval of the image:
-239.000   5.836 (delta_t = 244.836 [sec])
Light Curves
Note: The mask-weighted lightcurves have units of either count/det or counts/sec/det, where a det is 0.4 x 0.4 = 0.16 sq cm.
Full-time range; 1 s binning
Other quick-look light curves:
- 64 ms binning (zoomed)
- 16 ms binning (zoomed)
- 8 ms binning (zoomed)
- 2 ms binning (zoomed)
- SN=5 or 10 s binning (full-time range)
- Raw light curve
Spectra
- 64 ms binning (zoomed)
- 16 ms binning (zoomed)
- 8 ms binning (zoomed)
- 2 ms binning (zoomed)
- SN=5 or 10 s binning (full-time range)
- Raw light curve
Spectra
Notes:
- 1) The fitting includes the systematic errors.
- 2) When the burst includes telescope slew time periods, the fitting uses an average response file made from multiple 5-s response files through out the slew time plus single time preiod for the non-slew times, and weighted by the total counts in the corresponding time period using addrmf. An average response file is needed becuase a spectral fit using the pre-slew DRM will introduce some errors in both a spectral shape and a normalization if the PHA file contains a lot of the slew/post-slew time interval.
- 3) For fits to more complicated models (e.g. a power-law over a cutoff power-law), the BAT team has decided to require a chi-square improvement of more than 6 for each extra dof.
Time averaged spectrum fit using the average DRM
Power-law model
Time interval is from    5.836 sec. to   19.236 sec.

Spectral model in power-law:
------------------------------------------------------------
Parameters  : value       lower 90%   higher 90%
Photon index: -1.57847     ( -0.190551   0.186826 )
Norm@50keV  : 3.22158E-03    ( -0.000355107   0.00035057 )
------------------------------------------------------------
#Fit statistic  : Chi-Squared                   51.43     using 59 bins.
 Reduced chi-squared = 0.902281
# Null hypothesis probability of 6.83e-01 with 57 degrees of freedom

Photon flux (15-150 keV)    in 13.4 sec: 0.411287 ( -0.042606  0.042661 ) ph/cm2/s
Energy fluence (15-150 keV)             : 4.04878e-07 ( -4.8374e-08  4.90474e-08 ) ergs/cm2
Cutoff power-law model
Time interval is from    5.836 sec. to   19.236 sec.
Spectral model in the cutoff power-law:
------------------------------------------------------------
Parameters  : value       lower 90%   higher 90%
Photon index: -1.53584     ( -1.08564   0.779672 )
Epeak [keV] : 482.509      ( -559.235 -559.235 )
Norm@50keV  : 3.39190E-03    ( -0.00221677   0.00516008 )
------------------------------------------------------------
#Fit statistic  : Chi-Squared                   51.43     using 59 bins.
 Reduced chi-squared = 0.918393
# Null hypothesis probability of 6.48e-01 with 56 degrees of freedom

Photon flux (15-150 keV)    in 13.4 sec: 0.410541 ( -0.044644  0.043261 ) ph/cm2/s
Energy fluence (15-150 keV)             : 4.0339e-07 ( -5.54973e-08  5.00139e-08 ) ergs/cm2
1-s peak spectrum fit
Power-law model
Time interval is from    8.400 sec. to    9.400 sec.

Spectral model in power-law:
------------------------------------------------------------
Parameters  : value       lower 90%   higher 90%
Photon index: -1.75819     ( -0.517679   0.447097 )
Norm@50keV  : 5.26864E-03    ( -0.00154216   0.00139155 )
------------------------------------------------------------
#Fit statistic  : Chi-Squared                   47.64     using 59 bins.
 Reduced chi-squared = 0.835789
# Null hypothesis probability of 8.07e-01 with 57 degrees of freedom

Photon flux (15-150 keV)    in 1 sec: 0.714606 ( -0.159157  0.159169 ) ph/cm2/s
Energy fluence (15-150 keV)             : 4.85993e-08 ( -1.38032e-08  1.4195e-08 ) ergs/cm2
Cutoff power-law model
Time interval is from    8.400 sec. to    9.400 sec.
Spectral model in the cutoff power-law:
------------------------------------------------------------
Parameters  : value       lower 90%   higher 90%
Photon index: -2.03879     ( -0.527073   0.443369 )
Epeak [keV] : 16.0173      ( -9999.35 -9999.36 )
Norm@50keV  : 3.58997E-03    ( -0.00146771   0.00322356 )
------------------------------------------------------------
#Fit statistic  : Chi-Squared                   46.85     using 59 bins.
 Reduced chi-squared = 0.836607
# Null hypothesis probability of 8.03e-01 with 56 degrees of freedom

Photon flux (15-150 keV)    in 1 sec: 0.514099 ( -0.33951  0.211065 ) ph/cm2/s
Energy fluence (15-150 keV)             : 3.48281e-08 ( -1.48631e-08  1.56009e-08 ) ergs/cm2
Time-resolved spectra
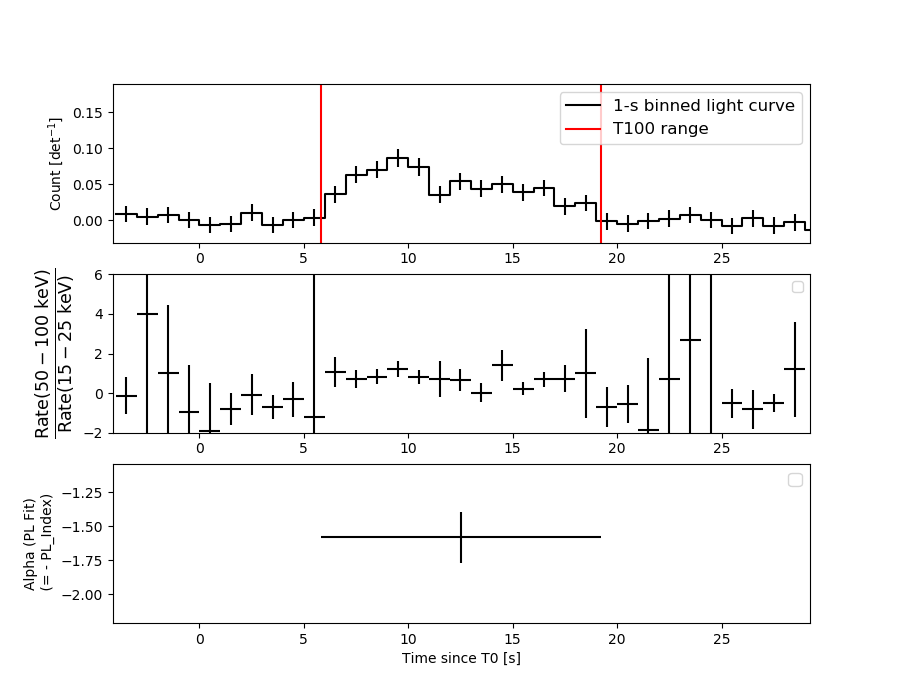
Distribution
T90 vs. Hardness ratio plot
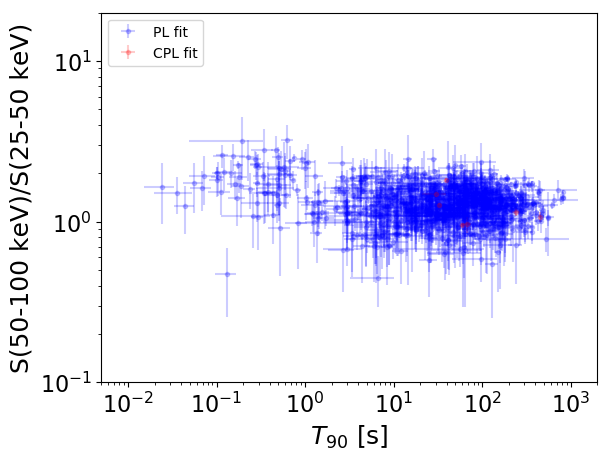
T90                                   = N/A sec.
Hardness ratio (energy fluence ratio) = N/A
S(15-50 keV) vs. S(50-150 keV) plot
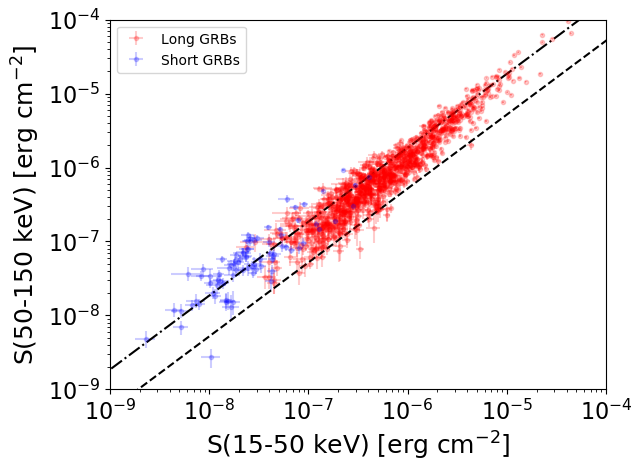
S(15-50 keV)  = N/A
S(50-150 keV) = N/A
The dash-dotted line and the dashed line traces the fluences calculated from the Band function with Epeak = 15 and 150 keV, respectively. Both lines assume a canonical values of alpha = -1 and beta = -2.5.
Mask shadow pattern
IMX = -3.226216663489579E-01, IMY = 1.212593203626557E-01
Spacecraft aspect plot
Bright source in the pre-burst/pre-slew/post-slew images
Pre-burst image of 15-350 keV band
Time interval of the image:
-239.000000 5.836000

# RAcent  DECcent POSerr Theta    Phi  PeakCts   SNR AngSep     Name
#  [deg]    [deg]    ['] [deg]  [deg]                   [']
244.0361  30.0979    3.0  58.7 -159.2   5.7947   3.8 ------	UNKNOWN
155.0536   1.4856    2.6  48.3  -39.4   2.8003   4.4 ------	UNKNOWN
174.0198   8.7464    2.5  39.9  -66.1   2.9121   4.7 ------	UNKNOWN
Pre-slew background subtracted image of 15-350 keV band
Time interval of the image:
5.836000 19.236000

# RAcent  DECcent POSerr Theta    Phi  PeakCts   SNR AngSep     Name
#  [deg]    [deg]    ['] [deg]  [deg]                   [']
197.4146  48.6298    0.7  19.0 -159.4   0.7160  16.0 ------	UNKNOWN
Post-slew image of 15-350 keV band
Time interval of the image:
123.700600 963.032100

# RAcent  DECcent POSerr Theta    Phi  PeakCts   SNR AngSep     Name
#  [deg]    [deg]    ['] [deg]  [deg]                   [']
254.5332  35.4622    9.6  43.3  162.2   1.8282   1.2    8.1	Her X-1
122.0348  52.6786    4.5  45.7   21.5   3.9434   2.6 ------	UNKNOWN
123.4650  29.3626    3.7  58.2   -3.8  13.6756   3.1 ------	UNKNOWN
127.5946  25.3796    3.7  58.2  -10.2  11.2050   3.1 ------	UNKNOWN
152.9388  16.4386    3.7  48.3  -39.4   5.0099   3.1 ------	UNKNOWN
219.4698   2.6441    2.7  49.7 -133.0  13.3056   4.2 ------	UNKNOWN