Analysis Summary
Notes:
- 1) No attempt has been made to eliminate the non-significant decimal places.
- 2) This batgrbproduct analysis is done using the HEASARC data.
- 3) This batgrbproduct analysis is using the flight position for the mask-weighting calculation.
======================================================================
BAT GRB EVENT DATA PROCESSING REPORT
Process Script Ver: batgrbproduct v2.48
Process Start Time: Mon Oct 24 00:24:28 EDT 2022
Host Name: batproc1
Current Working Dir: /local/data/bat1/alien/Swift_3rdBATcatalog/event/batevent_reproc/trigger1080859
======================================================================
Trigger: 01080859 Segment: 000
BAT Trigger Time: 656715980.096 [s; MET]
Trigger Stop: 656715981.12 [s; MET]
UTC: 2021-10-23T21:05:52.141400 [includes UTCF correction]
Where From?: TDRSS position message
BAT
RA: 170.3019869197 Dec: 39.1371095016785 [deg; J2000]
Catalogged Source?: NO
Point Source?: YES
GRB Indicated?: YES [ by BAT flight software ]
Image S/N Ratio: 9.67
Image Trigger?: NO
Rate S/N Ratio: 12.4498995979887 [ if not an image trigger ]
Image S/N Ratio: 9.67
Analysis Position: [ source = BAT ]
RA: 170.3019869197 Dec: 39.1371095016785 [deg; J2000]
Refined Position: [ source = BAT pre-slew burst ]
RA: 170.318614989687 Dec: 39.1343486420401 [deg; J2000]
{ 11h 21m 16.5s , +39d 08' 03.7" }
+/- 1.94217974123318 [arcmin] (estimated 90% radius based on SNR)
+/- 1.11420936953839 [arcmin] (formal 1-sigma fit error)
SNR: 11.7835555046331
Angular difference between the analysis and refined position is 0.791388 arcmin
Partial Coding Fraction: 0.4882812 [ including projection effects ]
Duration
T90: 1.29999995231628 +/- 0.265601194604809
Measured from: 0.0600000619888306
to: 1.36000001430511 [s; relative to TRIGTIME]
T50: 0.659999966621399 +/- 0.18070967842618
Measured from: 0.379999995231628
to: 1.03999996185303 [s; relative to TRIGTIME]
Fluence
Peak Flux (peak 1 second)
Measured from: 0.24400007724762
to: 1.24400007724762 [s; relative to TRIGTIME]
Total Fluence
Measured from: -0.0119999647140503
to: 1.45200002193451 [s; relative to TRIGTIME]
Band 1 Band 2 Band 3 Band 4
15-25 25-50 50-100 100-350 keV
Total 0.097766 0.124517 0.058621 0.011630
0.013685 0.014560 0.012216 0.009386 [error]
Peak 0.069063 0.110637 0.046207 0.010650
0.011281 0.012271 0.010199 0.007767 [error]
[ fluence units of on-axis counts / fully illuminated detector ]
======================================================================
====== Table of the duration information =============================
Value tstart tstop
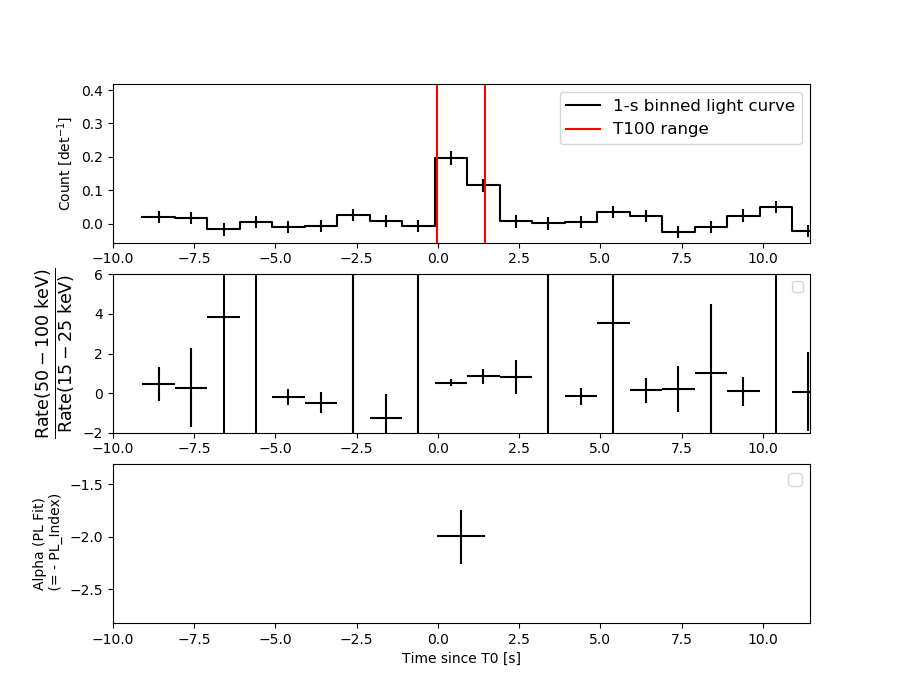
T100 1.464 -0.012 1.452
T90 1.300 0.060 1.360
T50 0.660 0.380 1.040
Peak 1.000 0.244 1.244
====== Spectral Analysis Summary =====================================
Model : spectral model: simple power-law (PL) and cutoff power-law (CPL)
Ph_index : photon index: E^{Ph_index}
Ph_90err : 90% error of the photon index
Epeak : Epeak in keV
Epeak_90err: 90% error of Epeak
Norm : normalization at 50 keV in both the PL model and CPL model
Nomr_90err : 90% error of the normalization
chi2 : Chi-Squared
dof : degree of freedo
=== Time-averaged spectral analysis ===
(Best model with acceptable fit: N/A)
Model Ph_index Ph_90err_low Ph_90err_hi Epeak Epeak_90err_low Epeak_90err_hi Norm Nomr_90err_low Norm_90err_hi chi2 dof
PL -1.993 -0.262 0.244 - - - 1.25e-02 -2.14e-03 2.07e-03 49.550 57
CPL -1.982 -0.246 1.110 64.171 -62.910 -64.171 1.27e-02 -7.71e-03 4.36e-02 49.550 56
=== 1-s peak spectral analysis ===
(Best model with acceptable fit: N/A)
Model Ph_index Ph_90err_low Ph_90err_hi Epeak Epeak_90err_low Epeak_90err_hi Norm Nomr_90err_low Norm_90err_hi chi2 dof
PL -1.951 -0.258 0.241 - - - 1.52e-02 -2.57e-03 2.49e-03 52.610 57
CPL -1.667 -0.512 1.262 50.934 -50.865 -50.934 2.20e-02 -1.20e-02 9.96e-02 52.360 56
=== Fluence/Peak Flux Summary ===
Model Band1 Band2 Band3 Band4 Band5 Total
15-25 25-50 50-100 100-350 15-150 15-350 keV
Fluence PL 3.72e-08 5.07e-08 5.09e-08 9.26e-08 1.69e-07 2.31e-07 erg/cm2
90%_error_low -7.26e-09 -7.02e-09 -1.15e-08 -3.59e-08 -2.69e-08 -5.03e-08 erg/cm2
90%_error_hi 7.48e-09 7.01e-09 1.16e-08 4.76e-08 2.73e-08 5.86e-08 erg/cm2
Peak flux PL 9.64e-01 7.44e-01 3.85e-01 2.87e-01 2.23e+00 2.38e+00 ph/cm2/s
90%_error_low -1.95e-01 -1.05e-01 -8.33e-02 -1.04e-01 -3.17e-01 -3.36e-01 ph/cm2/s
90%_error_hi 2.02e-01 1.05e-01 8.32e-02 1.32e-01 3.17e-01 3.36e-01 ph/cm2/s
Fluence CPL 3.71e-08 5.09e-08 5.09e-08 8.73e-08 1.68e-07 2.26e-07 erg/cm2
90%_error_low -7.77e-09 -1.24e-08 -1.09e-08 -7.24e-08 -3.04e-08 -8.15e-08 erg/cm2
90%_error_hi 7.90e-09 9.87e-09 1.18e-08 1.15e-07 2.76e-08 6.00e-08 erg/cm2
Peak flux CPL 9.39e-01 7.73e-01 3.88e-01 1.94e-01 2.21e+00 2.29e+00 ph/cm2/s
90%_error_low -2.15e-01 -1.28e-01 -7.90e-02 -1.94e-01 -3.21e-01 -3.69e-01 ph/cm2/s
90%_error_hi 2.12e-01 1.52e-01 8.88e-02 1.25e-01 3.20e-01 4.11e-01 ph/cm2/s
======================================================================
Image
Pre-slew 15.0-350.0 keV image (Event data)
#   RAcent    DECcent   POSerr    Theta     Phi              Peak Cts       SNR   Name
  170.3186    39.1343   0.0163    41.9099  -162.4949         0.2943256     11.784 TRIG_01080859

Foreground time interval of the image:
 -0.012   1.452 (delta_t =   1.464 [sec])
Background time interval of the image:
-239.096  -0.012 (delta_t = 239.084 [sec])
Light Curves
Note: The mask-weighted lightcurves have units of either count/det or counts/sec/det, where a det is 0.4 x 0.4 = 0.16 sq cm.
Full-time range; 1 s binning
Other quick-look light curves:
- 64 ms binning (zoomed)
- 16 ms binning (zoomed)
- 8 ms binning (zoomed)
- 2 ms binning (zoomed)
- SN=5 or 10 s binning (full-time range)
- Raw light curve
Spectra
- 64 ms binning (zoomed)
- 16 ms binning (zoomed)
- 8 ms binning (zoomed)
- 2 ms binning (zoomed)
- SN=5 or 10 s binning (full-time range)
- Raw light curve
Spectra
Notes:
- 1) The fitting includes the systematic errors.
- 2) When the burst includes telescope slew time periods, the fitting uses an average response file made from multiple 5-s response files through out the slew time plus single time preiod for the non-slew times, and weighted by the total counts in the corresponding time period using addrmf. An average response file is needed becuase a spectral fit using the pre-slew DRM will introduce some errors in both a spectral shape and a normalization if the PHA file contains a lot of the slew/post-slew time interval.
- 3) For fits to more complicated models (e.g. a power-law over a cutoff power-law), the BAT team has decided to require a chi-square improvement of more than 6 for each extra dof.
Time averaged spectrum fit using the average DRM
Power-law model
Time interval is from   -0.012 sec. to    1.452 sec.

Spectral model in power-law:
------------------------------------------------------------
Parameters  : value       lower 90%   higher 90%
Photon index: -1.99344     ( -0.262283   0.244405 )
Norm@50keV  : 1.24896E-02    ( -0.00213603   0.00206606 )
------------------------------------------------------------
#Fit statistic  : Chi-Squared                   49.55     using 59 bins.
 Reduced chi-squared = 0.869298
# Null hypothesis probability of 7.48e-01 with 57 degrees of freedom

Photon flux (15-150 keV)    in 1.464 sec: 1.86795 ( -0.26064  0.26077 ) ph/cm2/s
Energy fluence (15-150 keV)             : 1.68594e-07 ( -2.69395e-08  2.73267e-08 ) ergs/cm2
Cutoff power-law model
Time interval is from   -0.012 sec. to    1.452 sec.
Spectral model in the cutoff power-law:
------------------------------------------------------------
Parameters  : value       lower 90%   higher 90%
Photon index: -1.98198     ( -0.254876   1.10201 )
Epeak [keV] : 64.1709      ( -52.3872 -53.6476 )
Norm@50keV  : 1.26867E-02    ( -0.00801636   0.043286 )
------------------------------------------------------------
#Fit statistic  : Chi-Squared                   49.55     using 59 bins.
 Reduced chi-squared = 0.884821
# Null hypothesis probability of 7.16e-01 with 56 degrees of freedom

Photon flux (15-150 keV)    in 1.464 sec: 1.86662 ( -0.26364  0.26318 ) ph/cm2/s
Energy fluence (15-150 keV)             : 1.68164e-07 ( -3.0414e-08  2.75679e-08 ) ergs/cm2
1-s peak spectrum fit
Power-law model
Time interval is from    0.244 sec. to    1.244 sec.

Spectral model in power-law:
------------------------------------------------------------
Parameters  : value       lower 90%   higher 90%
Photon index: -1.9506     ( -0.257596   0.241214 )
Norm@50keV  : 1.51730E-02    ( -0.00256514   0.00249103 )
------------------------------------------------------------
#Fit statistic  : Chi-Squared                   52.61     using 59 bins.
 Reduced chi-squared = 0.922982
# Null hypothesis probability of 6.40e-01 with 57 degrees of freedom

Photon flux (15-150 keV)    in 1 sec: 2.22593 ( -0.31657  0.31677 ) ph/cm2/s
Energy fluence (15-150 keV)             : 1.39659e-07 ( -2.25015e-08  2.27986e-08 ) ergs/cm2
Cutoff power-law model
Time interval is from    0.244 sec. to    1.244 sec.
Spectral model in the cutoff power-law:
------------------------------------------------------------
Parameters  : value       lower 90%   higher 90%
Photon index: -1.66722     ( -0.511996   1.26168 )
Epeak [keV] : 50.9341      ( -50.8416 -50.9108 )
Norm@50keV  : 2.20452E-02    ( -0.0120185   0.0995767 )
------------------------------------------------------------
#Fit statistic  : Chi-Squared                   52.36     using 59 bins.
 Reduced chi-squared = 0.935
# Null hypothesis probability of 6.13e-01 with 56 degrees of freedom

Photon flux (15-150 keV)    in 1 sec: 2.21203 ( -0.32063  0.32031 ) ph/cm2/s
Energy fluence (15-150 keV)             : 1.36518e-07 ( -2.56235e-08  2.47432e-08 ) ergs/cm2
Time-resolved spectra
Distribution
T90 vs. Hardness ratio plot
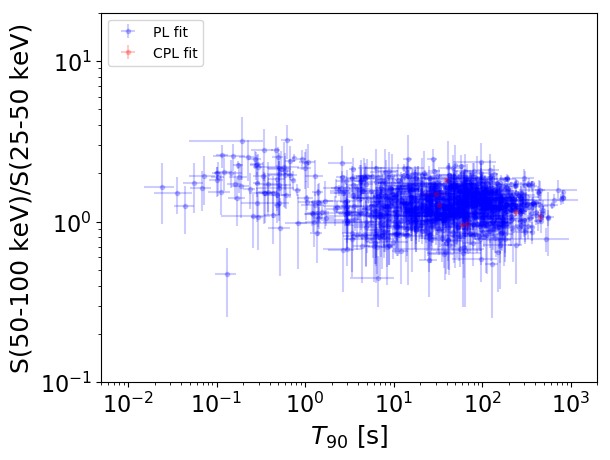
T90                                   = N/A sec.
Hardness ratio (energy fluence ratio) = N/A
S(15-50 keV) vs. S(50-150 keV) plot
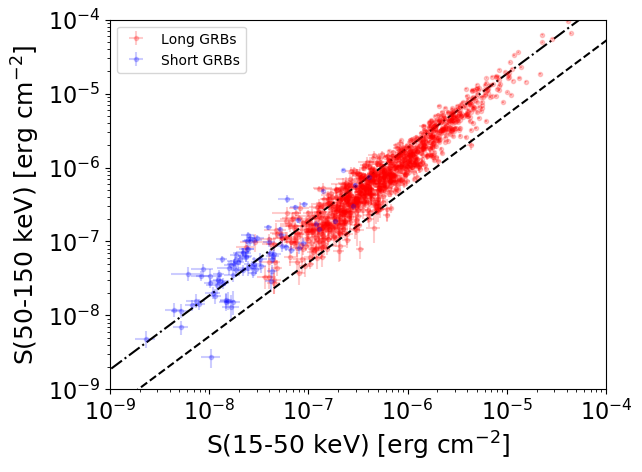
S(15-50 keV)  = N/A
S(50-150 keV) = N/A
The dash-dotted line and the dashed line traces the fluences calculated from the Band function with Epeak = 15 and 150 keV, respectively. Both lines assume a canonical values of alpha = -1 and beta = -2.5.
Mask shadow pattern
IMX = -8.559957113769353E-01, IMY = 2.699789472553979E-01
Spacecraft aspect plot
Bright source in the pre-burst/pre-slew/post-slew images
Pre-burst image of 15-350 keV band
Time interval of the image:
-239.096000 -0.012000

# RAcent  DECcent POSerr Theta    Phi  PeakCts   SNR AngSep     Name
#  [deg]    [deg]    ['] [deg]  [deg]                   [']
135.5544 -40.5738    2.9  44.3    7.6   1.8169   3.9    1.6	Vela X-1
119.2150  -7.8218    2.7  31.5   64.4   1.5986   4.3 ------	UNKNOWN
161.2801 -33.6724    3.2  37.4  -23.9   1.2850   3.6 ------	UNKNOWN
159.7279 -53.6995    2.8  56.3  -14.7   3.4506   4.1 ------	UNKNOWN
180.2194  17.2289    2.6  34.1 -125.9   1.7838   4.5 ------	UNKNOWN
185.1550 -26.6019    2.3  44.9  -55.3   4.6842   5.0 ------	UNKNOWN
Pre-slew background subtracted image of 15-350 keV band
Time interval of the image:
-0.012000 1.452000

# RAcent  DECcent POSerr Theta    Phi  PeakCts   SNR AngSep     Name
#  [deg]    [deg]    ['] [deg]  [deg]                   [']
135.5350 -40.5241    7.1  44.2    7.7   0.0461   1.6    1.9	Vela X-1
170.3188  39.1344    1.0  41.9 -162.5   0.2942  11.8 ------	UNKNOWN
Post-slew image of 15-350 keV band
Time interval of the image:
79.004600 962.967500

# RAcent  DECcent POSerr Theta    Phi  PeakCts   SNR AngSep     Name
#  [deg]    [deg]    ['] [deg]  [deg]                   [']
138.7786  -0.7184    3.5  49.2   -2.8   4.3016   3.3 ------	UNKNOWN
197.9379  25.2200    2.9  27.1 -113.8   3.7735   4.0 ------	UNKNOWN
200.7377  19.7643    3.3  32.6 -108.8   4.4654   3.5 ------	UNKNOWN
202.1651   9.2723    3.6  41.3  -98.7  12.6428   3.2 ------	UNKNOWN