Analysis Summary
Notes:
- 1) No attempt has been made to eliminate the non-significant decimal places.
- 2) This batgrbproduct analysis is done using the HEASARC data.
- 3) This batgrbproduct analysis is using the flight position for the mask-weighting calculation.
======================================================================
BAT GRB EVENT DATA PROCESSING REPORT
Process Script Ver: batgrbproduct v2.48
Process Start Time: Mon Oct 24 00:22:06 EDT 2022
Host Name: batproc1
Current Working Dir: /local/data/bat1/alien/Swift_3rdBATcatalog/event/batevent_reproc/trigger1081073
======================================================================
Trigger: 01081073 Segment: 000
BAT Trigger Time: 656806864 [s; MET]
Trigger Stop: 656806928 [s; MET]
UTC: 2021-10-24T22:20:36.039280 [includes UTCF correction]
Where From?: TDRSS position message
BAT
RA: 154.688128375659 Dec: 24.5786815823873 [deg; J2000]
Catalogged Source?: NO
Point Source?: YES
GRB Indicated?: YES [ by BAT flight software ]
Image S/N Ratio: 19.41
Image Trigger?: YES
Rate S/N Ratio: 0 [ if not an image trigger ]
Image S/N Ratio: 19.41
Analysis Position: [ source = BAT ]
RA: 154.688128375659 Dec: 24.5786815823873 [deg; J2000]
Refined Position: [ source = BAT pre-slew burst ]
RA: 154.709275136202 Dec: 24.5658713390395 [deg; J2000]
{ 10h 18m 50.2s , +24d 33' 57.1" }
+/- 0.920518109809154 [arcmin] (estimated 90% radius based on SNR)
+/- 0.322836146294515 [arcmin] (formal 1-sigma fit error)
SNR: 34.2373983362568
Angular difference between the analysis and refined position is 1.386453 arcmin
Partial Coding Fraction: 1.03125 [ including projection effects ]
Duration
T90: 600.007999897003 +/- 18.1765494497091
Measured from: -19.7999999523163
to: 580.207999944687 [s; relative to TRIGTIME]
T50: 470.971999883652 +/- 76.9866439302545
Measured from: 16.7120000123978
to: 487.683999896049 [s; relative to TRIGTIME]
Fluence
Peak Flux (peak 1 second)
Measured from: 5.17200005054474
to: 6.17200005054474 [s; relative to TRIGTIME]
Total Fluence
Measured from: -56.5039999485016
to: 592.396000027657 [s; relative to TRIGTIME]
Band 1 Band 2 Band 3 Band 4
15-25 25-50 50-100 100-350 keV
Total 3.887642 4.212931 3.129698 0.669449
0.160622 0.166747 0.147025 0.130520 [error]
Peak 0.033327 0.037051 0.036336 0.022253
0.006681 0.007126 0.006223 0.005529 [error]
[ fluence units of on-axis counts / fully illuminated detector ]
======================================================================
====== Table of the duration information =============================
Value tstart tstop
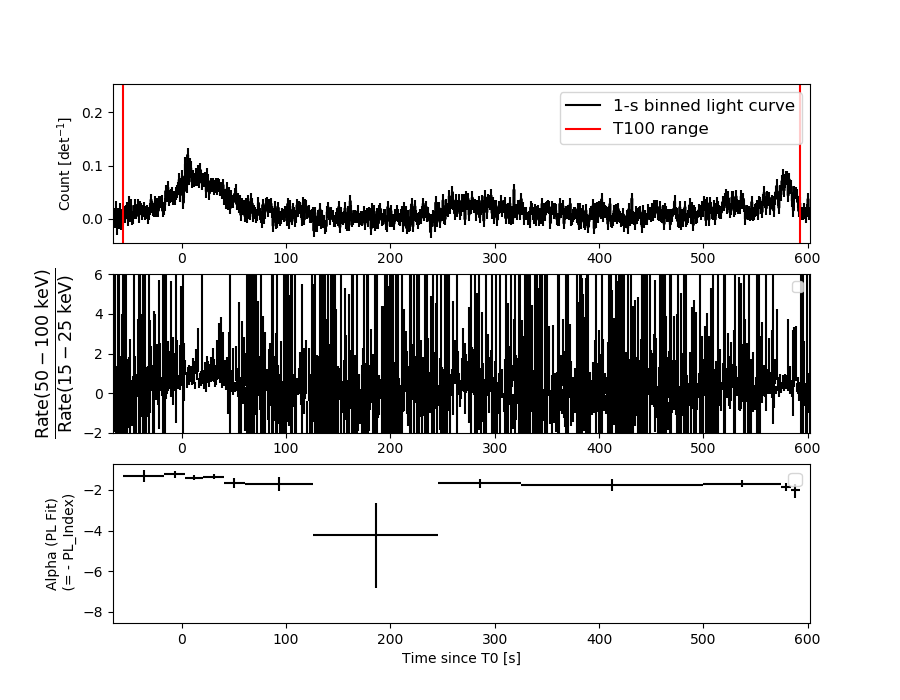
T100 648.900 -56.504 592.396
T90 600.008 -19.800 580.208
T50 470.972 16.712 487.684
Peak 1.000 5.172 6.172
====== Spectral Analysis Summary =====================================
Model : spectral model: simple power-law (PL) and cutoff power-law (CPL)
Ph_index : photon index: E^{Ph_index}
Ph_90err : 90% error of the photon index
Epeak : Epeak in keV
Epeak_90err: 90% error of Epeak
Norm : normalization at 50 keV in both the PL model and CPL model
Nomr_90err : 90% error of the normalization
chi2 : Chi-Squared
dof : degree of freedo
=== Time-averaged spectral analysis ===
(Best model with acceptable fit: N/A)
Model Ph_index Ph_90err_low Ph_90err_hi Epeak Epeak_90err_low Epeak_90err_hi Norm Nomr_90err_low Norm_90err_hi chi2 dof
PL -1.612 -0.088 0.087 - - - 1.13e-03 -5.29e-05 5.27e-05 47.830 57
CPL -1.614 -0.085 0.091 9999.360 -9999.360 -9999.360 1.13e-03 -4.88e-05 3.94e-04 47.850 56
=== 1-s peak spectral analysis ===
(Best model with acceptable fit: N/A)
Model Ph_index Ph_90err_low Ph_90err_hi Epeak Epeak_90err_low Epeak_90err_hi Norm Nomr_90err_low Norm_90err_hi chi2 dof
PL -1.206 -0.314 0.328 - - - 7.44e-03 -1.28e-03 1.28e-03 49.560 57
CPL -1.213 -0.306 0.343 9999.340 -9999.340 -9999.340 7.47e-03 -1.29e-03 8.82e-03 49.570 56
=== Fluence/Peak Flux Summary ===
Model Band1 Band2 Band3 Band4 Band5 Total
15-25 25-50 50-100 100-350 15-150 15-350 keV
Fluence PL 1.04e-06 1.79e-06 2.34e-06 6.22e-06 6.88e-06 1.14e-05 erg/cm2
90%_error_low -8.45e-08 -8.47e-08 -1.49e-07 -8.32e-07 -3.45e-07 -9.43e-07 erg/cm2
90%_error_hi 8.69e-08 8.45e-08 1.48e-07 9.19e-07 3.48e-07 1.01e-06 erg/cm2
Peak flux PL 2.31e-01 2.77e-01 2.40e-01 3.56e-01 8.74e-01 1.10e+00 ph/cm2/s
90%_error_low -7.52e-02 -5.75e-02 -4.99e-02 -1.37e-01 -1.54e-01 -2.01e-01 ph/cm2/s
90%_error_hi 8.20e-02 5.53e-02 4.87e-02 1.87e-01 1.55e-01 2.09e-01 ph/cm2/s
Fluence CPL 1.05e-06 1.78e-06 2.34e-06 6.65e-06 6.91e-06 1.14e-05 erg/cm2
90%_error_low -1.01e-07 -9.87e-08 -1.99e-07 -2.62e-06 -5.15e-07 -2.13e-06 erg/cm2
90%_error_hi 8.73e-08 1.27e-07 2.12e-07 -2.97e-07 3.98e-07 5.15e-07 erg/cm2
Peak flux CPL 2.31e-01 2.77e-01 2.40e-01 3.53e-01 8.81e-01 1.11e+00 ph/cm2/s
90%_error_low N/A N/A N/A N/A -2.06e-01 -2.63e-01 ph/cm2/s
90%_error_hi N/A N/A N/A N/A 1.92e-01 1.81e-01 ph/cm2/s
======================================================================
Image
Pre-slew 15.0-350.0 keV image (Event data)
#   RAcent    DECcent   POSerr    Theta     Phi              Peak Cts       SNR   Name
  154.7093    24.5659   0.0056     2.6971   166.1435         4.5106442     34.237 TRIG_01081073

Foreground time interval of the image:
-16.299  72.701 (delta_t =  89.000 [sec])
Background time interval of the image:
Light Curves
Note: The mask-weighted lightcurves have units of either count/det or counts/sec/det, where a det is 0.4 x 0.4 = 0.16 sq cm.
Full-time range; 1 s binning
Other quick-look light curves:
- 64 ms binning (zoomed)
- 16 ms binning (zoomed)
- 8 ms binning (zoomed)
- 2 ms binning (zoomed)
- SN=5 or 10 s binning (full-time range)
- Raw light curve
Spectra
- 64 ms binning (zoomed)
- 16 ms binning (zoomed)
- 8 ms binning (zoomed)
- 2 ms binning (zoomed)
- SN=5 or 10 s binning (full-time range)
- Raw light curve
Spectra
Notes:
- 1) The fitting includes the systematic errors.
- 2) When the burst includes telescope slew time periods, the fitting uses an average response file made from multiple 5-s response files through out the slew time plus single time preiod for the non-slew times, and weighted by the total counts in the corresponding time period using addrmf. An average response file is needed becuase a spectral fit using the pre-slew DRM will introduce some errors in both a spectral shape and a normalization if the PHA file contains a lot of the slew/post-slew time interval.
- 3) For fits to more complicated models (e.g. a power-law over a cutoff power-law), the BAT team has decided to require a chi-square improvement of more than 6 for each extra dof.
Time averaged spectrum fit using the average DRM
Power-law model
Time interval is from  -56.504 sec. to  592.396 sec.

Spectral model in power-law:
------------------------------------------------------------
Parameters  : value       lower 90%   higher 90%
Photon index: -1.612     ( -0.08795   0.0871712 )
Norm@50keV  : 1.13439E-03    ( -5.28952e-05   5.26863e-05 )
------------------------------------------------------------
#Fit statistic  : Chi-Squared                   47.83     using 59 bins.
 Reduced chi-squared = 0.839123
# Null hypothesis probability of 8.01e-01 with 57 degrees of freedom

Photon flux (15-150 keV)    in 648.9 sec: 0.146326 ( -0.006837  0.006858 ) ph/cm2/s
Energy fluence (15-150 keV)             : 6.87523e-06 ( -3.45306e-07  3.47611e-07 ) ergs/cm2
Cutoff power-law model

Time interval is from  -56.504 sec. to  592.396 sec.
Spectral model in the cutoff power-law:
------------------------------------------------------------
Parameters  : value       lower 90%   higher 90%
Photon index: -1.61354     ( -0.0864798   0.0902259 )
Epeak [keV] : 9999.36      ( -9999.36 -9999.36 )
Norm@50keV  : 1.13313E-03    ( -5.19636e-05   0.00039102 )
------------------------------------------------------------
#Fit statistic  : Chi-Squared                   47.85     using 59 bins.
 Reduced chi-squared = 0.854464
# Null hypothesis probability of 7.72e-01 with 56 degrees of freedom

Photon flux (15-150 keV)    in 648.9 sec: 0.147024 ( -0.010206  0.008457 ) ph/cm2/s
Energy fluence (15-150 keV)             : 6.91078e-06 ( -5.1509e-07  3.9838e-07 ) ergs/cm2
1-s peak spectrum fit
Power-law model

Time interval is from    5.172 sec. to    6.172 sec.

Spectral model in power-law:
------------------------------------------------------------
Parameters  : value       lower 90%   higher 90%
Photon index: -1.20643     ( -0.314234   0.327887 )
Norm@50keV  : 7.43867E-03    ( -0.0012823   0.00128152 )
------------------------------------------------------------
#Fit statistic  : Chi-Squared                   49.56     using 59 bins.
 Reduced chi-squared = 0.869474
# Null hypothesis probability of 7.48e-01 with 57 degrees of freedom

Photon flux (15-150 keV)    in 1 sec: 0.873951 ( -0.154269  0.154749 ) ph/cm2/s
Energy fluence (15-150 keV)             : 7.53408e-08 ( -1.46378e-08  1.48267e-08 ) ergs/cm2
Cutoff power-law model
Time interval is from    5.172 sec. to    6.172 sec.
Spectral model in the cutoff power-law:
------------------------------------------------------------
Parameters  : value       lower 90%   higher 90%
Photon index: -1.21288     ( -0.306567   0.34255 )
Epeak [keV] : 9999.34      ( -9999.36 -9999.36 )
Norm@50keV  : 7.47075E-03    ( -0.00128842   0.00881674 )
------------------------------------------------------------
#Fit statistic  : Chi-Squared                   49.57     using 59 bins.
 Reduced chi-squared = 0.885179
# Null hypothesis probability of 7.15e-01 with 56 degrees of freedom

Photon flux (15-150 keV)    in 1 sec: 0.880677 ( -0.205712  0.192243 ) ph/cm2/s
Energy fluence (15-150 keV)             : 2.6313e-08 ( -1.521e-08  1.34455e-08 ) ergs/cm2
Time-resolved spectra
Distribution
T90 vs. Hardness ratio plot
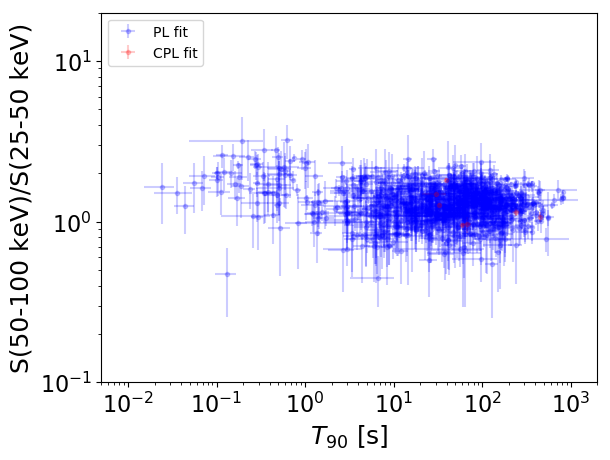
T90                                   = N/A sec.
Hardness ratio (energy fluence ratio) = N/A
S(15-50 keV) vs. S(50-150 keV) plot
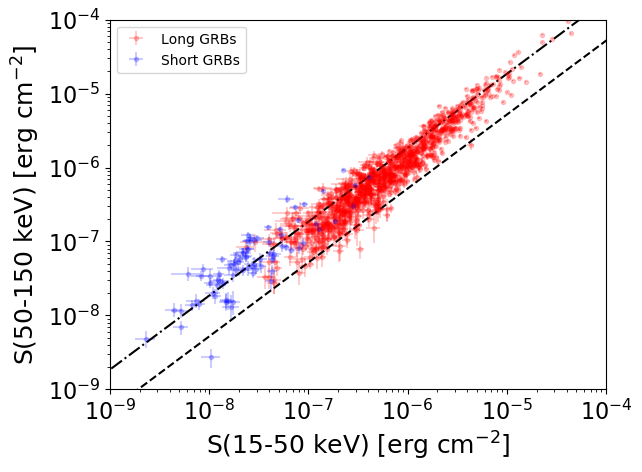
S(15-50 keV)  = N/A
S(50-150 keV) = N/A
The dash-dotted line and the dashed line traces the fluences calculated from the Band function with Epeak = 15 and 150 keV, respectively. Both lines assume a canonical values of alpha = -1 and beta = -2.5.
Mask shadow pattern
IMX = -4.573684583323155E-02, IMY = -1.128187447192058E-02
Spacecraft aspect plot
Bright source in the pre-burst/pre-slew/post-slew images
Pre-burst image of 15-350 keV band
Time interval of the image:
Pre-slew background subtracted image of 15-350 keV band
Time interval of the image:
-16.299410 72.700600

# RAcent  DECcent POSerr Theta    Phi  PeakCts   SNR AngSep     Name
#  [deg]    [deg]    ['] [deg]  [deg]                   [']
130.4257  18.7747    2.4  22.8   69.0   0.8514   4.9 ------	UNKNOWN
154.7093  24.5659    0.3   2.7  166.1   4.5121  34.2 ------	UNKNOWN
180.7156   1.9804    2.8  32.3  -73.1   1.0201   4.0 ------	UNKNOWN
Post-slew image of 15-350 keV band
Time interval of the image:
99.900600 117.700590

# RAcent  DECcent POSerr Theta    Phi  PeakCts   SNR AngSep     Name
#  [deg]    [deg]    ['] [deg]  [deg]                   [']
199.5868  72.7381    2.4  54.0  167.3   1.0462   4.8 ------	UNKNOWN
172.2487  11.5338    2.7  21.1  -82.8   0.2405   4.4 ------	UNKNOWN
145.9147 -34.1228    2.5  59.3  -19.3   1.6637   4.7 ------	UNKNOWN