Analysis Summary
Notes:
- 1) No attempt has been made to eliminate the non-significant decimal places.
- 2) This batgrbproduct analysis is done using the HEASARC data.
- 3) This batgrbproduct analysis is using the flight position for the mask-weighting calculation.
======================================================================
                  BAT GRB EVENT DATA PROCESSING REPORT
    Process Script Ver: batgrbproduct v2.48
    Process Start Time: Mon Oct 24 00:20:26 EDT 2022
             Host Name: batproc1
   Current Working Dir: /local/data/bat1/alien/Swift_3rdBATcatalog/event/batevent_reproc/trigger1081113
======================================================================

  Trigger: 01081113      Segment: 000

  BAT Trigger Time: 656831448   [s; MET]
      Trigger Stop: 656831512   [s; MET]
               UTC: 2021-10-25T05:10:20.037640    [includes UTCF correction]
       Where From?: TDRSS position message

  BAT
    RA: 162.376906521174   Dec: 31.557366765591  [deg; J2000]

     Catalogged Source?: NO
     Point Source?:      YES
     GRB Indicated?:     YES    [ by BAT flight software ]
     Image S/N Ratio:    8.05
     Image Trigger?:     YES
     Rate S/N Ratio:     0  [ if not an image trigger ]
     Image S/N Ratio:    8.05

  Analysis Position:   [ source = BAT ]
    RA: 162.376906521174   Dec: 31.557366765591  [deg; J2000]

  Refined Position:   [ source = BAT pre-slew burst ]
    RA: 162.413120657053   Dec: 31.4928687212186  [deg; J2000]
        { 10h 49m 39.1s , +31d 29' 34.3" }
         +/- 2.24490818455163 [arcmin] (estimated 90% radius based on SNR)
         +/- 1.10433474563339 [arcmin] (formal 1-sigma fit error)
    SNR: 9.58089582711658

  Angular difference between the analysis and refined position is 4.290278 arcmin

  Partial Coding Fraction: 1.03125    [ including projection effects ]

  Duration
     T90: 95.2640000581741 +/- 28.9655298711973
        Measured from: 35.1759999990463
                   to: 130.44000005722     [s; relative to TRIGTIME]
     T50: 43.9840000867844 +/- 15.9213185225978
        Measured from: 44.2159999608994
                   to: 88.2000000476837     [s; relative to TRIGTIME]


  Fluence
     Peak Flux  (peak 1 second)
        Measured from: 51.6599999666214
                   to: 52.6599999666214     [s; relative to TRIGTIME]
     Total Fluence
        Measured from: 31.7840000391006
                   to: 139.703999996185     [s; relative to TRIGTIME]

             Band 1     Band 2     Band 3     Band 4
              15-25      25-50     50-100    100-350     keV
 Total     0.590464   0.526772   0.275837   0.052159
           0.066574   0.069452   0.062975   0.062287 [error]
 Peak      0.017550   0.020095   0.016228   0.016051
           0.006479   0.006665   0.006116   0.005947 [error]

     [ fluence units of on-axis counts / fully illuminated detector ]

======================================================================


====== Table of the duration information =============================

        Value   tstart    tstop
T100  107.920   31.784  139.704
T90    95.264   35.176  130.440
T50    43.984   44.216   88.200
Peak    1.000   51.660   52.660


====== Spectral Analysis Summary =====================================

Model      : spectral model: simple power-law (PL) and cutoff power-law (CPL)
Ph_index   : photon index: E^{Ph_index}
Ph_90err   : 90% error of the photon index
Epeak      : Epeak in keV
Epeak_90err: 90% error of Epeak
Norm       : normalization at 50 keV in both the PL model and CPL model
Nomr_90err : 90% error of the normalization
chi2       : Chi-Squared
dof        : degree of freedo

=== Time-averaged spectral analysis ===
(Best model with acceptable fit: N/A)

Model Ph_index Ph_90err_low Ph_90err_hi  Epeak  Epeak_90err_low  Epeak_90err_hi  Norm       Nomr_90err_low    Norm_90err_hi    chi2    dof
PL      -1.986    -0.304      0.278       -           -               -         7.28e-04     -1.44e-04          1.38e-04      39.790   57
CPL     -2.116    -0.178      0.872       51.459      N/A           N/A         6.11e-04        N/A               N/A         39.610   56


=== 1-s peak spectral analysis ===
(Best model with acceptable fit: N/A)

Model Ph_index Ph_90err_low Ph_90err_hi  Epeak  Epeak_90err_low  Epeak_90err_hi  Norm       Nomr_90err_low    Norm_90err_hi    chi2    dof
PL      -1.264     -0.636     0.656       -           -               -         3.96e-03     -1.27e-03          1.24e-03      46.380   57
CPL     -1.284     -0.616     0.684     9999.360    -9999.360      -9999.360      3.94e-03     -1.24e-03          1.81e-02      46.390   56


=== Fluence/Peak Flux Summary ===

              Model    Band1     Band2     Band3     Band4     Band5     Total
                       15-25     25-50    50-100    100-350    15-150    15-350    keV
Fluence         PL   1.59e-07  2.17e-07  2.19e-07  4.01e-07  7.24e-07  9.96e-07   erg/cm2
      90%_error_low -2.99e-08 -3.09e-08 -5.85e-08 -1.78e-07 -1.31e-07 -2.52e-07   erg/cm2
      90%_error_hi   3.05e-08  3.05e-08  6.11e-08  2.58e-07  1.36e-07  3.17e-07   erg/cm2
Peak flux       PL   1.30e-01  1.51e-01  1.26e-01  1.76e-01  4.70e-01  5.82e-01   ph/cm2/s
      90%_error_low -7.21e-02 -5.59e-02 -5.17e-02 -1.16e-01 -1.47e-01 -1.91e-01   ph/cm2/s
      90%_error_hi   8.45e-02  5.17e-02  4.89e-02  2.17e-01  1.48e-01  2.11e-01   ph/cm2/s

Fluence        CPL   1.56e-07  1.95e-07  1.87e-07  4.34e-07  6.72e-07  9.92e-07   erg/cm2
      90%_error_low -3.47e-08 -5.45e-08 -1.31e-07 -2.04e-07 -1.53e-07 -2.40e-07   erg/cm2
      90%_error_hi   3.24e-08  4.96e-08  7.06e-08  1.21e-07  1.60e-07  1.83e-07   erg/cm2
Peak flux      CPL   1.30e-01  1.51e-01  1.25e-01  1.75e-01  4.70e-01  6.10e-01   ph/cm2/s
      90%_error_low     N/A       N/A       N/A       N/A   -1.47e-01 -3.00e-01   ph/cm2/s
      90%_error_hi      N/A       N/A       N/A       N/A    1.47e-01  2.56e-01   ph/cm2/s

======================================================================
Image
Pre-slew 15.0-350.0 keV image (Event data)

#   RAcent    DECcent   POSerr    Theta     Phi              Peak Cts       SNR   Name
  162.4131    31.4929   0.0200     9.7303  -153.8313         0.8448659      9.581 TRIG_01081113

Foreground time interval of the image:
 31.784  72.701 (delta_t =  40.917 [sec])
Background time interval of the image:
-239.000  31.784 (delta_t = 270.784 [sec])
Light Curves
Note: The mask-weighted lightcurves have units of either count/det or counts/sec/det, where a det is 0.4 x 0.4 = 0.16 sq cm.
Full-time range; 1 s binning
Other quick-look light curves:
- 64 ms binning (zoomed)
- 16 ms binning (zoomed)
- 8 ms binning (zoomed)
- 2 ms binning (zoomed)
- SN=5 or 10 s binning (full-time range)
- Raw light curve
Spectra
- 64 ms binning (zoomed)
- 16 ms binning (zoomed)
- 8 ms binning (zoomed)
- 2 ms binning (zoomed)
- SN=5 or 10 s binning (full-time range)
- Raw light curve
Spectra
Notes:
- 1) The fitting includes the systematic errors.
- 2) When the burst includes telescope slew time periods, the fitting uses an average response file made from multiple 5-s response files through out the slew time plus single time preiod for the non-slew times, and weighted by the total counts in the corresponding time period using addrmf. An average response file is needed becuase a spectral fit using the pre-slew DRM will introduce some errors in both a spectral shape and a normalization if the PHA file contains a lot of the slew/post-slew time interval.
- 3) For fits to more complicated models (e.g. a power-law over a cutoff power-law), the BAT team has decided to require a chi-square improvement of more than 6 for each extra dof.
Time averaged spectrum fit using the average DRM
Power-law model

Time interval is from   31.784 sec. to  139.704 sec.

Spectral model in power-law:
------------------------------------------------------------
Parameters  : value       lower 90%   higher 90%
Photon index: -1.98602     ( -0.303658   0.27755 )
Norm@50keV  : 7.27572E-04    ( -0.000144285   0.000138419 )
------------------------------------------------------------
#Fit statistic  : Chi-Squared                   39.79     using 59 bins.
 Reduced chi-squared = 0.69807
# Null hypothesis probability of 9.60e-01 with 57 degrees of freedom

Photon flux (15-150 keV)    in 107.9 sec: 0.108448 ( -0.0147658  0.01477 ) ph/cm2/s
Energy fluence (15-150 keV)             : 7.23588e-07 ( -1.3058e-07  1.36477e-07 ) ergs/cm2
Cutoff power-law model

Time interval is from   31.784 sec. to  139.704 sec.
Spectral model in the cutoff power-law:
------------------------------------------------------------
Parameters  : value       lower 90%   higher 90%
Photon index: -2.19018     ( -0.103227   0.946129 )
Epeak [keV] : 78.5456      (   )
Norm@50keV  : 5.63432E-04    (     )
------------------------------------------------------------
#Fit statistic  : Chi-Squared                   39.58     using 59 bins.
 Reduced chi-squared = 0.706786
# Null hypothesis probability of 9.53e-01 with 56 degrees of freedom

Photon flux (15-150 keV)    in 107.9 sec: 9.82474E-02 ( -0.0274693  0.0250096 ) ph/cm2/s
Energy fluence (15-150 keV)             : 6.72313e-07 ( -1.5301e-07  1.5976e-07 ) ergs/cm2
1-s peak spectrum fit
Power-law model

Time interval is from   51.660 sec. to   52.660 sec.

Spectral model in power-law:
------------------------------------------------------------
Parameters  : value       lower 90%   higher 90%
Photon index: -1.26425     ( -0.636173   0.655677 )
Norm@50keV  : 3.96298E-03    ( -0.00126607   0.00123852 )
------------------------------------------------------------
#Fit statistic  : Chi-Squared                   46.38     using 59 bins.
 Reduced chi-squared = 0.813684
# Null hypothesis probability of 8.41e-01 with 57 degrees of freedom

Photon flux (15-150 keV)    in 1 sec: 0.469820 ( -0.147034  0.147512 ) ph/cm2/s
Energy fluence (15-150 keV)             : 3.95212e-08 ( -1.4389e-08  1.49228e-08 ) ergs/cm2
Cutoff power-law model

Time interval is from   51.660 sec. to   52.660 sec.
Spectral model in the cutoff power-law:
------------------------------------------------------------
Parameters  : value       lower 90%   higher 90%
Photon index: -1.28419     ( -0.617443   0.68265 )
Epeak [keV] : 9999.36      ( -9999.36 -9999.36 )
Norm@50keV  : 3.94029E-03    ( -0.00126932   0.0181074 )
------------------------------------------------------------
#Fit statistic  : Chi-Squared                   46.39     using 59 bins.
 Reduced chi-squared = 0.828393
# Null hypothesis probability of 8.16e-01 with 56 degrees of freedom

Photon flux (15-150 keV)    in 1 sec: 0.469777 ( -0.147337  0.147403 ) ph/cm2/s
Energy fluence (15-150 keV)             : 3.95039e-08 ( -1.86239e-08  1.93547e-08 ) ergs/cm2
Time-resolved spectra

Distribution
T90 vs. Hardness ratio plot
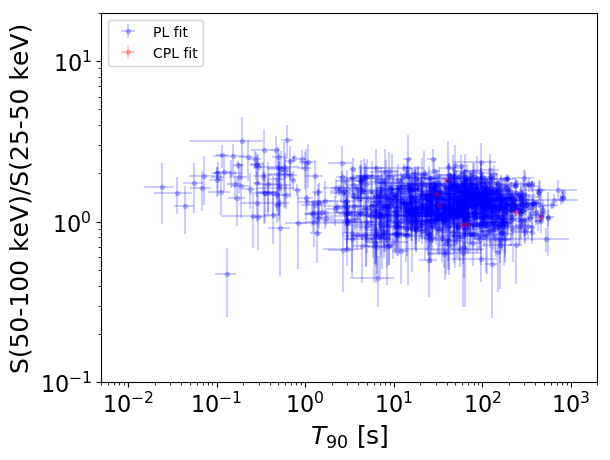
T90                                   = N/A sec.
Hardness ratio (energy fluence ratio) = N/A
S(15-50 keV) vs. S(50-150 keV) plot
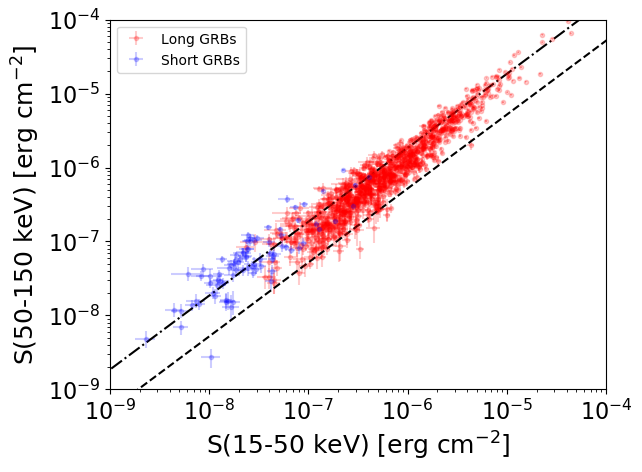
S(15-50 keV)  = N/A
S(50-150 keV) = N/A
The dash-dotted line and the dashed line traces the fluences calculated from the Band function with Epeak = 15 and 150 keV, respectively. Both lines assume a canonical values of alpha = -1 and beta = -2.5.
Mask shadow pattern

IMX = -1.539010018946463E-01, IMY = 7.562433797807978E-02
Spacecraft aspect plot

Bright source in the pre-burst/pre-slew/post-slew images
Pre-burst image of 15-350 keV band
Time interval of the image:
-239.000000 31.784000

# RAcent  DECcent POSerr Theta    Phi  PeakCts   SNR AngSep     Name
#  [deg]    [deg]    ['] [deg]  [deg]                   [']
108.1638  37.1498    2.3  41.4  102.4   5.2772   5.0 ------	UNKNOWN
175.1416  65.5345    3.0  43.0  175.6   2.1495   3.8 ------	UNKNOWN
200.6602  72.6407    3.3  54.2  178.7   3.8520   3.5 ------	UNKNOWN
212.1650  64.1429    2.9  54.0 -169.6   3.4114   4.0 ------	UNKNOWN
Pre-slew background subtracted image of 15-350 keV band
Time interval of the image:
31.784000 72.700600

# RAcent  DECcent POSerr Theta    Phi  PeakCts   SNR AngSep     Name
#  [deg]    [deg]    ['] [deg]  [deg]                   [']
196.9254  77.7072    2.4  56.7  173.2   2.5673   4.7 ------	UNKNOWN
162.4131  31.4929    1.2   9.7 -153.8   0.8450   9.6 ------	UNKNOWN
173.1120 -22.9629    1.9  50.8  -38.7   2.0407   6.0 ------	UNKNOWN
181.3300 -14.4890    1.8  46.9  -53.1   2.4373   6.4 ------	UNKNOWN
214.4061  38.2832    2.8  51.9 -137.1   1.9781   4.2 ------	UNKNOWN
Post-slew image of 15-350 keV band
Time interval of the image:
111.300600 720.554000
721.000000 943.300610

# RAcent  DECcent POSerr Theta    Phi  PeakCts   SNR AngSep     Name
#  [deg]    [deg]    ['] [deg]  [deg]                   [']
155.6534  78.7415    2.8  47.3  142.3  10.2734   4.2 ------	UNKNOWN
123.2831  -9.6193    3.1  55.6   12.9  19.6828   3.8 ------	UNKNOWN
150.7860   5.2214    3.0  28.5  -11.2   2.7860   3.8 ------	UNKNOWN
145.5574 -16.1265    2.9  50.3  -14.8   6.3449   4.0 ------	UNKNOWN
191.1748  22.6671    2.4  27.0 -113.9   4.5888   4.8 ------	UNKNOWN