Analysis Summary
Notes:
- 1) No attempt has been made to eliminate the non-significant decimal places.
- 2) This batgrbproduct analysis is done using the HEASARC data.
- 3) This batgrbproduct analysis is using the flight position for the mask-weighting calculation.
======================================================================
                  BAT GRB EVENT DATA PROCESSING REPORT
    Process Script Ver: batgrbproduct v2.48
    Process Start Time: Mon Oct 24 00:18:18 EDT 2022
             Host Name: batproc1
   Current Working Dir: /local/data/bat1/alien/Swift_3rdBATcatalog/event/batevent_reproc/trigger1085430
======================================================================

  Trigger: 01085430      Segment: 000

  BAT Trigger Time: 659872294.4   [s; MET]
      Trigger Stop: 659872295.424   [s; MET]
               UTC: 2021-11-29T09:51:06.232980    [includes UTCF correction]
       Where From?: TDRSS position message

  BAT
    RA: 274.556946141108   Dec: 31.7759512305881  [deg; J2000]

     Catalogged Source?: NO
     Point Source?:      YES
     GRB Indicated?:     YES    [ by BAT flight software ]
     Image S/N Ratio:    9.2
     Image Trigger?:     NO
     Rate S/N Ratio:     21.1660104885167  [ if not an image trigger ]
     Image S/N Ratio:    9.2

  Analysis Position:   [ source = BAT ]
    RA: 274.556946141108   Dec: 31.7759512305881  [deg; J2000]

  Refined Position:   [ source = BAT pre-slew burst ]
    RA: 274.565882683047   Dec: 31.780805473117  [deg; J2000]
        { 18h 18m 15.8s , +31d 46' 50.9" }
         +/- 1.44953738100853 [arcmin] (estimated 90% radius based on SNR)
         +/- 0.543685109332379 [arcmin] (formal 1-sigma fit error)
    SNR: 17.8974285708247

  Angular difference between the analysis and refined position is 0.540920 arcmin

  Partial Coding Fraction: 0.8359375    [ including projection effects ]

  Duration
     T90: 643.68799996376 +/- 204.267742900217
        Measured from: 0.608000040054321
                   to: 644.296000003815     [s; relative to TRIGTIME]
     T50: 170.699999928474 +/- 131.55763648748
        Measured from: 26.5320000648499
                   to: 197.231999993324     [s; relative to TRIGTIME]


  Fluence
     Peak Flux  (peak 1 second)
        Measured from: 0.98800003528595
                   to: 1.98800003528595     [s; relative to TRIGTIME]
     Total Fluence
        Measured from: -1.80400002002716
                   to: 848.544000029564     [s; relative to TRIGTIME]

             Band 1     Band 2     Band 3     Band 4
              15-25      25-50     50-100    100-350     keV
 Total     1.493071   1.726285   0.838827   0.241441
           0.214571   0.221767   0.196865   0.184823 [error]
 Peak      0.057072   0.074236   0.054724   0.023507
           0.009040   0.009837   0.008514   0.007331 [error]

     [ fluence units of on-axis counts / fully illuminated detector ]

======================================================================


====== Table of the duration information =============================

        Value   tstart    tstop
T100  850.348   -1.804  848.544
T90   643.688    0.608  644.296
T50   170.700   26.532  197.232
Peak    1.000    0.988    1.988


====== Spectral Analysis Summary =====================================

Model      : spectral model: simple power-law (PL) and cutoff power-law (CPL)
Ph_index   : photon index: E^{Ph_index}
Ph_90err   : 90% error of the photon index
Epeak      : Epeak in keV
Epeak_90err: 90% error of Epeak
Norm       : normalization at 50 keV in both the PL model and CPL model
Nomr_90err : 90% error of the normalization
chi2       : Chi-Squared
dof        : degree of freedo

=== Time-averaged spectral analysis ===
(Best model with acceptable fit: N/A)

Model Ph_index Ph_90err_low Ph_90err_hi  Epeak  Epeak_90err_low  Epeak_90err_hi  Norm       Nomr_90err_low    Norm_90err_hi    chi2    dof
PL      -1.775    -0.287      0.272       -           -               -         3.02e-04     -5.52e-05          5.33e-05      58.520   57
CPL     -1.779    -0.712      0.921     9996.160    -9996.150      -9996.160      3.00e-04     -3.00e-04          7.41e-04      58.520   56


=== 1-s peak spectral analysis ===
(Best model with acceptable fit: N/A)

Model Ph_index Ph_90err_low Ph_90err_hi  Epeak  Epeak_90err_low  Epeak_90err_hi  Norm       Nomr_90err_low    Norm_90err_hi    chi2    dof
PL      -1.533     -0.244     0.240       -           -               -         1.22e-02     -1.91e-03          1.89e-03      89.180   57
CPL     -0.451     -1.117     1.488       63.657     -16.969       -63.657      4.88e-02     -4.88e-02          2.73e-01      86.510   56


=== Fluence/Peak Flux Summary ===

              Model    Band1     Band2     Band3     Band4     Band5     Total
                       15-25     25-50    50-100    100-350    15-150    15-350    keV
Fluence         PL   4.24e-07  6.59e-07  7.71e-07  1.74e-06  2.36e-06  3.59e-06   erg/cm2
      90%_error_low -8.97e-08 -9.69e-08 -1.89e-07 -7.28e-07 -4.34e-07 -9.49e-07   erg/cm2
      90%_error_hi   9.20e-08  9.68e-08  1.94e-07  1.03e-06  4.49e-07  1.20e-06   erg/cm2
Peak flux       PL   5.20e-01  5.14e-01  3.55e-01  3.87e-01  1.54e+00  1.78e+00   ph/cm2/s
      90%_error_low -1.17e-01 -7.80e-02 -6.90e-02 -1.30e-01 -2.28e-01 -2.67e-01   ph/cm2/s
      90%_error_hi   1.23e-01  7.76e-02  6.89e-02  1.65e-01  2.28e-01  2.70e-01   ph/cm2/s

Fluence        CPL   4.24e-07  6.59e-07  7.71e-07  1.73e-06  2.36e-06  3.63e-06   erg/cm2
      90%_error_low    N/A       N/A    -1.89e-07    N/A    -3.46e-07 -1.52e-06   erg/cm2
      90%_error_hi     N/A       N/A     1.94e-07    N/A     4.49e-07  1.17e-06   erg/cm2
Peak flux      CPL   4.60e-01  5.83e-01  3.63e-01  1.12e-01  1.49e+00  1.52e+00   ph/cm2/s
      90%_error_low -1.38e-01 -1.06e-01 -8.53e-02 -1.12e-01 -2.35e-01 -2.54e-01   ph/cm2/s
      90%_error_hi   1.40e-01  1.12e-01  8.08e-02  2.97e-01  2.35e-01  3.29e-01   ph/cm2/s

======================================================================
Image
Pre-slew 15.0-350.0 keV image (Event data)
#   RAcent    DECcent   POSerr    Theta     Phi              Peak Cts       SNR   Name
  274.5659    31.7808   0.0107    21.6619   -39.3332         1.2496804     17.897 TRIG_01085430

Foreground time interval of the image:
 -1.804  14.301 (delta_t =  16.105 [sec])
Background time interval of the image:
-138.899  -1.804 (delta_t = 137.095 [sec])
Light Curves
Note: The mask-weighted lightcurves have units of either count/det or counts/sec/det, where a det is 0.4 x 0.4 = 0.16 sq cm.
Full-time range; 1 s binning
Other quick-look light curves:
- 64 ms binning (zoomed)
- 16 ms binning (zoomed)
- 8 ms binning (zoomed)
- 2 ms binning (zoomed)
- SN=5 or 10 s binning (full-time range)
- Raw light curve
Spectra
- 64 ms binning (zoomed)
- 16 ms binning (zoomed)
- 8 ms binning (zoomed)
- 2 ms binning (zoomed)
- SN=5 or 10 s binning (full-time range)
- Raw light curve
Spectra
Notes:
- 1) The fitting includes the systematic errors.
- 2) When the burst includes telescope slew time periods, the fitting uses an average response file made from multiple 5-s response files through out the slew time plus single time preiod for the non-slew times, and weighted by the total counts in the corresponding time period using addrmf. An average response file is needed becuase a spectral fit using the pre-slew DRM will introduce some errors in both a spectral shape and a normalization if the PHA file contains a lot of the slew/post-slew time interval.
- 3) For fits to more complicated models (e.g. a power-law over a cutoff power-law), the BAT team has decided to require a chi-square improvement of more than 6 for each extra dof.
Time averaged spectrum fit using the average DRM
Power-law model

Time interval is from   -1.804 sec. to  848.544 sec.

Spectral model in power-law:
------------------------------------------------------------
Parameters  : value       lower 90%   higher 90%
Photon index: -1.77485     ( -0.286875   0.272151 )
Norm@50keV  : 3.01610E-04    ( -5.51669e-05   5.32909e-05 )
------------------------------------------------------------
#Fit statistic  : Chi-Squared                   58.52     using 59 bins.
 Reduced chi-squared = 1.02667
# Null hypothesis probability of 4.20e-01 with 57 degrees of freedom

Photon flux (15-150 keV)    in 850.3 sec: 4.11650E-02 ( -0.0060319  0.0060318 ) ph/cm2/s
Energy fluence (15-150 keV)             : 2.36376e-06 ( -4.34136e-07  4.49064e-07 ) ergs/cm2
Cutoff power-law model
Time interval is from   -1.804 sec. to  848.544 sec.
Spectral model in the cutoff power-law:
------------------------------------------------------------
Parameters  : value       lower 90%   higher 90%
Photon index: -1.77877     ( -0.71319   0.919922 )
Epeak [keV] : 9996.16      ( -9999.23 -9999.24 )
Norm@50keV  : 2.99797E-04    ( -0.000301624   0.000739153 )
------------------------------------------------------------
#Fit statistic  : Chi-Squared                   58.52     using 59 bins.
 Reduced chi-squared = 1.045
# Null hypothesis probability of 3.83e-01 with 56 degrees of freedom

Photon flux (15-150 keV)    in 850.3 sec: 3.69056E-02 ( -0.0100465  0.0086929 ) ph/cm2/s
Energy fluence (15-150 keV)             : 2.36332e-06 ( -3.46007e-07  4.48988e-07 ) ergs/cm2
1-s peak spectrum fit
Power-law model
Time interval is from    0.988 sec. to    1.988 sec.

Spectral model in power-law:
------------------------------------------------------------
Parameters  : value       lower 90%   higher 90%
Photon index: -1.53287     ( -0.24406   0.240277 )
Norm@50keV  : 1.22489E-02    ( -0.00190974   0.00188839 )
------------------------------------------------------------
#Fit statistic  : Chi-Squared                   89.18     using 59 bins.
 Reduced chi-squared = 1.56456
# Null hypothesis probability of 4.12e-03 with 57 degrees of freedom

Photon flux (15-150 keV)    in 1 sec: 1.54311 ( -0.22766  0.22781 ) ph/cm2/s
Energy fluence (15-150 keV)             : 1.15617e-07 ( -1.94425e-08  1.97959e-08 ) ergs/cm2
Cutoff power-law model
Time interval is from    0.988 sec. to    1.988 sec.
Spectral model in the cutoff power-law:
------------------------------------------------------------
Parameters  : value       lower 90%   higher 90%
Photon index: -0.450858     ( -1.12   1.485 )
Epeak [keV] : 63.6572      ( -16.8746 -63.5633 )
Norm@50keV  : 4.87912E-02    ( -0.0490723   0.272947 )
------------------------------------------------------------
#Fit statistic  : Chi-Squared                   86.51     using 59 bins.
 Reduced chi-squared = 1.54482
# Null hypothesis probability of 5.52e-03 with 56 degrees of freedom

Photon flux (15-150 keV)    in 1 sec: 1.48928 ( -0.23532  0.23537 ) ph/cm2/s
Energy fluence (15-150 keV)             : 1.03727e-07 ( -2.13435e-08  2.31988e-08 ) ergs/cm2
Time-resolved spectra
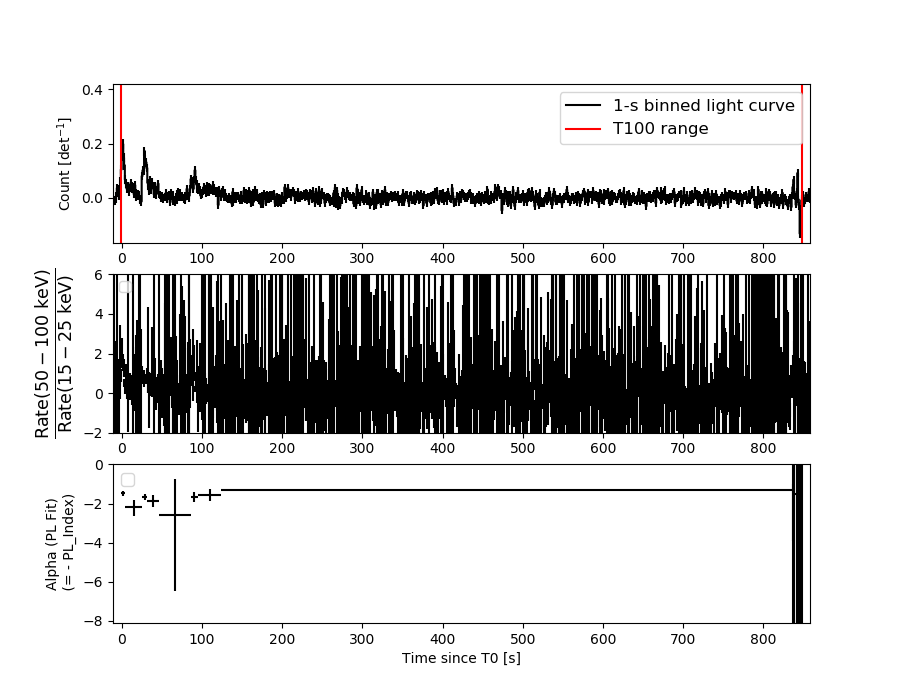
Distribution
T90 vs. Hardness ratio plot
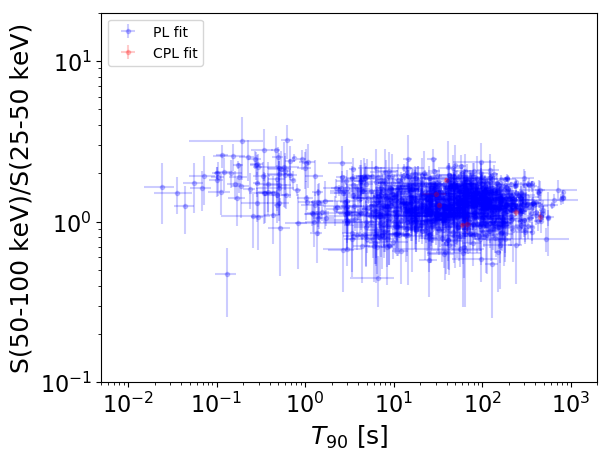
T90                                   = N/A sec.
Hardness ratio (energy fluence ratio) = N/A
S(15-50 keV) vs. S(50-150 keV) plot
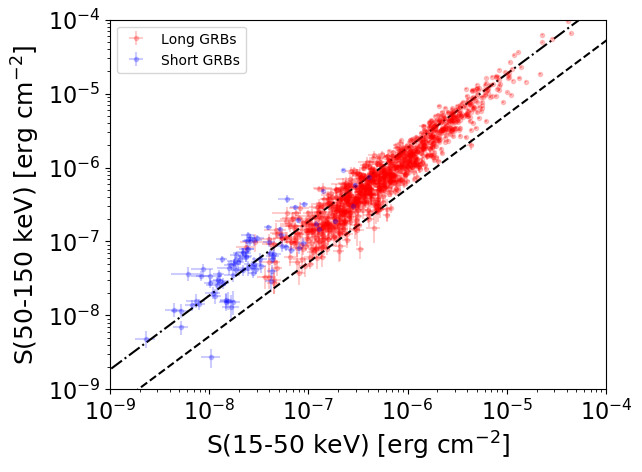
S(15-50 keV)  = N/A
S(50-150 keV) = N/A
The dash-dotted line and the dashed line traces the fluences calculated from the Band function with Epeak = 15 and 150 keV, respectively. Both lines assume a canonical values of alpha = -1 and beta = -2.5.
Mask shadow pattern
IMX = 3.072063213645213E-01, IMY = 2.517427789715487E-01
Spacecraft aspect plot
Bright source in the pre-burst/pre-slew/post-slew images
Pre-burst image of 15-350 keV band
Time interval of the image:
-138.899400 -1.804000

# RAcent  DECcent POSerr Theta    Phi  PeakCts   SNR AngSep     Name
#  [deg]    [deg]    ['] [deg]  [deg]                   [']
254.3908  35.3566  111.5  38.7  -34.9  -0.0354  -0.1    3.4	Her X-1
268.3190  -1.6277    0.0  40.6  -98.3  -2.4650  -2.6   10.9	SW J1753.5-0127
288.6311  10.9207    8.6  18.2 -116.0  -0.2974  -1.3   10.0	GRS 1915+105
299.6000  35.2156    0.5   8.8   35.8   4.8820  24.3    1.0	Cyg X-1
307.8449  41.0216    0.0  16.4   56.0   0.4799   2.0   12.7	Cyg X-3
325.9394  38.4114    0.0  25.8   86.4   0.7595   2.6   12.2	Cyg X-2
333.8360  68.7835    3.2  47.1   47.3   3.4401   3.6 ------	UNKNOWN
340.8599  -8.2613    2.7  53.7  155.2   5.0604   4.3 ------	UNKNOWN
310.6797  68.0138    2.5  42.2   37.4   2.1299   4.6 ------	UNKNOWN
297.2286  66.2692    3.0  39.8   29.9   1.3977   3.8 ------	UNKNOWN
240.8950  68.3309    2.2  53.8    8.0   4.6756   5.1 ------	UNKNOWN
Pre-slew background subtracted image of 15-350 keV band
Time interval of the image:
-1.804000 14.300600

# RAcent  DECcent POSerr Theta    Phi  PeakCts   SNR AngSep     Name
#  [deg]    [deg]    ['] [deg]  [deg]                   [']
254.6292  35.3098    4.7  38.5  -34.9  -0.2558  -2.5    8.6	Her X-1
268.2370  -1.5286    5.9  40.6  -98.1  -0.5605  -1.9    9.1	SW J1753.5-0127
288.9860  10.9418    4.0  18.0 -117.0   0.1994   2.9   11.1	GRS 1915+105
299.4918  35.0455    3.9   8.6   35.3   0.1864   3.0   10.5	Cyg X-1
308.3752  40.8832    0.0  16.5   57.5   0.0103   0.1   12.7	Cyg X-3
326.1726  38.1819    4.6  25.9   87.0  -0.2467  -2.5    8.4	Cyg X-2
274.5659  31.7808    0.6  21.7  -39.3   1.2494  17.9 ------	UNKNOWN
254.8956  27.3415    1.7  38.8  -47.7   0.8172   6.9 ------	UNKNOWN
Post-slew image of 15-350 keV band
Time interval of the image:
62.300600 830.200600

# RAcent  DECcent POSerr Theta    Phi  PeakCts   SNR AngSep     Name
#  [deg]    [deg]    ['] [deg]  [deg]                   [']
254.3123  35.4261   23.7  17.2  -13.4  -0.4180  -0.5    8.7	Her X-1
268.3800  -1.2942   16.6  33.6 -109.9   1.3634   0.7    9.5	SW J1753.5-0127
288.8353  10.7530    0.0  24.8 -156.4  -0.6929  -0.7   11.8	GRS 1915+105
299.6102  35.2040    0.4  21.1  132.7  26.6454  29.9    1.0	Cyg X-1
307.9239  40.8992   15.5  28.2  120.6   0.8306   0.7    9.0	Cyg X-3
326.1852  38.2376    6.5  42.2  125.3   5.1019   1.8    5.1	Cyg X-2
244.2022  59.6415    3.3  34.4   32.0   4.4453   3.5 ------	UNKNOWN
201.5822  52.4537    2.8  55.3   13.7  22.0409   4.1 ------	UNKNOWN
303.5739  16.7315    3.1  30.3  171.8   3.6649   3.7 ------	UNKNOWN
297.0950  11.5673    3.1  29.0 -172.0   3.2437   3.7 ------	UNKNOWN
235.9005  29.3703    2.0  33.2  -25.0   5.6395   5.7 ------	UNKNOWN
289.0285   0.4311    2.6  34.2 -147.5   4.5006   4.4 ------	UNKNOWN
241.9174  12.1119    2.4  35.9  -57.0   6.4055   4.8 ------	UNKNOWN
280.7647 -15.7984    3.6  48.0 -129.2  13.9108   3.2 ------	UNKNOWN
234.0044   5.8256    2.8  45.9  -56.9  17.8327   4.2 ------	UNKNOWN