Analysis Summary
Notes:
- 1) No attempt has been made to eliminate the non-significant decimal places.
- 2) This batgrbproduct analysis is done using the HEASARC data.
- 3) This batgrbproduct analysis is using the flight position for the mask-weighting calculation.
======================================================================
BAT GRB EVENT DATA PROCESSING REPORT
Process Script Ver: batgrbproduct v2.48
Process Start Time: Mon Oct 24 00:10:41 EDT 2022
Host Name: batproc1
Current Working Dir: /local/data/bat1/alien/Swift_3rdBATcatalog/event/batevent_reproc/trigger1088376
======================================================================
Trigger: 01088376 Segment: 000
BAT Trigger Time: 660603204.992 [s; MET]
Trigger Stop: 660603206.016 [s; MET]
UTC: 2021-12-07T20:52:56.775700 [includes UTCF correction]
Where From?: TDRSS position message
BAT
RA: 149.625262667391 Dec: -24.3518427204482 [deg; J2000]
Catalogged Source?: NO
Point Source?: YES
GRB Indicated?: YES [ by BAT flight software ]
Image S/N Ratio: 7.77
Image Trigger?: NO
Rate S/N Ratio: 11.4455231422596 [ if not an image trigger ]
Image S/N Ratio: 7.77
Analysis Position: [ source = BAT ]
RA: 149.625262667391 Dec: -24.3518427204482 [deg; J2000]
Refined Position: [ source = BAT pre-slew burst ]
RA: 149.60097305815 Dec: -24.3607187048821 [deg; J2000]
{ 09h 58m 24.2s , -24d 21' 38.6" }
+/- 2.27666502515794 [arcmin] (estimated 90% radius based on SNR)
+/- 1.03095611508269 [arcmin] (formal 1-sigma fit error)
SNR: 9.39055029531038
Angular difference between the analysis and refined position is 1.430497 arcmin
Partial Coding Fraction: 0.625 [ including projection effects ]
Duration
T90: 3.7279999256134 +/- 0.871394276910417
Measured from: -0.935999989509583
to: 2.79199993610382 [s; relative to TRIGTIME]
T50: 1.68799996376038 +/- 0.709985879650207
Measured from: 0.0199999809265137
to: 1.70799994468689 [s; relative to TRIGTIME]
Fluence
Peak Flux (peak 1 second)
Measured from: -0.151999950408936
to: 0.848000049591064 [s; relative to TRIGTIME]
Total Fluence
Measured from: -1.30400002002716
to: 2.97200000286102 [s; relative to TRIGTIME]
Band 1 Band 2 Band 3 Band 4
15-25 25-50 50-100 100-350 keV
Total 0.094267 0.133822 0.071108 0.002686
0.016902 0.017988 0.015773 0.013725 [error]
Peak 0.028238 0.046829 0.033656 0.005259
0.008531 0.008911 0.008115 0.006863 [error]
[ fluence units of on-axis counts / fully illuminated detector ]
======================================================================
====== Table of the duration information =============================
Value tstart tstop
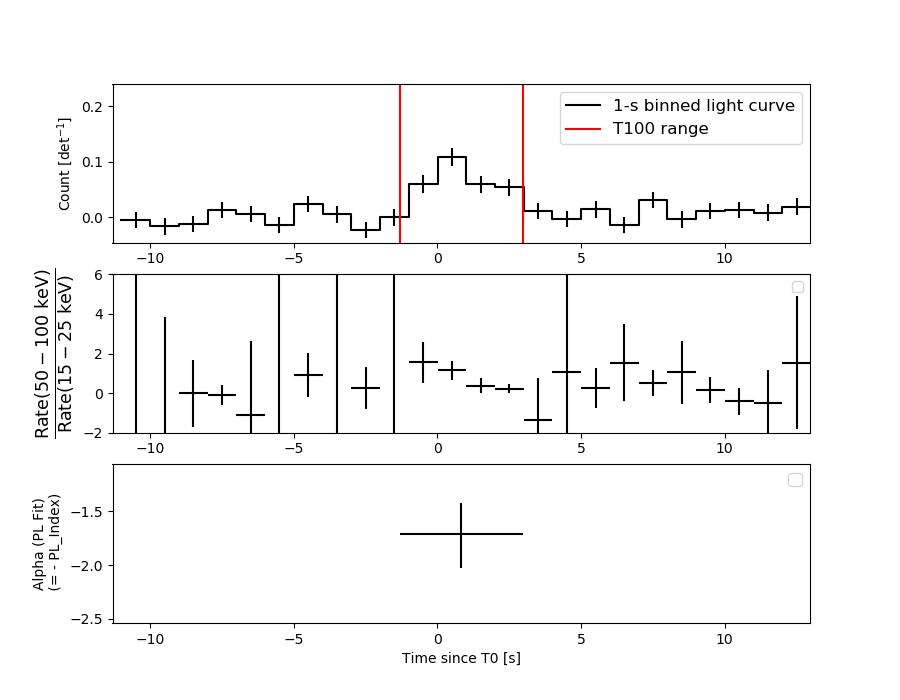
T100 4.276 -1.304 2.972
T90 3.728 -0.936 2.792
T50 1.688 0.020 1.708
Peak 1.000 -0.152 0.848
====== Spectral Analysis Summary =====================================
Model : spectral model: simple power-law (PL) and cutoff power-law (CPL)
Ph_index : photon index: E^{Ph_index}
Ph_90err : 90% error of the photon index
Epeak : Epeak in keV
Epeak_90err: 90% error of Epeak
Norm : normalization at 50 keV in both the PL model and CPL model
Nomr_90err : 90% error of the normalization
chi2 : Chi-Squared
dof : degree of freedo
=== Time-averaged spectral analysis ===
(Best model with acceptable fit: N/A)
Model Ph_index Ph_90err_low Ph_90err_hi Epeak Epeak_90err_low Epeak_90err_hi Norm Nomr_90err_low Norm_90err_hi chi2 dof
PL -1.715 -0.315 0.295 - - - 4.68e-03 -8.81e-04 8.51e-04 67.350 57
CPL -1.698 -1.975 1.260 840.849 -840.839 -840.849 4.78e-03 -9.77e-04 1.72e-02 67.350 56
=== 1-s peak spectral analysis ===
(Best model with acceptable fit: N/A)
Model Ph_index Ph_90err_low Ph_90err_hi Epeak Epeak_90err_low Epeak_90err_hi Norm Nomr_90err_low Norm_90err_hi chi2 dof
PL -1.560 -0.397 0.373 - - - 7.33e-03 -1.79e-03 1.76e-03 66.040 57
CPL 0.012 -1.813 3.144 62.868 -14.772 -62.868 4.62e-02 -4.62e-02 1.62e+00 63.920 56
=== Fluence/Peak Flux Summary ===
Model Band1 Band2 Band3 Band4 Band5 Total
15-25 25-50 50-100 100-350 15-150 15-350 keV
Fluence PL 3.13e-08 5.04e-08 6.14e-08 1.47e-07 1.85e-07 2.90e-07 erg/cm2
90%_error_low -7.71e-09 -8.21e-09 -1.55e-08 -6.45e-08 -3.58e-08 -8.15e-08 erg/cm2
90%_error_hi 8.12e-09 8.20e-09 1.55e-08 9.04e-08 3.65e-08 1.02e-07 erg/cm2
Peak flux PL 3.20e-01 3.10e-01 2.11e-01 2.24e-01 9.31e-01 1.06e+00 ph/cm2/s
90%_error_low -1.10e-01 -7.35e-02 -6.42e-02 -1.11e-01 -2.14e-01 -2.48e-01 ph/cm2/s
90%_error_hi 1.21e-01 7.29e-02 6.36e-02 1.58e-01 2.14e-01 2.51e-01 ph/cm2/s
Fluence CPL 3.12e-08 5.05e-08 6.15e-08 1.43e-07 1.85e-07 2.86e-07 erg/cm2
90%_error_low -8.94e-09 -8.28e-09 -1.55e-08 -8.93e-08 -3.91e-08 -1.28e-07 erg/cm2
90%_error_hi 8.24e-09 1.08e-08 1.63e-08 5.53e-08 3.61e-08 6.00e-08 erg/cm2
Peak flux CPL 2.41e-01 3.56e-01 2.34e-01 5.90e-02 8.78e-01 8.90e-01 ph/cm2/s
90%_error_low -2.41e-01 -9.23e-02 -7.84e-02 -5.90e-02 -2.26e-01 -2.36e-01 ph/cm2/s
90%_error_hi 1.50e-01 9.95e-02 8.04e-02 2.15e-01 2.24e-01 2.91e-01 ph/cm2/s
======================================================================
Image
Pre-slew 15.0-350.0 keV image (Event data)
#   RAcent    DECcent   POSerr    Theta     Phi              Peak Cts       SNR   Name
  149.6010   -24.3607   0.0204    33.0060     8.9684         0.3040143      9.391 TRIG_01088376

Foreground time interval of the image:
 -1.304   2.972 (delta_t =   4.276 [sec])
Background time interval of the image:
-239.992  -1.304 (delta_t = 238.688 [sec])
Light Curves
Note: The mask-weighted lightcurves have units of either count/det or counts/sec/det, where a det is 0.4 x 0.4 = 0.16 sq cm.
Full-time range; 1 s binning
Other quick-look light curves:
- 64 ms binning (zoomed)
- 16 ms binning (zoomed)
- 8 ms binning (zoomed)
- 2 ms binning (zoomed)
- SN=5 or 10 s binning (full-time range)
- Raw light curve
Spectra
- 64 ms binning (zoomed)
- 16 ms binning (zoomed)
- 8 ms binning (zoomed)
- 2 ms binning (zoomed)
- SN=5 or 10 s binning (full-time range)
- Raw light curve
Spectra
Notes:
- 1) The fitting includes the systematic errors.
- 2) When the burst includes telescope slew time periods, the fitting uses an average response file made from multiple 5-s response files through out the slew time plus single time preiod for the non-slew times, and weighted by the total counts in the corresponding time period using addrmf. An average response file is needed becuase a spectral fit using the pre-slew DRM will introduce some errors in both a spectral shape and a normalization if the PHA file contains a lot of the slew/post-slew time interval.
- 3) For fits to more complicated models (e.g. a power-law over a cutoff power-law), the BAT team has decided to require a chi-square improvement of more than 6 for each extra dof.
Time averaged spectrum fit using the average DRM
Power-law model

Time interval is from   -1.304 sec. to    2.972 sec.

Spectral model in power-law:
------------------------------------------------------------
Parameters  : value       lower 90%   higher 90%
Photon index: -1.71518     ( -0.314738   0.294775 )
Norm@50keV  : 4.67777E-03    ( -0.000881097   0.000850935 )
------------------------------------------------------------
#Fit statistic  : Chi-Squared                   67.35     using 59 bins.
 Reduced chi-squared = 1.18158
# Null hypothesis probability of 1.64e-01 with 57 degrees of freedom

Photon flux (15-150 keV)    in 4.276 sec: 0.624618 ( -0.102047  0.10212 ) ph/cm2/s
Energy fluence (15-150 keV)             : 1.85011e-07 ( -3.57598e-08  3.65318e-08 ) ergs/cm2
Cutoff power-law model
Time interval is from   -1.304 sec. to    2.972 sec.
Spectral model in the cutoff power-law:
------------------------------------------------------------
Parameters  : value       lower 90%   higher 90%
Photon index: -1.69842     ( -1.9755   1.25961 )
Epeak [keV] : 840.849      ( -826.61 -826.62 )
Norm@50keV  : 4.77525E-03    ( -0.000981027   0.0172159 )
------------------------------------------------------------
#Fit statistic  : Chi-Squared                   67.35     using 59 bins.
 Reduced chi-squared = 1.20268
# Null hypothesis probability of 1.42e-01 with 56 degrees of freedom

Photon flux (15-150 keV)    in 4.276 sec: 0.624207 ( -0.10421  0.102063 ) ph/cm2/s
Energy fluence (15-150 keV)             : 1.84756e-07 ( -3.91234e-08  3.6125e-08 ) ergs/cm2
1-s peak spectrum fit
Power-law model
Time interval is from   -0.152 sec. to    0.848 sec.

Spectral model in power-law:
------------------------------------------------------------
Parameters  : value       lower 90%   higher 90%
Photon index: -1.56004     ( -0.39674   0.373015 )
Norm@50keV  : 7.33184E-03    ( -0.00179196   0.00175792 )
------------------------------------------------------------
#Fit statistic  : Chi-Squared                   66.04     using 59 bins.
 Reduced chi-squared = 1.1586
# Null hypothesis probability of 1.93e-01 with 57 degrees of freedom

Photon flux (15-150 keV)    in 1 sec: 0.930918 ( -0.213908  0.214232 ) ph/cm2/s
Energy fluence (15-150 keV)             : 6.89334e-08 ( -1.78688e-08  1.83316e-08 ) ergs/cm2
Cutoff power-law model
Time interval is from   -0.152 sec. to    0.848 sec.
Spectral model in the cutoff power-law:
------------------------------------------------------------
Parameters  : value       lower 90%   higher 90%
Photon index: 0.0123266     ( -1.82364   3.13305 )
Epeak [keV] : 62.8684      ( -14.6765 -62.7733 )
Norm@50keV  : 4.62132E-02    ( -0.0469938   1.61633 )
------------------------------------------------------------
#Fit statistic  : Chi-Squared                   63.92     using 59 bins.
 Reduced chi-squared = 1.14143
# Null hypothesis probability of 2.18e-01 with 56 degrees of freedom

Photon flux (15-150 keV)    in 1 sec: 0.878142 ( -0.226049  0.224458 ) ph/cm2/s
Energy fluence (15-150 keV)             : 6.27581e-08 ( -1.80115e-08  1.96595e-08 ) ergs/cm2
Time-resolved spectra
Distribution
T90 vs. Hardness ratio plot
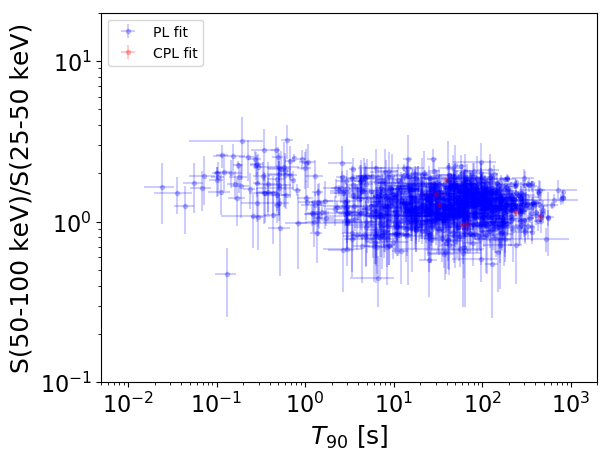
T90                                   = N/A sec.
Hardness ratio (energy fluence ratio) = N/A
S(15-50 keV) vs. S(50-150 keV) plot
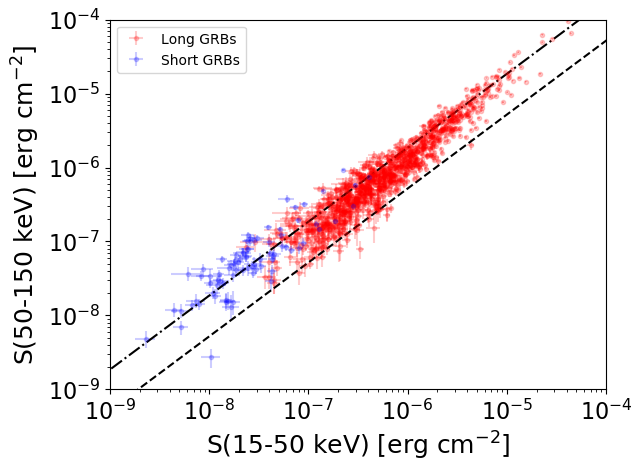
S(15-50 keV)  = N/A
S(50-150 keV) = N/A
The dash-dotted line and the dashed line traces the fluences calculated from the Band function with Epeak = 15 and 150 keV, respectively. Both lines assume a canonical values of alpha = -1 and beta = -2.5.
Mask shadow pattern
IMX = 6.416148507647752E-01, IMY = -1.012591665025407E-01
Spacecraft aspect plot
Bright source in the pre-burst/pre-slew/post-slew images
Pre-burst image of 15-350 keV band
Time interval of the image:
-239.992000 -1.304000

# RAcent  DECcent POSerr Theta    Phi  PeakCts   SNR AngSep     Name
#  [deg]    [deg]    ['] [deg]  [deg]                   [']
135.4300 -40.4738    6.1  52.9   12.3   1.6362   1.9    6.6	Vela X-1
189.8198  -2.8156    2.4  28.1  -86.6   1.8037   4.8 ------	UNKNOWN
188.3276 -19.9533    3.2  35.8  -57.2   1.5307   3.6 ------	UNKNOWN
213.4814  36.4109    3.8  55.1 -144.9   5.0286   3.1 ------	UNKNOWN
Pre-slew background subtracted image of 15-350 keV band
Time interval of the image:
-1.304000 2.972000

# RAcent  DECcent POSerr Theta    Phi  PeakCts   SNR AngSep     Name
#  [deg]    [deg]    ['] [deg]  [deg]                   [']
135.5550 -40.6035   20.9  52.9   12.1   0.0464   0.6    3.2	Vela X-1
133.4481   2.0971    2.3  29.8   69.9   0.2034   5.0 ------	UNKNOWN
149.6010 -24.3607    1.2  33.0    9.0   0.3040   9.4 ------	UNKNOWN
182.0644  29.1655    2.2  29.4 -158.6   0.1426   5.3 ------	UNKNOWN
205.4777  53.4457    2.6  58.6 -166.0   0.5559   4.5 ------	UNKNOWN
196.9903 -25.0231    2.1  45.2  -59.4   0.5052   5.3 ------	UNKNOWN
Post-slew image of 15-350 keV band
Time interval of the image:
64.708610 962.039800

# RAcent  DECcent POSerr Theta    Phi  PeakCts   SNR AngSep     Name
#  [deg]    [deg]    ['] [deg]  [deg]                   [']
135.5058 -40.5751    1.0  20.1    6.1   8.1694  11.7    1.6	Vela X-1
170.4575 -60.4927    5.9  38.9  -42.8   2.5294   1.9    8.9	Cen X-3
186.5932 -62.6475    9.1  45.5  -49.4   3.0272   1.3    7.6	GX 301-2
 92.5683 -33.0337    4.2  50.2   39.7  12.3287   2.7 ------	UNKNOWN
156.5385  28.8356    3.4  53.6  160.9  10.2342   3.4 ------	UNKNOWN
164.6153  26.2338    4.1  52.6  170.3   6.4796   2.9 ------	UNKNOWN
145.9252  -6.8460    3.8  17.9  141.3   2.1546   3.0 ------	UNKNOWN
187.8417  -3.8507    2.3  42.1 -139.7   6.5832   5.0 ------	UNKNOWN
193.6214  14.6383    3.0  58.0 -154.2  16.1165   3.8 ------	UNKNOWN