Analysis Summary
Notes:
- 1) No attempt has been made to eliminate the non-significant decimal places.
- 2) This batgrbproduct analysis is done using the HEASARC data.
- 3) This batgrbproduct analysis is using the flight position for the mask-weighting calculation.
======================================================================
BAT GRB EVENT DATA PROCESSING REPORT
Process Script Ver: batgrbproduct v2.48
Process Start Time: Mon Oct 24 00:07:45 EDT 2022
Host Name: batproc1
Current Working Dir: /local/data/bat1/alien/Swift_3rdBATcatalog/event/batevent_reproc/trigger1088940
======================================================================
Trigger: 01088940 Segment: 000
BAT Trigger Time: 660921027.872 [s; MET]
Trigger Stop: 660921027.936 [s; MET]
UTC: 2021-12-11T13:09:59.634260 [includes UTCF correction]
Where From?: (*SHORT BURST*) TDRSS scaled map message
BAT
RA: 212.272224151866 Dec: 27.883504540405 [deg; J2000]
Catalogged Source?: NO
Point Source?: YES
GRB Indicated?: YES [ by BAT flight software ]
Image S/N Ratio: 11.49
Image Trigger?: NO
Rate S/N Ratio: 60.8769250208977 [ if not an image trigger ]
Image S/N Ratio: 11.49
Analysis Position: [ source = BAT ]
RA: 212.272224151866 Dec: 27.883504540405 [deg; J2000]
Refined Position: [ source = BAT pre-slew burst ]
RA: 212.271803402477 Dec: 27.884421505113 [deg; J2000]
{ 14h 09m 05.2s , +27d 53' 03.9" }
+/- 0.79868939817544 [arcmin] (estimated 90% radius based on SNR)
+/- 0.342010574338239 [arcmin] (formal 1-sigma fit error)
SNR: 41.9351783873204
Angular difference between the analysis and refined position is 0.059371 arcmin
Partial Coding Fraction: 0.2167969 [ including projection effects ]
Duration
T90: 50.7119998931885 +/- 0.929240641376705
Measured from: 2.932000041008
to: 53.6439999341965 [s; relative to TRIGTIME]
T50: 21.1759999990463 +/- 0.163168721316993
Measured from: 6.86000001430511
to: 28.0360000133514 [s; relative to TRIGTIME]
Fluence
Peak Flux (peak 1 second)
Measured from: 6.8639999628067
to: 7.8639999628067 [s; relative to TRIGTIME]
Total Fluence
Measured from: -0.00399994850158691
to: 120.712000012398 [s; relative to TRIGTIME]
Band 1 Band 2 Band 3 Band 4
15-25 25-50 50-100 100-350 keV
Total 55.254222 80.111635 64.599144 18.663319
0.228152 0.280279 0.275534 0.197466 [error]
Peak 2.990676 6.009280 6.970394 2.669811
0.063150 0.088958 0.100935 0.080485 [error]
[ fluence units of on-axis counts / fully illuminated detector ]
======================================================================
====== Table of the duration information =============================
Value tstart tstop
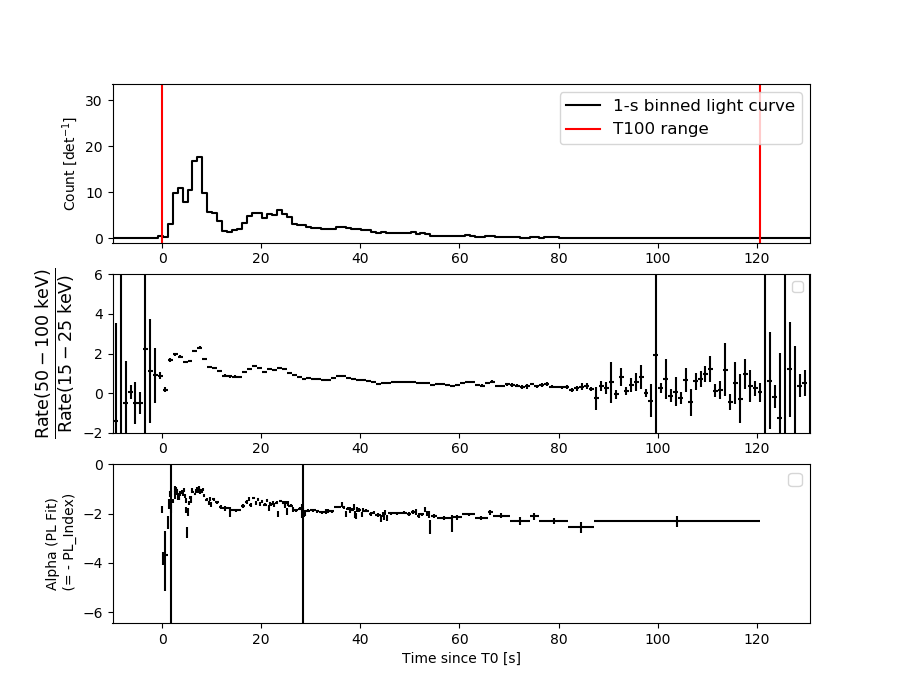
T100 120.716 -0.004 120.712
T90 50.712 2.932 53.644
T50 21.176 6.860 28.036
Peak 1.000 6.864 7.864
====== Spectral Analysis Summary =====================================
Model : spectral model: simple power-law (PL) and cutoff power-law (CPL)
Ph_index : photon index: E^{Ph_index}
Ph_90err : 90% error of the photon index
Epeak : Epeak in keV
Epeak_90err: 90% error of Epeak
Norm : normalization at 50 keV in both the PL model and CPL model
Nomr_90err : 90% error of the normalization
chi2 : Chi-Squared
dof : degree of freedo
=== Time-averaged spectral analysis ===
(Best model with acceptable fit: N/A)
Model Ph_index Ph_90err_low Ph_90err_hi Epeak Epeak_90err_low Epeak_90err_hi Norm Nomr_90err_low Norm_90err_hi chi2 dof
PL -1.515 -0.020 0.020 - - - 1.27e-01 -1.58e-03 1.57e-03 29.530 57
CPL -1.442 -0.066 0.084 512.674 -234.629 -512.674 1.36e-01 -5.64e-03 9.89e-03 27.260 56
=== 1-s peak spectral analysis ===
(Best model with acceptable fit: N/A)
Model Ph_index Ph_90err_low Ph_90err_hi Epeak Epeak_90err_low Epeak_90err_hi Norm Nomr_90err_low Norm_90err_hi chi2 dof
PL -1.036 -0.033 0.034 - - - 1.35e+00 -2.61e-02 2.61e-02 58.330 57
CPL -0.734 -0.141 0.146 260.076 -64.122 166.860 1.79e+00 -2.20e-01 2.58e-01 44.780 56
=== Fluence/Peak Flux Summary ===
Model Band1 Band2 Band3 Band4 Band5 Total
15-25 25-50 50-100 100-350 15-150 15-350 keV
Fluence PL 1.99e-05 3.63e-05 5.07e-05 1.49e-04 1.46e-04 2.55e-04 erg/cm2
90%_error_low -5.41e-07 -6.04e-07 -5.52e-07 -3.61e-06 -1.62e-06 -3.63e-06 erg/cm2
90%_error_hi 5.48e-07 6.04e-07 5.51e-07 3.67e-06 1.62e-06 3.65e-06 erg/cm2
Peak flux PL 9.43e-03 1.30e-01 1.48e+00 1.29e+02 6.72e+00 1.28e+02 ph/cm2/s
90%_error_low N/A N/A N/A N/A N/A N/A ph/cm2/s
90%_error_hi N/A N/A N/A N/A N/A N/A ph/cm2/s
Fluence CPL 1.94e-05 3.62e-05 5.12e-05 1.39e-04 1.45e-04 2.46e-04 erg/cm2
90%_error_low -7.89e-07 -6.11e-07 -7.30e-07 -9.94e-06 -1.67e-06 -1.01e-05 erg/cm2
90%_error_hi 7.73e-07 6.10e-07 7.66e-07 1.02e-05 1.66e-06 1.05e-05 erg/cm2
Peak flux CPL 3.23e+01 4.75e+01 4.79e+01 6.22e+01 1.53e+02 1.90e+02 ph/cm2/s
90%_error_low -1.99e+00 -1.24e+00 -1.23e+00 -6.86e+00 -3.27e+00 -7.82e+00 ph/cm2/s
90%_error_hi 2.04e+00 1.24e+00 1.24e+00 7.95e+00 3.28e+00 8.75e+00 ph/cm2/s
======================================================================
Image
Pre-slew 15.0-350.0 keV image (Event data)

#   RAcent    DECcent   POSerr    Theta     Phi              Peak Cts       SNR   Name
  212.2718    27.8844   0.0046    41.5073   -53.3807        90.1512993     41.935 TRIG_01088940

Foreground time interval of the image:
 -0.004   8.829 (delta_t =   8.833 [sec])
Background time interval of the image:
-239.872  -0.004 (delta_t = 239.868 [sec])
Light Curves
Note: The mask-weighted lightcurves have units of either count/det or counts/sec/det, where a det is 0.4 x 0.4 = 0.16 sq cm.
Full-time range; 1 s binning
Other quick-look light curves:
- 64 ms binning (zoomed)
- 16 ms binning (zoomed)
- 8 ms binning (zoomed)
- 2 ms binning (zoomed)
- SN=5 or 10 s binning (full-time range)
- Raw light curve
Spectra
- 64 ms binning (zoomed)
- 16 ms binning (zoomed)
- 8 ms binning (zoomed)
- 2 ms binning (zoomed)
- SN=5 or 10 s binning (full-time range)
- Raw light curve
Spectra
Notes:
- 1) The fitting includes the systematic errors.
- 2) When the burst includes telescope slew time periods, the fitting uses an average response file made from multiple 5-s response files through out the slew time plus single time preiod for the non-slew times, and weighted by the total counts in the corresponding time period using addrmf. An average response file is needed becuase a spectral fit using the pre-slew DRM will introduce some errors in both a spectral shape and a normalization if the PHA file contains a lot of the slew/post-slew time interval.
- 3) For fits to more complicated models (e.g. a power-law over a cutoff power-law), the BAT team has decided to require a chi-square improvement of more than 6 for each extra dof.
Time averaged spectrum fit using the average DRM
Power-law model

Time interval is from   -0.004 sec. to  120.712 sec.

Spectral model in power-law:
------------------------------------------------------------
Parameters  : value       lower 90%   higher 90%
Photon index: -1.51526     ( -0.0202739   0.0203569 )
Norm@50keV  : 0.127390    ( -0.00157609   0.0015727 )
------------------------------------------------------------
#Fit statistic  : Chi-Squared                   29.53     using 59 bins.
 Reduced chi-squared = 0.51807
# Null hypothesis probability of 9.99e-01 with 57 degrees of freedom

Photon flux (15-150 keV)    in 120.7 sec: 15.9699 ( -0.2528  0.2538 ) ph/cm2/s
Energy fluence (15-150 keV)             : 0.000145524 ( -1.62222e-06  1.62461e-06 ) ergs/cm2
Cutoff power-law model

Time interval is from   -0.004 sec. to  120.712 sec.
Spectral model in the cutoff power-law:
------------------------------------------------------------
Parameters  : value       lower 90%   higher 90%
Photon index: -1.442     ( -0.0663039   0.0838663 )
Epeak [keV] : 512.674      ( -234.723 -512.768 )
Norm@50keV  : 0.135641    ( -0.00563691   0.00989233 )
------------------------------------------------------------
#Fit statistic  : Chi-Squared                   27.26     using 59 bins.
 Reduced chi-squared = 0.486786
# Null hypothesis probability of 1.00e+00 with 56 degrees of freedom

Photon flux (15-150 keV)    in 120.7 sec: 15.8328 ( -0.2916  0.2933 ) ph/cm2/s
Energy fluence (15-150 keV)             : 0.000145184 ( -1.6657e-06  1.66374e-06 ) ergs/cm2
1-s peak spectrum fit
Power-law model
Time interval is from    6.864 sec. to    7.864 sec.

Spectral model in power-law:
------------------------------------------------------------
Parameters  : value       lower 90%   higher 90%
Photon index: -1.03556     ( -0.0334794   0.033601 )
Norm@50keV  : 1.34635    ( -0.0261386   0.0261007 )
------------------------------------------------------------
#Fit statistic  : Chi-Squared                   58.33     using 59 bins.
 Reduced chi-squared = 1.02333
# Null hypothesis probability of 4.26e-01 with 57 degrees of freedom

Photon flux (15-150 keV)    in 1 sec: 6.71672 (    ) ph/cm2/s
Energy fluence (15-150 keV)             : 1.4381e-05 ( -2.80971e-07  2.81229e-07 ) ergs/cm2
Cutoff power-law model
Time interval is from    6.864 sec. to    7.864 sec.
Spectral model in the cutoff power-law:
------------------------------------------------------------
Parameters  : value       lower 90%   higher 90%
Photon index: -0.733944     ( -0.141499   0.145742 )
Epeak [keV] : 260.076      ( -64.1228 166.86 )
Norm@50keV  : 1.79165    ( -0.220177   0.257982 )
------------------------------------------------------------
#Fit statistic  : Chi-Squared                   44.78     using 59 bins.
 Reduced chi-squared = 0.799643
# Null hypothesis probability of 8.59e-01 with 56 degrees of freedom

Photon flux (15-150 keV)    in 1 sec: 153.088 ( -3.269  3.277 ) ph/cm2/s
Energy fluence (15-150 keV)             : 1.42722e-05 ( -2.8889e-07  2.88424e-07 ) ergs/cm2
Time-resolved spectra
Distribution
T90 vs. Hardness ratio plot

T90                                   = N/A sec.
Hardness ratio (energy fluence ratio) = N/A
S(15-50 keV) vs. S(50-150 keV) plot

S(15-50 keV)  = N/A
S(50-150 keV) = N/A
The dash-dotted line and the dashed line traces the fluences calculated from the Band function with Epeak = 15 and 150 keV, respectively. Both lines assume a canonical values of alpha = -1 and beta = -2.5.
Mask shadow pattern

IMX = 5.278701697646530E-01, IMY = 7.102783141836446E-01
Spacecraft aspect plot

Bright source in the pre-burst/pre-slew/post-slew images
Pre-burst image of 15-350 keV band
Time interval of the image:
-239.872000 -0.004000

# RAcent  DECcent POSerr Theta    Phi  PeakCts   SNR AngSep     Name
#  [deg]    [deg]    ['] [deg]  [deg]                   [']
254.3096  35.2453    5.3  42.3 -109.0   2.1191   2.1    9.3	Her X-1
299.5713  35.1816    2.3  57.8 -153.2   6.7138   5.1    1.5	Cyg X-1
308.0181  40.8896   33.1  55.4 -163.3   0.2755   0.3    5.6	Cyg X-3
147.7311  44.6136    2.6  38.7   34.6   1.9117   4.4 ------	UNKNOWN
153.0440  58.1247    2.7  25.7   44.3   1.2440   4.3 ------	UNKNOWN
321.5356  59.1191    3.0  43.0  175.7   1.6180   3.9 ------	UNKNOWN
219.3348  60.8968    2.9   9.6  -82.1   0.8837   4.0 ------	UNKNOWN
290.9543  44.0271    2.8  46.9 -150.7   1.9664   4.1 ------	UNKNOWN
201.6065  20.9066    2.7  48.6  -39.7   3.3819   4.3 ------	UNKNOWN
Pre-slew background subtracted image of 15-350 keV band
Time interval of the image:
-0.004000 8.828590

# RAcent  DECcent POSerr Theta    Phi  PeakCts   SNR AngSep     Name
#  [deg]    [deg]    ['] [deg]  [deg]                   [']
254.5773  35.2081   27.5  42.4 -109.3  -1.5751  -0.4   10.0	Her X-1
299.6359  35.2928   11.1  57.7 -153.3   5.3745   1.0    5.9	Cyg X-1
308.1691  41.0011    5.3  55.4 -163.4  -4.5042  -2.2    3.9	Cyg X-3
166.5590  28.8358    4.0  47.0    4.8   2.5673   2.9 ------	UNKNOWN
291.2931  42.3066    2.9  48.6 -149.9   6.9550   4.0 ------	UNKNOWN
189.5919  14.4932    3.6  56.1  -26.1  13.2183   3.2 ------	UNKNOWN
212.2718  27.8844    0.3  41.5  -53.4  90.1559  41.9 ------	UNKNOWN
Post-slew image of 15-350 keV band
Time interval of the image:
68.228590 298.228600

# RAcent  DECcent POSerr Theta    Phi  PeakCts   SNR AngSep     Name
#  [deg]    [deg]    ['] [deg]  [deg]                   [']
254.4374  35.3701    3.0  36.4 -156.3   1.3132   3.8    1.9	Her X-1
212.2672  27.8813    0.6   0.0  -10.9   4.1266  18.6 ------	UNKNOWN
206.7197  11.5751    3.6  17.1  -24.9   0.7244   3.2 ------	UNKNOWN
218.3481  20.2646    2.5   9.4  -81.0   1.1050   4.7 ------	UNKNOWN
262.8109  23.5846    3.7  45.4 -140.2   1.7720   3.2 ------	UNKNOWN